Evaporation-triggered microdroplet nucleation and the four life phases of an evaporating Ouzo drop
Abstract
Evaporating liquid droplets are omnipresent in nature and technology, such as in inkjet printing, coating, deposition of materials, medical diagnostics, agriculture, food industry, cosmetics, or spills of liquids. While the evaporation of pure liquids, liquids with dispersed particles, or even liquid mixtures has intensively been studied over the last two decades, the evaporation of ternary mixtures of liquids with different volatilities and mutual solubilities has not yet been explored. Here we show that the evaporation of such ternary mixtures can trigger a phase transition and the nucleation of microdroplets of one of the components of the mixture. As model system we pick a sessile Ouzo droplet (as known from daily life - a transparent mixture of water, ethanol, and anise oil) and reveal and theoretically explain its four life phases: In phase I, the spherical cap-shaped droplet remains transparent, while the more volatile ethanol is evaporating, preferentially at the rim of the drop due to the singularity there. This leads to a local ethanol concentration reduction and correspondingly to oil droplet nucleation there. This is the beginning of phase II, in which oil microdroplets quickly nucleate in the whole drop, leading to its milky color which typifies the so-called ’Ouzo-effect’. Once all ethanol has evaporated, the drop, which now has a characteristic non-spherical-cap shape, has become clear again, with a water drop sitting on an oil-ring (phase III), finalizing the phase inversion. Finally, in phase IV, also all water has evaporated, leaving behind a tiny spherical cap-shaped oil drop.
Physics of Fluids group, Department of Science and Technology, Mesa+ Institute, and J. M. Burgers Centre for Fluid Dynamics, University of Twente, P.O. Box 217, 7500 AE Enschede, The Netherlands,
Department of Mechanical Engineering, Eindhoven University of Technology, P.O. Box 513, 5600 MB Eindhoven, The Netherlands,
Faculty EEMCS, University of Twente, P.O. Box 217, 7500 AE Enschede, The Netherlands,
School of Civil, Environmental and Chemical Engineering, RMIT University, Melbourne, VIC 3001, Australia,
Max Planck Institute for Dynamics and Self-Organization,37077 Göttingen, Germany.
A coffee drop evaporating on a surface leaves behind a roundish stain [1]. The reason lies in the pinning of the drop on the surface, together with the singularity of the evaporation rate at the edge of the drop, towards where the colloidal particles of the drop are thus transported. This so-called ’coffee-stain-effect’ has become paradigmatic for a whole class of problems, and nearly 20 years after Deegan et al. [1] presented it to the scientific community, still various questions are open and the problem and its variations keep inspiring the community [2, 1, 3, 4, 5, 6, 7, 8, 9, 10, 11, 12, 13, 14, 15, 16, 17, 18],
What happens when an Ouzo drop is evaporating? The Greek drink Ouzo (or the French Pastis or the Turkish Raki) consists of an optically transparent ternary mixture of water, ethanol, and anise oil. When served, water is often added, leading to the nucleation of many tiny oil droplets, which give the drink its milky appearance. This is the so-called Ouzo-effect [19]. As we will see in this paper, also this problem can become paradigmatic, due to its extremely rich behavior, now for the evaporation-triggered phase separation of ternary liquids and droplet nucleation therein.
The reason for the Ouzo effect lies in the varying solubility of oil in ethanol-water mixtures: With increasing water concentration during the solvent exchange (i.e., water being added), the oil solubility decreases, leading to droplet nucleation in the bulk and – if present – also on hydrophobic surfaces (so-called surface nanodroplets) [20, 21].
Experiments and numerical modelling
0.1 Series of events during evaporation of a sessile Ouzo droplet and their interpretation
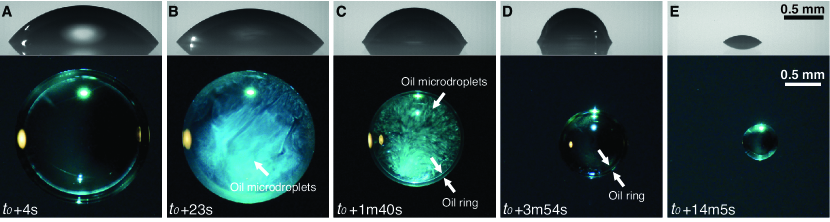
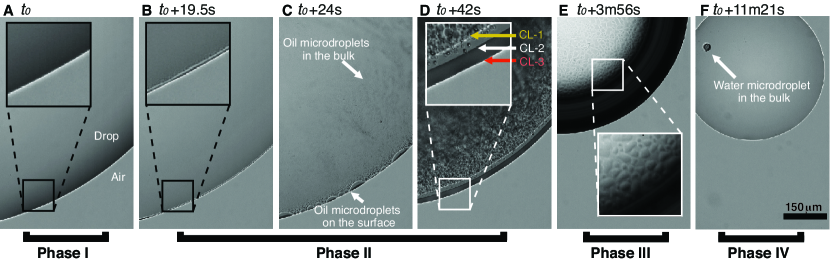
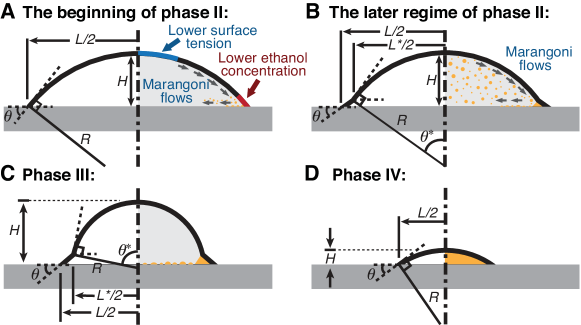
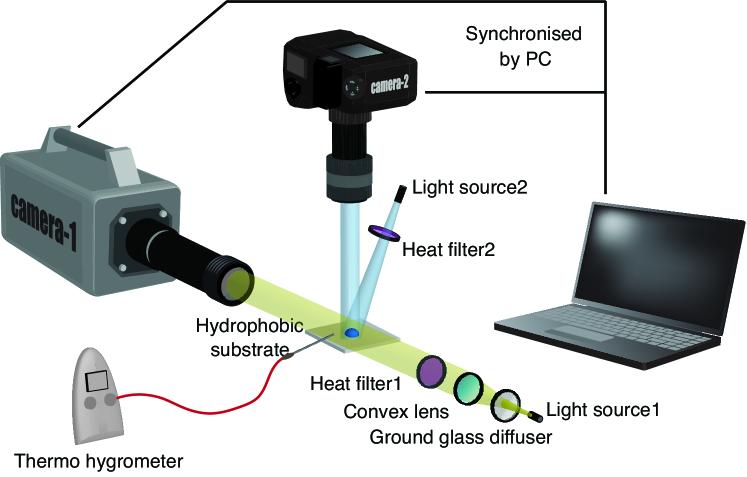
When an Ouzo drop is evaporating, this Ouzo effect is locally triggered by the preferred evaporation of the more volatile ethanol as compared to the less volatile water and the even less volatile oil. As the evaporation rate is highest at the rim of the drop [6], we expect the oil microdroplets to nucleate there first. Indeed, this is what we see in our experiments, in which we have deposited a Ouzo drop on a transparent hydrophobic octadecyltrichlorosilane (OTS)-glass surface, monitoring its evaporation under ambient conditions with optical imaging synchronized from the top and side (Fig. 1 and Videos S1 and S2, experimental setup sketch see Fig. S1), from the bottom (Fig. 2 and Video S3) and confocally (Fig. 3 and Videos S4 and S5). For an illustration of the evaporation process see Figure 4. At early times, the Ouzo drop is transparent and has a spherical cap shape (Fig. 1A). This is phase I of the evaporation process. After about 20 s, indeed microdroplets nucleate at the rim of the drop, as seen in Figure 2B or Figure 3B. This signals the onset of phase II, sketched in Figure 4A: The microdroplets are convected throughout the whole Ouzo drop, giving it its ’milky’ appearance (Fig. 1B). Due to the declining ethanol concentration, the liquid becomes oil-oversaturated (cf. Materials and Methods section and Fig. S2). This oil-oversaturation leads to further oil droplet growth [22] and coalescence (Fig. 2C). Finally, an oil ring appears, caused by the deposition of coalesced oil microdroplets on the surface (sketch in Fig. 4B and Figs. 1C, 2D and 3A). The zoomed-in graph in Figure 2D and Figure 3A reveal the presence of three contact lines (CL) near the oil ring: CL-1, where mixture, surface and oil meet, CL-2, where mixture, oil and air meet, and CL-3, where oil, substrate and air meet. The drop is still opaque due to the presence of the numerous oil microdroplets in the bulk. However, after about four minutes all ethanol has evaporated. In this phase III, most of the oil droplets have coalesced to an oil ring at the rim of the drop, which now is transparent again (Figs. 1D, 2E, and 3C and sketch in Fig. 4C). In this now phase-inverted phase the drop has a very characteristic non-spherical cap-shape, with a water drop sitting on an oil ring. Subsequently, the water drop evaporates more and more. The last traces of water are seen as water microdroplets in the bulk of the remaining spherical-cap shaped sessile oil drop (Fig. 2F, phase IV), which now again has a single contact line. After around 14 minutes of evaporation, only a tiny sessile oil droplet is left (with 1/70th of the original drop volume), now in spherical cap shape again (Fig. 1E and sketch Fig. 4D).
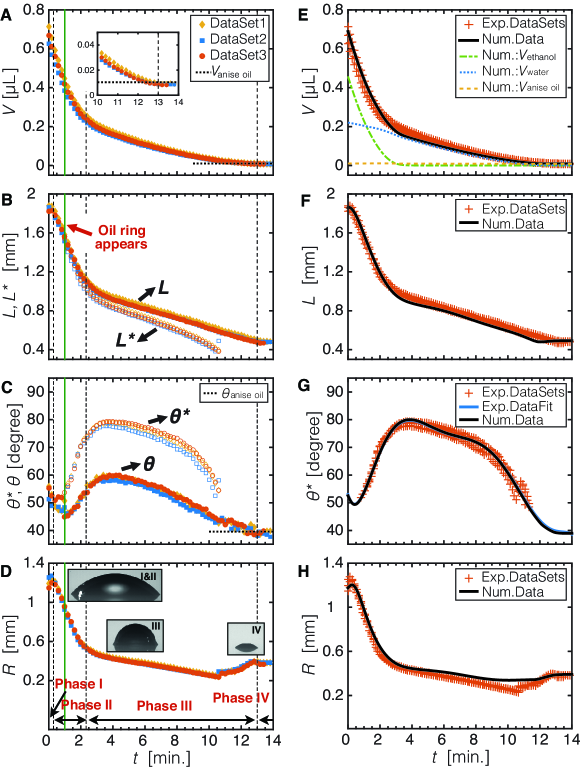
The four life phases of the evaporating Ouzo drop are not only seen visually, but also reflect in various quantitative measures of the drop geometry, as extracted from the images of Figures 1 and 2, according to the procedure described in Supporting Information and Fig. S3. In Figure 5A-D we show the measured drop volume , its contact diameter and the diameter of the water drop sitting on the oil ring, the corresponding contact angles and , and the radius of curvature of the drop. The four characteristic phases are separated by three black vertical dashed lines: Phase I, before the Ouzo effect starts, i.e. before the microdroplets are optically observed at the rim of the drop; phase II, before all ethanol in the drop has evaporated, which is determined from a force balance analysis at CL-2 as detailed in Materials and Methods section; phase III, before the water in the drop has evaporated, i.e. before approaches the contact angle of pure anise oil; and phase IV, when the drop consists of oil only.
After approximately , the oil ring appeared which is indicated in Figure 5 as a green vertical solid line. From that moment, the evolution of the two additional geometrical parameters and is shown. In phases I and II, and decrease very fast, due to the high evaporation rate of ethanol. Once all ethanol has evaporated, at the transition from phase II to phase III, there is a sharp reduction in the slope of , , and , which in phase-inverted phase III decrease more slowly due to the lower evaporation rate of water. In this regime, a force balance holding at CL-2 reaches its steady state (Fig. S4). In the final phase, converges to the initial volume of the anise oil (zoomed-in graph in Fig. 5A) and approaches the contact angle of pure anise oil (Fig. 5C).
0.2 Numerical modelling of the evaporation process and its quantitative understanding
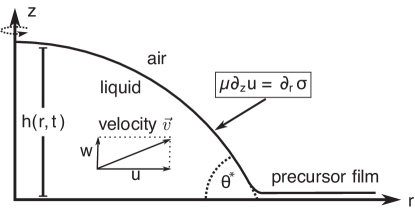
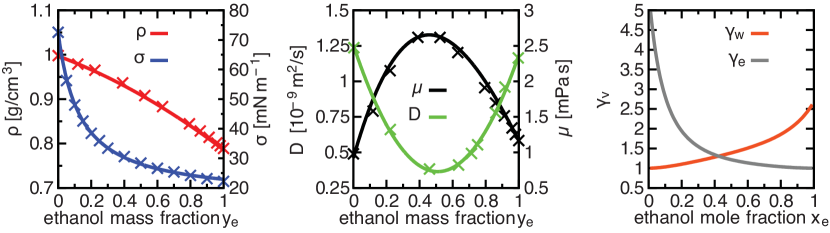
More quantitative insight is gained from numerically modelling the evaporation process of the Ouzo drop (Video S6). Our numerical model is based on an axisymmetric lubrication approximation in the spirit of the evaporating coffee-stain lubrication models of refs. [1, 23, 5, 15], but now for a multi-component liquid. The relative mass fractions are governed by a convection-diffusion equation, with a sink-term at the air-drop interface, reflecting evaporation, and ethanol-concentration-dependent material parameters such as density, diffusivity, viscosity, surface tension, and activity coefficients (quantifying the evaporation rate). These composition-dependent properties are depicted in Fig. S6. The Ouzo drop is described assuming axial symmetry, with the liquid-air interface given by the height function and the fluid velocity (cf. Fig. S5 ). Details of the model are given in Supporting Information.
The fundamental difference between the evaporation of a pure liquid [23] and that of a mixture is the vapor-liquid equilibrium. While in the case of a pure liquid the vapor concentration (mass per volume) directly above the liquid-air interface is saturated, i.e. , it is lower for the case of mixtures. The relation between liquid composition and vapor composition is expressed by Raoult’s law. As in the evaporation model for a pure liquid [23], the evaporation rate is obtained by solving the quasi-steady vapor-diffusion in the gas phase with the boundary conditions given by Raoult’s law above the drop, by the no-flux condition at the drop-free substrate, and far away from the drop by the given vapor concentrations for ethanol and for water, where is the relative humidity. The relative humidity can be measured to some limited precision, but here had to be corrected for to better describe the experimental data, as detailed in Materials and Methods section. Finally, the evaporation rates are given by with the vapor diffusion coefficients of in air. In contrast to the evaporation of a pure fluid, the evaporation rate of a mixture component does not only depend on the geometric shape of the drop, but also on the entire composition along the liquid-air interface. The resulting -dependent height loss due to evaporation is given in Supporting Information.
In the simulations, the fitted experimental data (shown in Fig. 5G) were used as the time-dependent contact angle. The quantitative measures of the drop geometry resulting from the numerical simulations are shown in Figures 5E, 5F, and 5H, together with the experimental data, showing excellent quantitative agreement. From Figure 5E, which next to the total volume also shows the partial volumes of the three components water, ethanol, and oil, we can reconfirm that the volume loss is initially mainly due to the evaporation of ethanol (phase I and II), followed by a slower evaporation of the remaining water (phase III). Finally, only the tiny non-volatile oil droplet remains (phase IV).
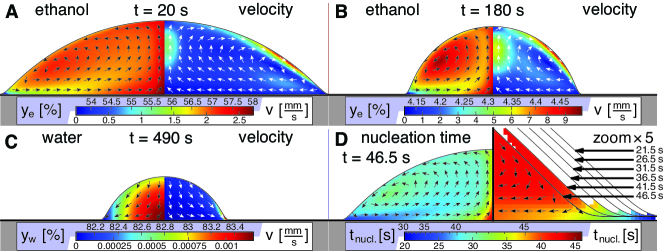
Our numerical simulations of the process allow us to deduce the fully spatially resolved mass fraction and velocity fields, and , respectively. In Figures 6a and 6b we show the ethanol mass fraction and the velocity field for two different times and . It is clearly visible how the preferential evaporation of ethanol near the contact line, which leads to a larger surface tension there, drives a fast Marangoni flow. As a consequence, ethanol is quickly replenished at the liquid-air interface and can completely evaporate. We note that the direction of the convection roll inside the drop is opposite to the case of a pure liquid, where the flow goes outwards at the bottom of the drop and inwards at the liquid-gas interface [1, 23, 15]. We also note that the ethanol concentration differences are relatively small – in the beginning about 3% and later not more than 0.5% – but nonetheless sufficient to drive a strong Marangoni flow with velocities up to the order of 10 mm/s. Due to the high contact angle during phases II and III, the lubrication approximation predicts the precise values of the velocity only to a limited accuracy. The qualitative flow field and the order of magnitude, however, have been validated by a comparison with the corresponding non-approximated Stokes flow at individual time steps. Figure 6C shows the water mass fraction for , since at these later times ethanol is virtually not present anymore, again together with the velocity field, which is now again outwards directly above the substrate.
Finally, in Figure 6D we show the oil droplet nucleation time , which is defined as the moment when the local composition crosses the phase separation curve and enters the Ouzo region (see Fig. S2A). According to the numerical results, the oil droplet nucleation starts at near the contact line, in perfect agreement with our experimental findings, and nucleation is possible in the entire droplet at .
Conclusions and outlook
In summary, we have experimentally and numerically studied the evaporation of a millimetre sized sessile Ouzo drop on a hydrophobic substrate. How stimulating it can be to study the evaporation of alcoholic drinks has interestingly also been shown in a very recent parallel but independent work by Kim et al. [24], who studied the drying of whisky droplets, which give a uniform deposition pattern. For that system suspended material and surface-absorbed macromoleculars play a major role and offer a physicochemical avenue for the control of coatings. From our point of view, just as the evaporating whisky droplet, also the evaporating ouzo droplet can advance our scientific understanding of complex flow phenomena and phase transitions and their interaction. In this paper we have observed evaporation-triggered phase transitions and the nucleation of oil microdroplets, first at the edge of the Ouzo drop and then allover, followed by a phase inversion, and altogether four different life phases of the ouzo drop, which serves as paradigmatic model system for ternary mixtures of liquids with different volatilities and mutual solubilities. Here, water as the second but most volatile liquid (after the very quickly evaporating ethanol) also evaporates in about ten minutes, leaving behind a tiny drop of anise oil. For other ternary mixtures only one liquid may be volatile, implying phase III with a binary mixture and nucleated microdroplets of one liquid and its peculiar optical properties would be the final state.
Tuning and optimizing the material and chemical properties of the individual liquids in the ternary mixture such as volatilities and mutual solubilities and polymerisibility (e.g. under UV exposure such as in ref. [25]) offers a plethora of applications for medical diagnostics, the controlled deposition of complex liquids in the food and cosmetic industry and for coating applications [26, 27, 28, 29, 30], in agriculture, or the food or cosmetics industry, for inkjet printing of LED or OLED devices and solar cells [31, 32, 33, 34, 35], and for rapid manufacturing. Here we studied the deposition on smooth surfaces, but pre-patterning the surface with hydrophobic patches [36] offers even further opportunities, by directing the nucleation of nano- or microdroplets at will, allowing for the self-organised bottom-up construction of structures.
Material
0.3 Ternary diagram and initial composition of the Ouzo drop
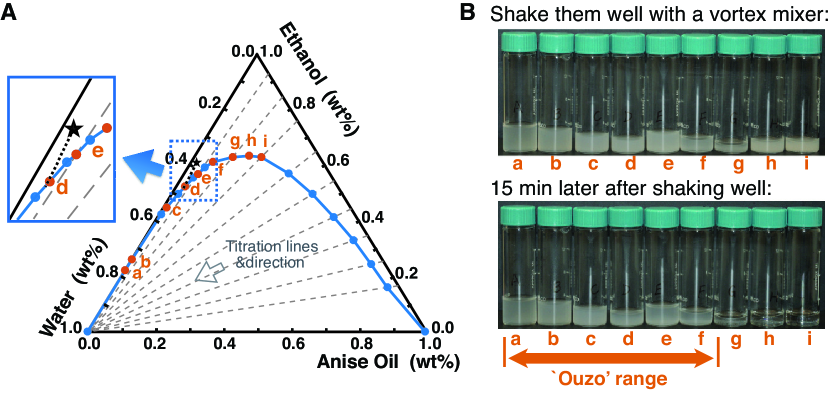
The ternary liquid of the Ouzo drop in this study was the mixture of Milli-Q water (produced by a Reference A+ system, Merck Millipore, at ), ethanol (EMD Millipore, Ethanol absolute for analysis) and anise oil (Aldrich, Anise oil). The ternary diagram of the mixture was titrated at a temperature of , which is similar to the environmental temperature during the evaporation experiment. roups of ethanol and anise oil mixtures with different component weight ratios were properly prepared to be used as titrants (see Table S1). The volume of water (titrate) was precisely measured by a motorised syringe pump (Harvard, PHD 2000). For each ethanol and anise oil mixture, a phase-separation point was determined as shown in Fig. S2A. Photographs of the macrosuspensions corresponding to the different phase-separation points were taken. Thereby, the stability of the macrosuspension along the phase separation curve was determined (Fig. S2B). Starting with point g, the homogeneous macrosuspension is not stable anymore. The part of the curve with a stable macrosuspension was identified as the boundary of the Ouzo region in the ternary diagram, which is labeled Ouzo range. According to the ternary diagram, the initial composition of the Ouzo drop was chosen as water, ethanol and anise oil in terms of weight fractions, which is indicated by the black star in Fig. S2A. Starting from this initial point, the drop composition is guaranteed to cross the phase separation curve and enter the Ouzo region during the evaporation process. A black dotted line in the magnified subfigure of Fig. S2A shows the numerically obtained temporal evolution of the composition near the contact line of the Ouzo drop.
0.4 Experimental methods
A Ouzo drop ( water, ethanol and anise oil in terms of weight fractions) was produced through a custom needle (Hamilton, O.D.I.D. (mm): 0.210.11) by a motorised syringe pump (Harvard, PHD 2000). The whole evolution of the Ouzo drop was observed by two synchronised cameras, one (Photron Fastcam SA-X2 64GB, 50 fps at 1,024 1,024 pixel resolution) affixed with a high-magnification zoom lens system (Thorlabs, MVL12X3Z) for side-view recordings and another (Nikon D800E, 25fps at 1,920 1,080 pixel resolution) affixed with an identical lens system for top-view recordings (Figure 1, Videos S1 and S2). The temperature around the evaporating drop was measured using a thermometer sensor. The relative humidity in the lab was measured with a standard hygrometer (RH for RH at ) The temperature of the three experimental datasets in Figure 5 was between and . The relative humidity was around . The image analysis was performed by custom-made MATLAB codes. In order to have a detailed observation of the evolutionary process at the rim of the Ouzo drop, an inverted microscope (Olympus GX51) was used to focus on the contact region. A fast speed camera (Photron Fastcam SA-X2 64GB, 50 fps at 1,024 1,024 pixel resolution) was connected to the microscope with an intermediate tube. Figure 2 and Video S3 were taken with a long working m-plan fluorite objective (Olympus MPLFLN20XBD, Wd = 3.0 mm, NA = 0.45). Besides 2D imaging, we also took advantage of a confocal microscope (Nikon Confocal Microscopes A1 system) in stereo-imaging. A real-time observation was carried out to monitor the movement of the oil droplets due to the convective flow and the formation of oil ring in a 3D view. A air objective (CFI Plan Apochromat VC /0.75 DIC, NA = 0.75, WD = 1.0 mm) and a air objective (CFI Plan Fluor /0.75 DIC, NA = 0.75, WD = 0.66 mm) were employed to take Figures 3A, 3B and Figure 3C, respectively. In Figures 3B and 3C and Video S5, anise oil was labeled by Nile Red (Microscopy grade, Sigma-Aldrich, Netherlands). In Figure3A and Video S4, in order to simultaneously label oil and solution with different color dyes during the whole evaporating process, anise oil was replaced by trans-Anethole oil (, Sigma-Aldrich, Netherlands) labeled by perylene (sublimed grade, , Sigma-Aldrich, Netherlands) in yellow color. Water/ethanol mixture was labeled by fluorescein 5(6)-isothiocyanate (High performance liquid chromatography, Sigma-Aldrich, Netherlands) in blue color.
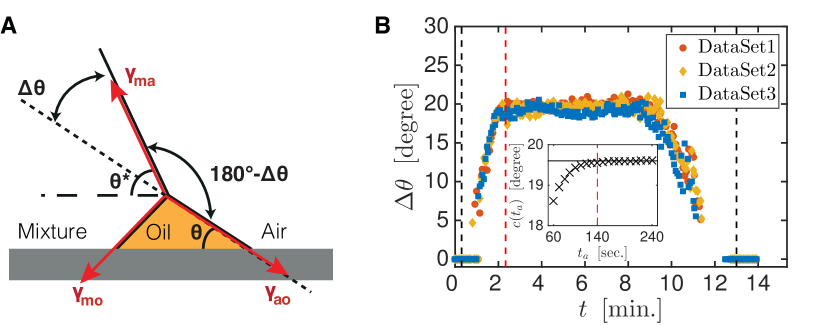
0.5 Definitions of the four life phases of an evaporating Ouzo drop
We divided the Ouzo drop evaporation process into four phases: Phase I is defined as the initial regime, before the critical phase separation composition is attained at the contact line. Phase II is the time from the initial occurrence of the oil nucleation until the complete evaporation of the ethanol component. Phase III is the regime when the remaining water amount in the drop evaporates. The final phase IV is the period after the the remaining water has evaporated. The first black vertical dashed lines (separation between phases I and II) and the third one (separation of phases III and IV) in Figure 5 were able to be optically determined from the top or bottom view video recordings. However, the transition between phase II and phase III cannot be detected from the video recordings. Instead, the second black vertical dashed line in Figure 5 was determined from an equilibrium analysis as a simplified model (cf. Fig. S4A): at the air-mixture-oil contact line (CL-2 in Figs. 2B, 3A and 3C), a force balance holds. The influence of the line tension on the balance can be neglected [37]. Each variation of the composition in the drop alters the equilibrium of this balance[38, 37]. At the moment when ethanol has completely evaporated, this equilibrium attains its steady state. From that moment, the three phases which meet at the contact line CL-2 are water from the liquid of the drop, anise oil from the oil ring and air from the surroundings. The composition of the air phase near the contact line CL-2 is assumed to be constant. Hence, the angle between the mixture-air interface and the oil-air interface has to be constant. Mathematically speaking, this means that has to be a constant. The quantity was estimated by the subtraction , since the dimension of the oil-air interface is small in the initial part of phase III. In Fig. S4B, the evolution of as a function of time is shown. It is clearly visible that after a rapid increase remains constant for a very long time. Therefore, we fitted from time to time by a constant . The inserted graph in fig. S4B shows the relation between and . We selected the time as the separation moment between phase II and phase III.
0.6 Numerical model
The evolution of the drop shape (cf. Fig. S5) is solved by a diagonally-implicit Runge-Kutta method, the vapor diffusion-limited evaporation rates are calculated by a boundary element method and the convection-diffusion equations for the composition are treated with an upwind finite differences scheme. For the composition-dependency of the mass density, the surface tension, the diffusion coefficient, the viscosity and the activity coefficients, we fitted experimental data of water-ethanol mixtures or used appropriate models (cf. Fig. S6). Details can be found in the Supporting Information. Our model was validated for the case of pure water by comparison with the experimental data of Gelderblom et al. [15].
0.7 Determination of the relative humidity
For the numerical simulation, we have assumed a temperature of and a relative humidity of for ethanol. Since the experimental determination of the relative humidity of water is error-prone, we have determined it as follows: At the beginning of phase III, the drop consists almost entirely of water, since the ethanol content has already evaporated and the amount of oil is still small in comparison to the remaining water volume. Therefore, we used our numerical model to fit based on the experimental data for the volume evolution during the time from to . The resulting water humidity reads .

We thank Michel Versluis for invaluable advice on imaging and Shuhua Peng for preparing the substrates. D.L. gratefully acknowledges financial support through an ERC Advanced Grant and the NWO-Spinoza programme. H.T. thanks for the financial support from china scholorship council (CSC, file No.201406890017). H.K. and C.D. gratefully acknowledge financial support by the Dutch Technology Foundation STW.
The authors declare that they have no competing financial interests.
d.lohse@utwente.nl or xuehua.zhang@rmit.edu.au.
Author Contributions
X.Z. and D.L. conceived the project. H.T., X.Z. and D.L. planned the experiments. P.L. and H.T. performed confocal microscopy experiments. H.T. performed all other experiments in the study. H.T. and D.L. analyzed the experimental data. H.K. and C.D. developed and implemented the numerical model and performed the corresponding simulations. D.L., C.D. and H.T. wrote the paper.
All authors discussed the results and commented on the manuscript.
References
- [1] R. D. Deegan, O. Bakajin, T. F. Dupont, G. Huber, S. R. Nagel, and T. A. Witten.(1997) Capillary flow as the cause of ring stains from dried liquid drops. Nature, 389(6653):827–829.
- [2] RG Picknett and R Bexon.(1977) The evaporation of sessile or pendant drops in still air. Journal of Colloid and Interface Science, 61(2):336–350.
- [3] H. Hu and R. G. Larson.(2002) Evaporation of a sessile droplet on a substrate. J. Phys. Chem. B, 106:1334.
- [4] K. Sefiane, L. Tadrist, and M. Douglas.(2003) Experimental study of evaporating water-ethanol mixture sessile drop: influence of concentration. Int. J. Heat Mass Trans., 46(23):4527–4534.
- [5] Y. O. Popov.(2005) Evaporative deposition patterns: Spatial dimensions of the deposit. Phys. Rev. E, 71:036313.
- [6] Anne-Marie Cazabat and Geoffroy Guena.(2010) Evaporation of macroscopic sessile droplets. Soft Matter, 6(12):2591–2612.
- [7] N Shahidzadeh-Bonn, S Rafai, A Azouni, and D Bonn.(2006) Evaporating droplets. J. Fluid Mech., 549:307–313.
- [8] W. D. Ristenpart, P. G. Kim, C. Domingues, J. Wan, and H. A. Stone.(2007) Influence of substrate conductivity on circulation reversal in evaporating drops. Phys. Rev. Lett., 99(23):234502.
- [9] Jung Ah Lim, Wi Hyoung Lee, Hwa Sung Lee, Ji Hwang Lee, Yeong Don Park, and Kilwon Cho.(2008) Self-organization of ink-jet-printed triisopropylsilylethynyl pentacene via evaporation-induced flows in a drying droplet. Adv. Functional Mat., 18(2):229–234.
- [10] Tian Ming, Xiaoshan Kou, Huanjun Chen, Tao Wang, Hoi-Lam Tam, Kok-Wai Cheah, Ji-Yao Chen, and Jianfang Wang.(2008) Ordered Gold Nanostructure Assemblies Formed By Droplet Evaporation. Ang. Chemie - Int. Edition, 47(50):9685–9690.
- [11] Khellil Sefiane, Samuel David, and Martin E. R. Shanahan.(2008) Wetting and evaporation of binary mixture drops. J. Phys. Chem. B, 112(36):11317–11323.
- [12] Chuanjun Liu, Elmar Bonaccurso, and Hans-Juergen Butt.(2008) Evaporation of sessile water/ethanol drops in a controlled environment. Phys. Chem. Chem. Phys., 10(47):7150.
- [13] F. Schönfeld, K. H. Graf, S. Hardt, and H.-J. Butt.(2008) Evaporation dynamics of sessile liquid drops in still air with constant contact radius. Int. J. Heat and Mass Transfer, 51:3696–3699.
- [14] John R. E. Christy, Yoshinori Hamamoto, and Khellil Sefiane.(2011) Flow transition within an evaporating binary mixture sessile drop. Phys. Rev. Lett., 106:205701.
- [15] H. Gelderblom, A. G. Marin, H. Nair, A. van Houselt, L. Lefferts, J. H. Snoeijer, and D. Lohse.(2011) How water droplets evaporate on a superhydrophobic substrate. Phys. Rev. E, 83:026306.
- [16] A. G. Marin, H. Gelderblom, D. Lohse, and J. H. Snoeijer.(2011) Order-to-disorder transition in ring-shaped colloidal stains. Phys. Rev. Lett., 107:085502.
- [17] D. Brutin, B. Sobac, B. Loquet, and J. Sampol.(2011) Pattern formation in drying drops of blood. J. Fluid Mech., 667:85–95.
- [18] Rodrigo Ledesma-Aguilar, Dominic Vella, and Julia M. Yeomans.(2014) Lattice-boltzmann simulations of droplet evaporation. Soft Matter, 10:8267–8275.
- [19] SA Vitale and JL Katz.(2003) Liquid droplet dispersions formed by homogeneous liquid-liquid nucleation: “The ouzo effect”. Langmuir, 19(10):4105–4110.
- [20] Xuehua Zhang and William Ducker.(2007) Formation of interfacial nanodroplets through changes in solvent quality. Langmuir, 23(25):12478–12480.
- [21] Detlef Lohse and Xuehua Zhang.(2015) Surface nanobubble and surface nanodroplets. Rev. Mod. Phys., 87(3):981–1035.
- [22] Xuehua Zhang, Jun Wang, Lei Bao, Erik Dietrich, Roeland C. A. van der Veen, Shuhua Peng, James Friend, Harold J. W. Zandvliet, Leslie Yeo, and Detlef Lohse.(2015) Mixed mode of dissolving immersed microdroplets at a solid-water interface. Soft Matter, 11:1889–1900.
- [23] R. D. Deegan, O. Bakajin, T. F. Dupont, G. Huber, S. R. Nagel, and T. A. Witten.(2000) Contact line deposits in an evaporating drop. Phys. Rev. E, 62:756–765.
- [24] Hyoungsoo Kim, Fran çois Boulogne, Eujin Um, Ian Jacobi, Ernie Button, and Howard A. Stone.(2016) Controlled uniform coating from the interplay of marangoni flows and surface-adsorbed macromolecules. Phys. Rev. Lett., 116:124501.
- [25] X. H. Zhang, J. M. Ren, H. J. Yang, Y. H. He, J. F. Tan, and G. G. Qiao.(2012) From transient nanodroplets to permanent nanolenses. Soft Matter, 8(16):4314–4317.
- [26] Timothy R Hughes, Mao Mao, Allan R Jones, Julja Burchard, Matthew J Marton, Karen W Shannon, Steven M Lefkowitz, Michael Ziman, Janell M Schelter, Michael R Meyer, et al.(2001) Expression profiling using microarrays fabricated by an ink-jet oligonucleotide synthesizer. Nat. Biotechnol., 19(4):342–347.
- [27] Brian Creran, Xiaoning Li, Bradley Duncan, Chang Soo Kim, Daniel F. Moyano, and Vincent M. Rotello.(2014) Detection of bacteria using inkjet-printed enzymatic test strips. ACS Applied Materials & Interfaces, 6(22):19525–19530.
- [28] Sean V Murphy and Anthony Atala.(2014) 3d bioprinting of tissues and organs. Nat. Biotechnol., 32(8):773–785.
- [29] Leonis L. da Luz, Raquel Milani, Jorlandio F. Felix, Igor R. B. Ribeiro, Márcio Talhavini, Brenno A. D. Neto, Jaroslaw Chojnacki, Marcelo O. Rodrigues, and Severino A. Júnior.(2015) Inkjet printing of lanthanide–organic frameworks for anti-counterfeiting applications. ACS Applied Materials & Interfaces, 7(49):27115–27123.
- [30] Kentaro Yamada, Terence G Henares, Koji Suzuki, and Daniel Citterio.(2015) Paper-based inkjet-printed microfluidic analytical devices. Angewandte Chemie International Edition, 54(18):5294–5310.
- [31] H. Sirringhaus, T. Kawase, R. H. Friend, T. Shimoda, M. Inbasekaran, W. Wu, and E. P. Woo.(2000) High-resolution inkjet printing of all-polymer transistor circuits. Science, 290(5499):2123–2126.
- [32] de Gans B.J, P. C. Duineveld, and U.S. Schubert.(2004) Ink jet printing of polymers: State of the art and future developments. Adv. Materials, 16(3):203–213.
- [33] C. Williams.(2006) Ink-jet printers go beyond paper. Phys. World, 19(1):24–29.
- [34] J. F. Dijksman, P. C. Duineveld, M. J. J. Hack, A. Pierik, J. M. Rensen, J. E. Rubingh, I. Schram, and M. M. Vernhout.(2007) Precision ink jet printing of polymer light emitting displays. J. Materials Chemistry, 17(6):511–5122.
- [35] K. E. Paul, W. S. Wong, S. E. Ready, and R. A. Street.(2003) Additive jet printing of polymer thin-film transistors. Appl. Phys. Lett., 83(10):2070-2072.
- [36] L. Bao, A. r. Rezk, L. Y. Yeo, and X. Zhang.(2015) Highly ordered arrays of femtoliter surface droplets. Small, 11:4850–4855.
- [37] S Torza and SG Mason.(1970) Three-phase interactions in shear and electrical fields. Journal of colloid and Interface Science, 33(1):67–83.
- [38] Ivan B Bazhlekov and Peter J Shopov.(1997) Numerical simulation of dynamic contact-line problems. Journal of Fluid Mechanics, 352:113–133.
- [39] Leonard W. Schwartz and Richard R. Eley.(1998) Simulation of droplet motion on low-energy and heterogeneous surfaces. J. Colloid Interf. Sci., 202(1):173–188.
- [40] C. Y. Lee and C. R. Wilke.(1954) Measurements of vapor diffusion coefficient. Ind. Eng. Chem., 46(11):2381–2387.
- [41] Begoña González, Noelia Calvar, Elena Gómez, and Ángeles Domínguez.(2007) Density, dynamic viscosity, and derived properties of binary mixtures of methanol or ethanol with water, ethyl acetate, and methyl acetate at t=(293.15, 298.15, and 303.15) k. The Journal of Chemical Thermodynamics, 39(12):1578–1588.
- [42] Gonzalo Vazquez, Estrella Alvarez, and Jose M. Navaza.(1995) Surface tension of alcohol water + water from 20 to 50 .degree.C. J. Chem. Eng. Data, 40(3):611–614.
- [43] Stanislav Pařez, Gabriela Guevara-Carrion, Hans Hasse, and Jadran Vrabec.(2013) Mutual diffusion in the ternary mixture of water + methanol + ethanol and its binary subsystems. Phys. Chem. Chem. Phys., 15(11):3985.
- [44] A. Zuend, C. Marcolli, B. P. Luo, and T. Peter.(2008) A thermodynamic model of mixed organic-inorganic aerosols to predict activity coefficients. Atmos. Chem. Phys., 8(16):4559–4593.
- [45] A. Zuend, C. Marcolli, A. M. Booth, D. M. Lienhard, V. Soonsin, U. K. Krieger, D. O. Topping, G. McFiggans, T. Peter, and J. H. Seinfeld.(2011) New and extended parameterization of the thermodynamic model AIOMFAC: calculation of activity coefficients for organic-inorganic mixtures containing carboxyl, hydroxyl, carbonyl, ether, ester, alkenyl, alkyl, and aromatic functional groups. Atmos. Chem. Phys., 11(17):9155–9206.
- [46] DR Lide, ed.(2005) CRC handbook of chemistry and physics. (CRC Press, Boca Raton, FL)..
Supporting Information
0.8 1. Hydrophobic octadecyltrichlorosilane (OTS)-glass surface
The glass substrate the drop was placed on is hydrophobic, being coated with an octadecyltrichlorosilane monolayer (OTS) (made at RMIT, Australia). The advancing and receding contact angle of water on this substrate are and , respectively. The contact angle of the anise oil used in the experiments on this substrate is , measured with a video-based optical contact angle measuring system (DataPhysics OCA15 Pro). Before being used, the substrates were cleaned by 15-mins sonication in ethanol and 5-mins in Milli-Q water sequentially, and subsequently dried with compressed N2 flow for 2 minutes before each experiment.
0.9 2. Image analysis and data calculation
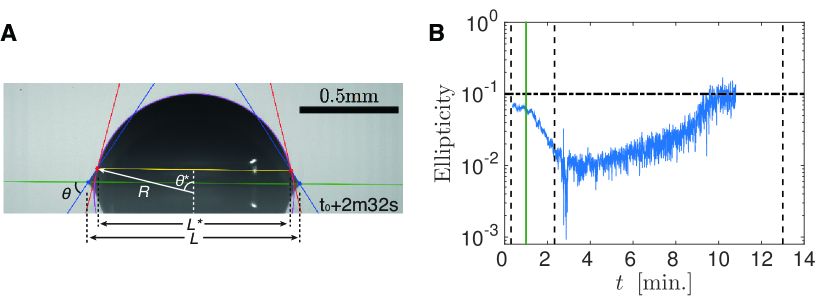
The image analysis was performed by custom-made MATLAB codes, through which all the geometric parameters at every frame were successfully determined, such as drop volume , contact angles and , lateral sizes and and droplet height (cf. Fig. S3A). The drop volume was calculated by adding the volumes of horizontal disk layers, assuming rotational symmetry of each layer with respect to the vertical axis. The contact angle , between the blue and green lines in Fig. S3A, was estimated from the profile at the contact region by polynomial fits, while , between the red and yellow lines, was calculated by a spherical cap approximation (purple circle). The drop contour above the oil ring was also fitted by elliptical fits. Since the drop size is smaller than the capillary length ( for water, for ethanol), the ellipticity of the top cap, defined as the ratio between the difference of the two semi-axes and the radius, was always below during phase II (Fig. S3B). After around 11 minutes, both the spherical cap approximation and the elliptical fittings for the water contour above the oil ring were not sufficiently accurate. The water drop diameter was too small (less than ) and there were not enough pixels to perform the contour fits. Therefore, we stopped calculating from a spherical cap approximation at around 11 minutes, when the ellipticity exceeds .
0.10 3. Variation of oil ring contact line
Remarkably, is not constant during phase III as shown in Figure 5C in the main part. This is caused by the water saturation variation at the air-oil-substrate contact line. The water diffusion speed from the mixture to the oil ring and the speed from the oil ring to the air co-determined the water saturation in the oil ring. Our other experimental work, at a higher ambient relative humidity, which attenuates the water diffusion from oil ring to air, has shown that is constant for a long time in phase III after the same initial increase in phase II. Since a detailed discussion of these experimental results is beyond the scope of this paper, they are not shown here.
0.11 4. Artificial light signal in confocal images
In Figure 3B of the main part and Video S5, the vertical blobs above surface oil microdroplets are artificial signals caused by light reflection. At early phase II, the oil microdroplets in the bulk and on the surface do not have enough dye and require a strong laser intensity to be visualised. The oil-air interfaces on the surface oil microdrolets act as a mirror reflecting the real light signals in the microdroplets. In addition, the artificial light signals caused by reflection are even more intense than the real light signals emitted from the oil microdroplets in the bulk. Hence, these artifacts cannot be suppressed by an appropriate adjustment of the brightness, the contrast or the gamma correction.
In the scanning of Figure 3C, each 2D image of the Z-stack was averaged by 4 images in order to reduce the noise and detect the surface oil microdroplets sharper, but at the expenses of scanning time. Even though the evaporating process in phase III is relatively slow, the scanning time for one 3D image still leads to a stripe-like distortion of the oil ring.
0.12 5. Numerical model
Our numerical model is based on an axisymmetric multi-component lubrication approximation. The Ouzo drop is described in cylinder coordinates with the fluid velocity , where the liquid-air interface is given by the height function . A schematic illustration is depicted in Fig. S5.
0.13 5.1. Liquid composition and local physical properties
The liquid composition is denoted in terms of mass fractions with . Here, stands for the species water, ethanol and anise oil, respectively.
During the initial phase of the evaporation, in particular when the oil nucleation has not set in yet, the presence of anise oil can be neglected (). The physical properties of the liquid, i.e. the mass density , the surface tension , the dynamic viscosity and the mutual diffusion coefficient , are therefore assumed to be given by those from binary water-ethanol mixtures. Since the nucleated oil droplets are initially small compared to the entire drop size, this assumption will also hold true at intermediate times. We have fitted experimental data of water-ethanol mixtures to incorporate the compositional dependence of , , and into our model (cf. Fig. S6).
The mass fractions are governed by the following convection-diffusion equation, where the diffusive fluxes in the ternary mixture are assumed to be in the Fickian limit with the diffusion coefficient of a binary water-ethanol mixture:
| (1) |
The mass flux source term is only present at the liquid-air interface (with the interface delta function ) and stems from the evaporation of species (cf. section 5.3).
0.14 5.2. Lubrication approximation
Due to the different mass densities of the liquid constituents, the flow in the drop is subject to the full compressible Navier-Stokes momentum equation along with the mass conservations for the individual species. An energy equation is not considered, i.e. the drop is assumed to be isothermal at room temperature , since the dominant mechanism for the Marangoni flow in the drop is the strong dependence of the surface tension on the local liquid composition.
Due to the size of the drop, the influence of gravity can be neglected. The pressure is therefore constituted by the Laplace pressure which results, at least for a homogeneous surface tension, in a spherical cap equilibrium shape:
| (2) |
In the spirit of large eddy simulations, we introduce a numerical cut-off towards the microscopic scales that are relevant near the free moving contact line. To that end, a precursor film with thickness and a corresponding disjoining pressure
| (3) |
with and are taken into account, i.e. [39]. Here, is the equilibrium contact angle. However, since the exact physical interaction of the liquid-air interface with the deposited oil ring at the contact line is not known in detail, we have fitted the experimental data for and adjust the parameter according to this fit in such way that the contact angle resulting from the numerical model resembles the experimental data.
Applying lubrication theory on the momentum equation yields the following set of governing equations:
| (4) | ||||
| (5) | ||||
| (6) |
An inhomogeneous composition along the liquid-air interface causes a shear stress, which reads in the order of the lubrication theory . With the no-slip condition at the substrate , the radial velocity is given by
| (7) |
The axial velocity is obtained from (6) and, consequently, the drop shape evolves according to
| (8) |
where the height loss stems from evaporation (cf. section 5.3).
The present model cannot account directly for the deposited oil ring and possible interactions of the nucleated oil droplets with the flow are also not taken into account. However, in the initial regime, these aspects will be not relevant.
0.15 5.3. Evaporation model
While the evaporation of anise oil can be neglected, the well-established vapor-diffusion limited evaporation model for pure fluids of Deegan et al.[1, 23] and Popov [5] has to be generalized to mixtures. The fundamental difference between a pure liquid and a mixture is the vapor-liquid equilibrium. While in the case of a pure fluid the vapor concentration (mass per volume) directly above the liquid-air interface is saturated, i.e. , it is lower for the case of mixtures. The relation between liquid composition and vapor composition is expressed by Raoult’s law, which can be written by the use of the ideal gas law as the boundary condition
| (9) |
Here, is the mole fraction of component in the liquid and is the activity coefficient which comprises possible non-idealities of the mixture. As in the evaporation model for a pure fluid, the evaporation rate is obtained by solving the quasi-steady vapor-diffusion in the gas phase with the boundary conditions (9), and far away from the drop (with relative humidity ). Finally, the evaporation rate is given by with the vapor diffusion coefficient of in air. In contrast to the evaporation of a pure fluid, the evaporation rate of a mixture component does not only depend on the geometric shape of the drop, but also on the entire composition along the liquid-air interface. The height loss velocity in (8) is finally given by
| (10) |
The values for and for water and ethanol vapor, respectively, were calculated based on the ideal gas law and the Antoine equation, whereas the vapor diffusivities read [15] and [40], respectively . The activity coefficients are depicted in Fig. S6.
| Titration1 | Titrant (ethanol-oil mixture) | Titrate2 | Weight ratios3 | |||
|---|---|---|---|---|---|---|
| No. | Ethanol(ml) | Anise oil(ml) | Water(ml) | (%) | (%) | (%) |
| 1 | 0 | 0.001 | 6 | 99.98 | 0 | 0.02 |
| 2 (a)4 | 1 | 0.001 | 2.7724 | 73.47 | 26.50 | 0.03 |
| 3 (b) | 1 | 0.002 | 2.2186 | 68.89 | 31.05 | 0.06 |
| 4 | 1 | 0.01 | 1.0658 | 51.34 | 48.17 | 0.48 |
| 5 (c) | 1.2 | 0.02 | 1.1491 | 48.50 | 50.65 | 0.84 |
| 6 | 1 | 0.03 | 0.7671 | 42.69 | 55.56 | 1.67 |
| 7 (d) | 1 | 0.04 | 0.6785 | 39.48 | 58.19 | 2.33 |
| 8 | 1 | 0.05 | 0.5821 | 35.67 | 61.27 | 3.06 |
| 9 (e) | 1.7 | 0.1 | 0.9211 | 33.85 | 62.47 | 3.67 |
| 10 | 1.5 | 0.1 | 0.7154 | 30.90 | 64.78 | 4.32 |
| 11 (f) | 1.2 | 0.1 | 0.5014 | 27.83 | 66.61 | 5.55 |
| 12 (g) | 0.7 | 0.1 | 0.2261 | 22.03 | 68.22 | 9.75 |
| 13 (h) | 1 | 0.2 | 0.2563 | 17.60 | 68.67 | 13.73 |
| 14 (i) | 0.8 | 0.2 | 0.1727 | 14.73 | 68.22 | 17.05 |
| 15 | 0.7 | 0.3 | 0.1173 | 10.50 | 62.65 | 26.85 |
| 16 | 0.6 | 0.4 | 0.0842 | 7.77 | 55.34 | 36.89 |
| 17 | 0.5 | 0.5 | 0.0635 | 5.97 | 47.01 | 47.01 |
| 18 | 0.4 | 0.6 | 0.0476 | 4.54 | 38.18 | 57.27 |
| 19 | 0.3 | 0.7 | 0.0404 | 3.88 | 28.84 | 67.28 |
| 20 | 0.2 | 0.8 | 0.0351 | 3.39 | 19.32 | 77.29 |
| 21 | 0 | 1 | 0.0041 | 0.41 | 0 | 99.59 |
-
1
The titration was conducted at a temperature of around .
-
2
Aliquot was 0.0015ml, which was the minimum volume of the water droplet created by the pipette needle during titration.
-
3
Density of anise oil at was measured as . Water and ethanol density at was obtained from a handbook [46] by linear interpolation.
-
4
Corresponding to the labels in the ternary diagram (cf. Fig. S2A).
1 Captions for Videos S1 to S6
1.1 Video S1
Experimental top-view recording of an evaporating Ouzo drop (synchronised with Video S2 in a same experiment). The initial volume of the drop is with an initial composition of water, ethanol and anise oil (a mixture we refer to as ’Ouzo’) in terms of weight fractions. The experiment was performed in the experimental setup as shown in Fig. S1.
1.2 Movie S2
Experimental side-view recording of an evaporating Ouzo drop (synchronised with Video S1 in a same experiment).
1.3 Movie S3
Experimental bottom-view recording of an evaporating Ouzo drop of the same composition as in Videos S1 and S2. The experiment was performed with an inverted microscope (Olympus GX51, 20 magnification).
1.4 Movie S4
Animation of an evaporating Ouzo drop with an initial composition of water, ethanol and tans-Anethole oil, displaying the whole evaporating process in a confocal view (20 magnification). The movie was created by a confocal microscope system.
1.5 Movie S5
Animation of an evaporating Ouzo drop with same composition as Video S1, displaying the three-dimensional dynamic motion of oil droplets in the contact line region at early times of phase II (20 magnification), created by a confocal microscope system.
1.6 Movie S6
Numerical simulation of an evaporating Ouzo drop. The detailed description of the model can be found in Materials and Methods and Supporting Information.