Virtual reality analysis of intrinsic protein geometry
with applications to cis
peptide planes
Abstract
A protein is traditionally visualised as a piecewise linear discrete curve, and its geometry is conventionally characterised by the extrinsically determined Ramachandran angles. However, a protein backbone has also two independent intrinsic geometric structures, due to the peptide planes and the side chains. Here we adapt and develop modern 3D virtual reality techniques to scrutinize the atomic geometry along a protein backbone, in the vicinity of a peptide plane. For this we compare backbone geometry-based (extrinsic) and structure-based (intrinsic) coordinate systems, and as an example we inspect the trans and cis peptide planes. We reveal systematics in the way how a cis peptide plane deforms the neighbouring atomic geometry, and we develop a virtual reality based visual methodology that can identify the presence of a cis peptide plane from the arrangement of atoms in its vicinity. Our approach can easily detect exceptionally placed atoms in crystallographic structures. Thus it can be employed as a powerful visual refinement tool which is applicable also in the case when resolution of the protein structure is limited and whenever refinement is needed. As concrete examples we identify a number of crystallographic protein structures in Protein Data Bank (PDB) that display exceptional atomic positions around their cis peptide planes.
I Introduction
The visualisation of a three dimensional discrete framed curve is central to computer graphics. The issues range from the association of ribbons and tubes to the determination of camera gaze directions along trajectories. Common applications include various aspects of aircraft and robot kinematics, stereo reconstruction and virtual reality Hanson-2006 ; Kuipers-1999 . Here we propose to extend these modern 3D virtual reality techniques to analyse crystallographic protein structures.
Geometrically, a protein backbone is often visualised as a one-dimensional piecewise linear discrete chain, with vertices that customarily coincide with the positions of the Cα atoms. Indeed, for a structureless one-dimensional chain the extrinsic and intrinsic geometries coincide. However, in the case of a protein there is an essential supplement: A protein backbone has a priori two independent intrinsic structures. One of these is specified by the side chains and the other relates to the peptide planes. Thus, in order to reliably determine the atomic anatomy of a protein we need to characterise not only the Cα backbone, but we also need to know the side chain Cβ atoms and the peptide plane O atoms. At least within the assumption that the positions of the other heavy atoms can be reliably estimated using e.g. secondary structure or backbone dependent rotamer libraries Lovell-2000 ; Schrauber-1993 ; Dunbrack-1993 ; Shapovalov-2011 ; Peng-2014 . Accordingly, in the case of a protein, a combination of both extrinsic and intrinsic coordinate systems is needed, to provide a detailed visual insight to its structure.
Here we address the intrinsic geometry which is due to peptide planes; the intrinsic geometry that relates to Cβ and other side chain atoms has been analysed in [7]. Our results demonstrate the value to go beyond the traditional approaches that visualise a protein structure either in terms of the (extrinsic) backbone based Ramachandran angles, or in terms of an (extrinsic) Cα backbone based laboratory frame which is employed by most of the available 3D protein visualisation programs including VMD, Jmol, PyMOL and many others wiki-viewer . We first show how to utilise the peptide planes along a protein backbone to determine novel, intrinsic coordinates. We then demonstrate how a detailed visual information on crystallographic protein structure can be extracted in such a coordinate system. Our construction provides a basis for the development of a future 3D virtual reality based web-server, to visually investigate the intrinsic assignment of atoms along a protein chain for the purpose of validation and refinement, and in support of biomedical and pharmaceutical research.
As an application we consider the cis peptide planes in crystallographic protein structures: In a protein, both the chemical composition and the geometric shape of a peptide plane are usually rigid, quite independently of the amino acid configuration Berkholz-2012 ; Hayward-2001 . A pair of neighbouring Cα atoms defines two of the four ‘corners’ of a peptide plane, and the other two coincide with the backbone O and H atoms; these four atoms are very tightly confined into a plane. In the crystallographic structures in Protein Data Bank (PDB) Berman-2000 , the peptide plane is mostly found in the trans conformation where the Ramachandran dihedral between CCi-1Ni and Ci-1NiC planes has the value . The cis conformation where is also relatively common in the case of the imide bond X–Pro, but it is quite rare in the case of amide bonds X–Xnp, where X denotes any amino acid and Xnp is any residue except Pro Stewart-1990 ; Jabs-1999 ; Demange-2003 ; Berkholz-2012 ; Touw-2015 . It has been proposed Jabs-1999 that the relative rarity of these cis X–Xnp peptide planes in PDB structures could be partly due to the a priori assumption which is commonly made during structure determination, that a peptide plane should be in a trans conformation. In fact, the cis X–Xnp peptide planes are found to be significantly more common among high resolution structures, where the need for a refinement is smaller than in the case of the more refinement-prone medium and low resolution structures Stewart-1990 ; Jabs-1999 . Since the cis X–Xnp bond might be more abundant than previously thought, and since the majority of these bonds seem to be located in the vicinity of functionally important regions Stoddard-1998 , there are good reasons to develop tools to visualise and analyse the way the cis bonds affect the intrinsic geometry of the neighbouring atom structure in a protein.
II Methods
In the sequel we use the index to label a residue along a protein backbone with residues, with indexing starting from the N terminus. We shall be interested in the peptide plane and its neighborhood. For a peptide plane that connects the residues and , we shall use the same index to label all the atoms, i.e. we use the indexing convention (… CCiNiC … ). This deviates from the common convention, to index an atom according to the ensuing amino acid in lieu of the adjacent peptide plane. We shall utilise two different sets of coordinates. The first, extrinsic set of coordinates, coincides with the Cα Frenet frames introduced in Hu-2011 . The second coordinate system — the one we introduce here — is intrinsic. We construct it using the C, N and O atoms of a given peptide plane: The C and N atoms appear as vertices along the piecewise linear discrete backbone, but the O atom does not: The C, N and O atoms then introduces an intrinsic framing of the backbone that we call the CNO frames.
Discrete Frenet frames and Frenet spheres
The discrete Frenet framing Hu-2011 is a purely geometric, extrinsic description of the protein backbone that builds on the coordinates of the Cα atoms. At each vertex of the backbone, we define the discrete Frenet frame () as follows: the tangent vector points from the center of the -carbon towards the center of the -carbon,
| (1) |
The binormal vector is
| (2) |
The normal vector is
| (3) |
Together, these three vectors constitute a right-handed orthonormal frame, centered at the Cα atom. In the sequel, we shall use the convention that () corresponds to the right-handed Cartesian ()() coordinate system, with the convention that is green (), is blue () and is red .
We use the Frenet frames to define the virtual Cα backbone bond () and torsion () angles as shown in Figure 1,
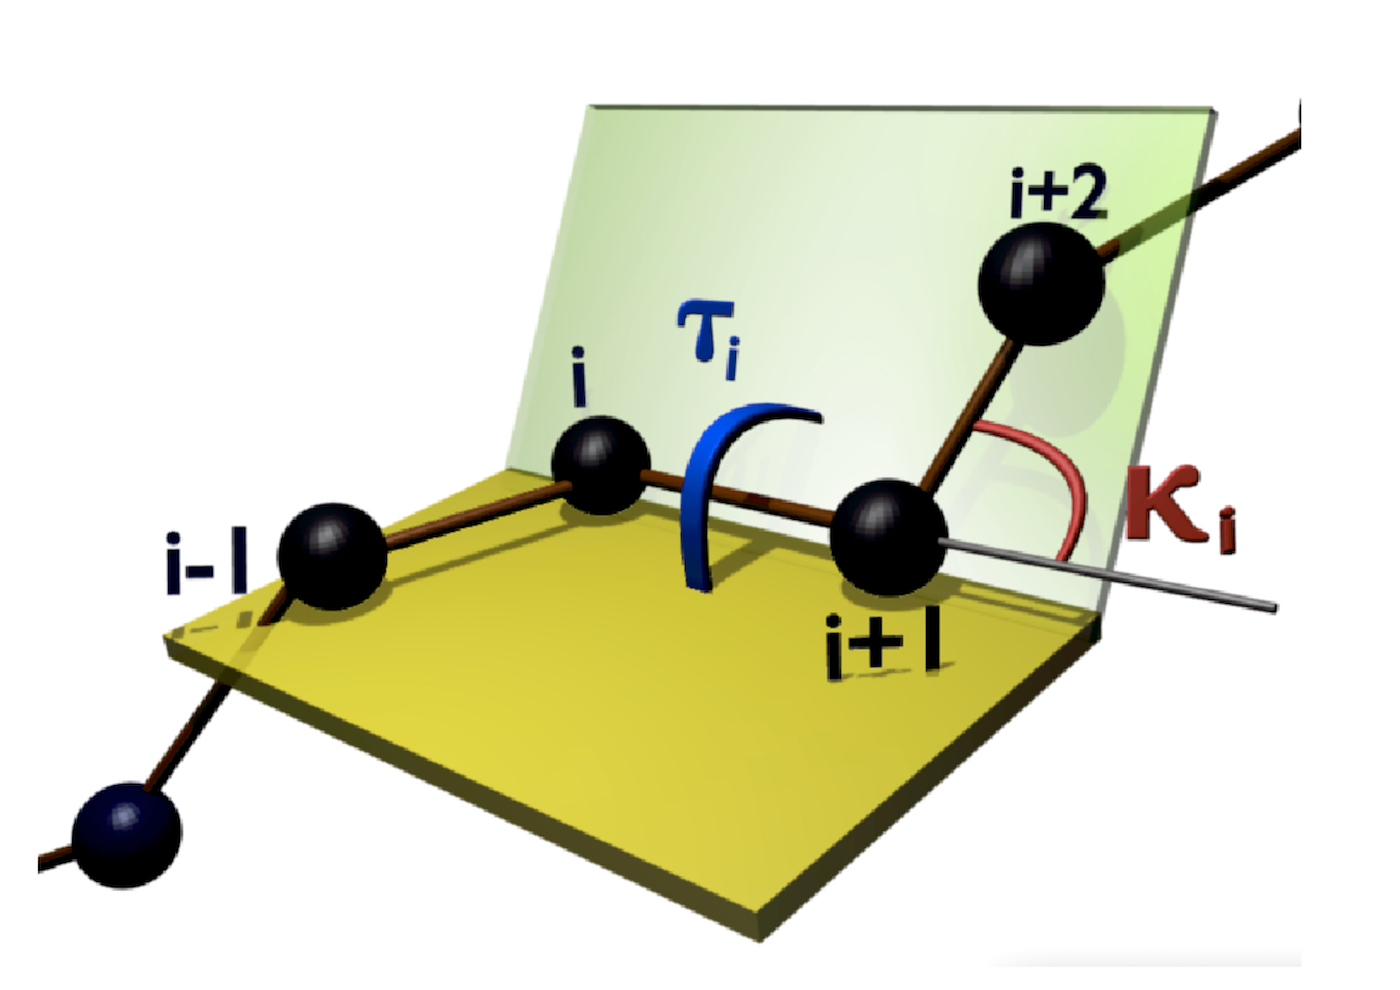
| (4) |
| (5) |
where
We identify the bond angle with the canonical latitude angle of a (Frenet) two-sphere which is centered at the Cα carbon; the tangent vector points towards the north-pole where . The torsion angle is the longitudinal angle of the sphere, so that on the great circle that passes both through the north pole and through the tip of the normal vector -axis, and the longitude increases in the counterclockwise direction around the tangent vector. Accordingly () are the standard spherical coordinates on the Frenet two-sphere.
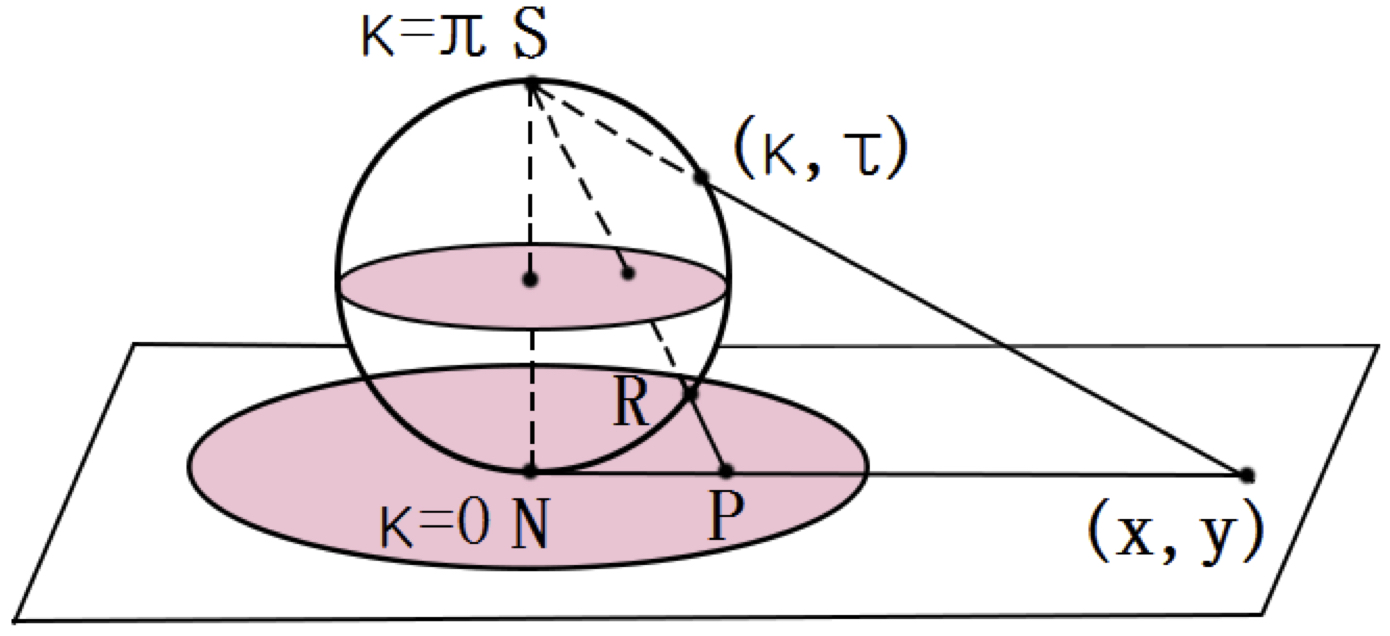
For visualisation, we find it occasionally convenient to stereographically project the sphere onto the complex () plane from the south-pole
| (6) |
as shown in Figure 2. The north pole, where , becomes mapped to the origin ()(), while the south pole is sent to infinity.
CNO frames and spheres
A pair of neighboring Cα atoms, located at sites and , defines two corners of the peptide plane. The two other corners coincide with the backbone Oi and Hi atoms. It has been found that in crystallographic structures in Protein Data Bank (PDB), the various covalent bond lengths display very small variations from their average values, and the deviations of peptide planes from a planar structure are very small. In particular, the Ni and Ci backbone atoms lie tightly on the peptide plane. Moreover, the piecewise linear discrete chain forms a covalently connected backbone of the protein, it determines a basis for introducing extrinsic coordinate systems such as the Ramachandran angles.
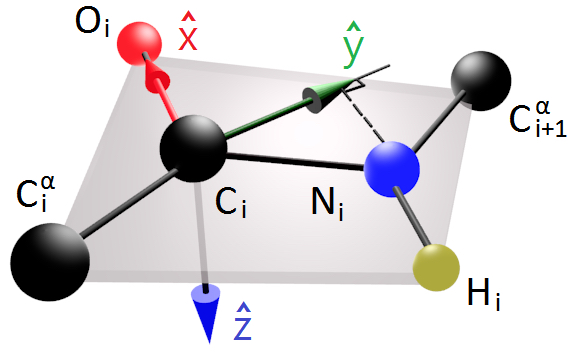
Here we shall employ the three atoms Ci, Ni and Oi of a given peptide plane to define a framing along the backbone chain. Since the Oi atom is not located along the backbone, such a framing is intrinsic to the protein. It determines a basis for introducing intrinsic, structure based coordinate systems. Accordingly, we introduce an orthonormal CNO-frame with () the ensuing right-handed Cartesian ()() orthonormal basis; we place the origin at the location of the Ci atom on the peptide plane. Specifically, let , and be the coordinates of the Ci, Ni and Oi atoms on the peptide plane. Then, we define the CNO frame as follows:
| (7) |
where
See Figure 3, where in particular we employ the color assignment () for the Cartesian () axes.
In analogy with the Frenet sphere we may also introduce a unit radius CNO two-sphere, when need be. This sphere is centered at the C atom of the peptide plane and in the sequel we denote by () the ensuing latitude and longitude angles.
III Results
We have studied in detail a subset of crystallographic PDB proteins, that consists of all presently available ultra high resolution structures that have been obtained using diffraction data with better than 1.0 Å resolution; there are 557 protein structures in our data set. We have chosen this PDB subset with the presumption, that in the case of high resolution structures the need for refinement in determining the various atomic coordinates is minimal.
The cis peptide planes
Here we define a peptide plane to be in the cis-position when the Ramachandran angle has a value between . We have inspected the PDB structures to conclude that this is a reasonable criterion; see Berkholz-2012 . We have identified a total of 383 such cis-peptide plane structures in our data set. This proposes that around 70 of proteins have at least one such peptide plane. Of these, 329 involve a proline in the corner, i.e. have the structure cis X–Pro. This leaves us with 54 cis X–Xnp peptide planes for our final analysis. Thus our statistics suggests that as many as around 10 of high resolution proteins in PDB might support a cis X–Xnp peptide plane.
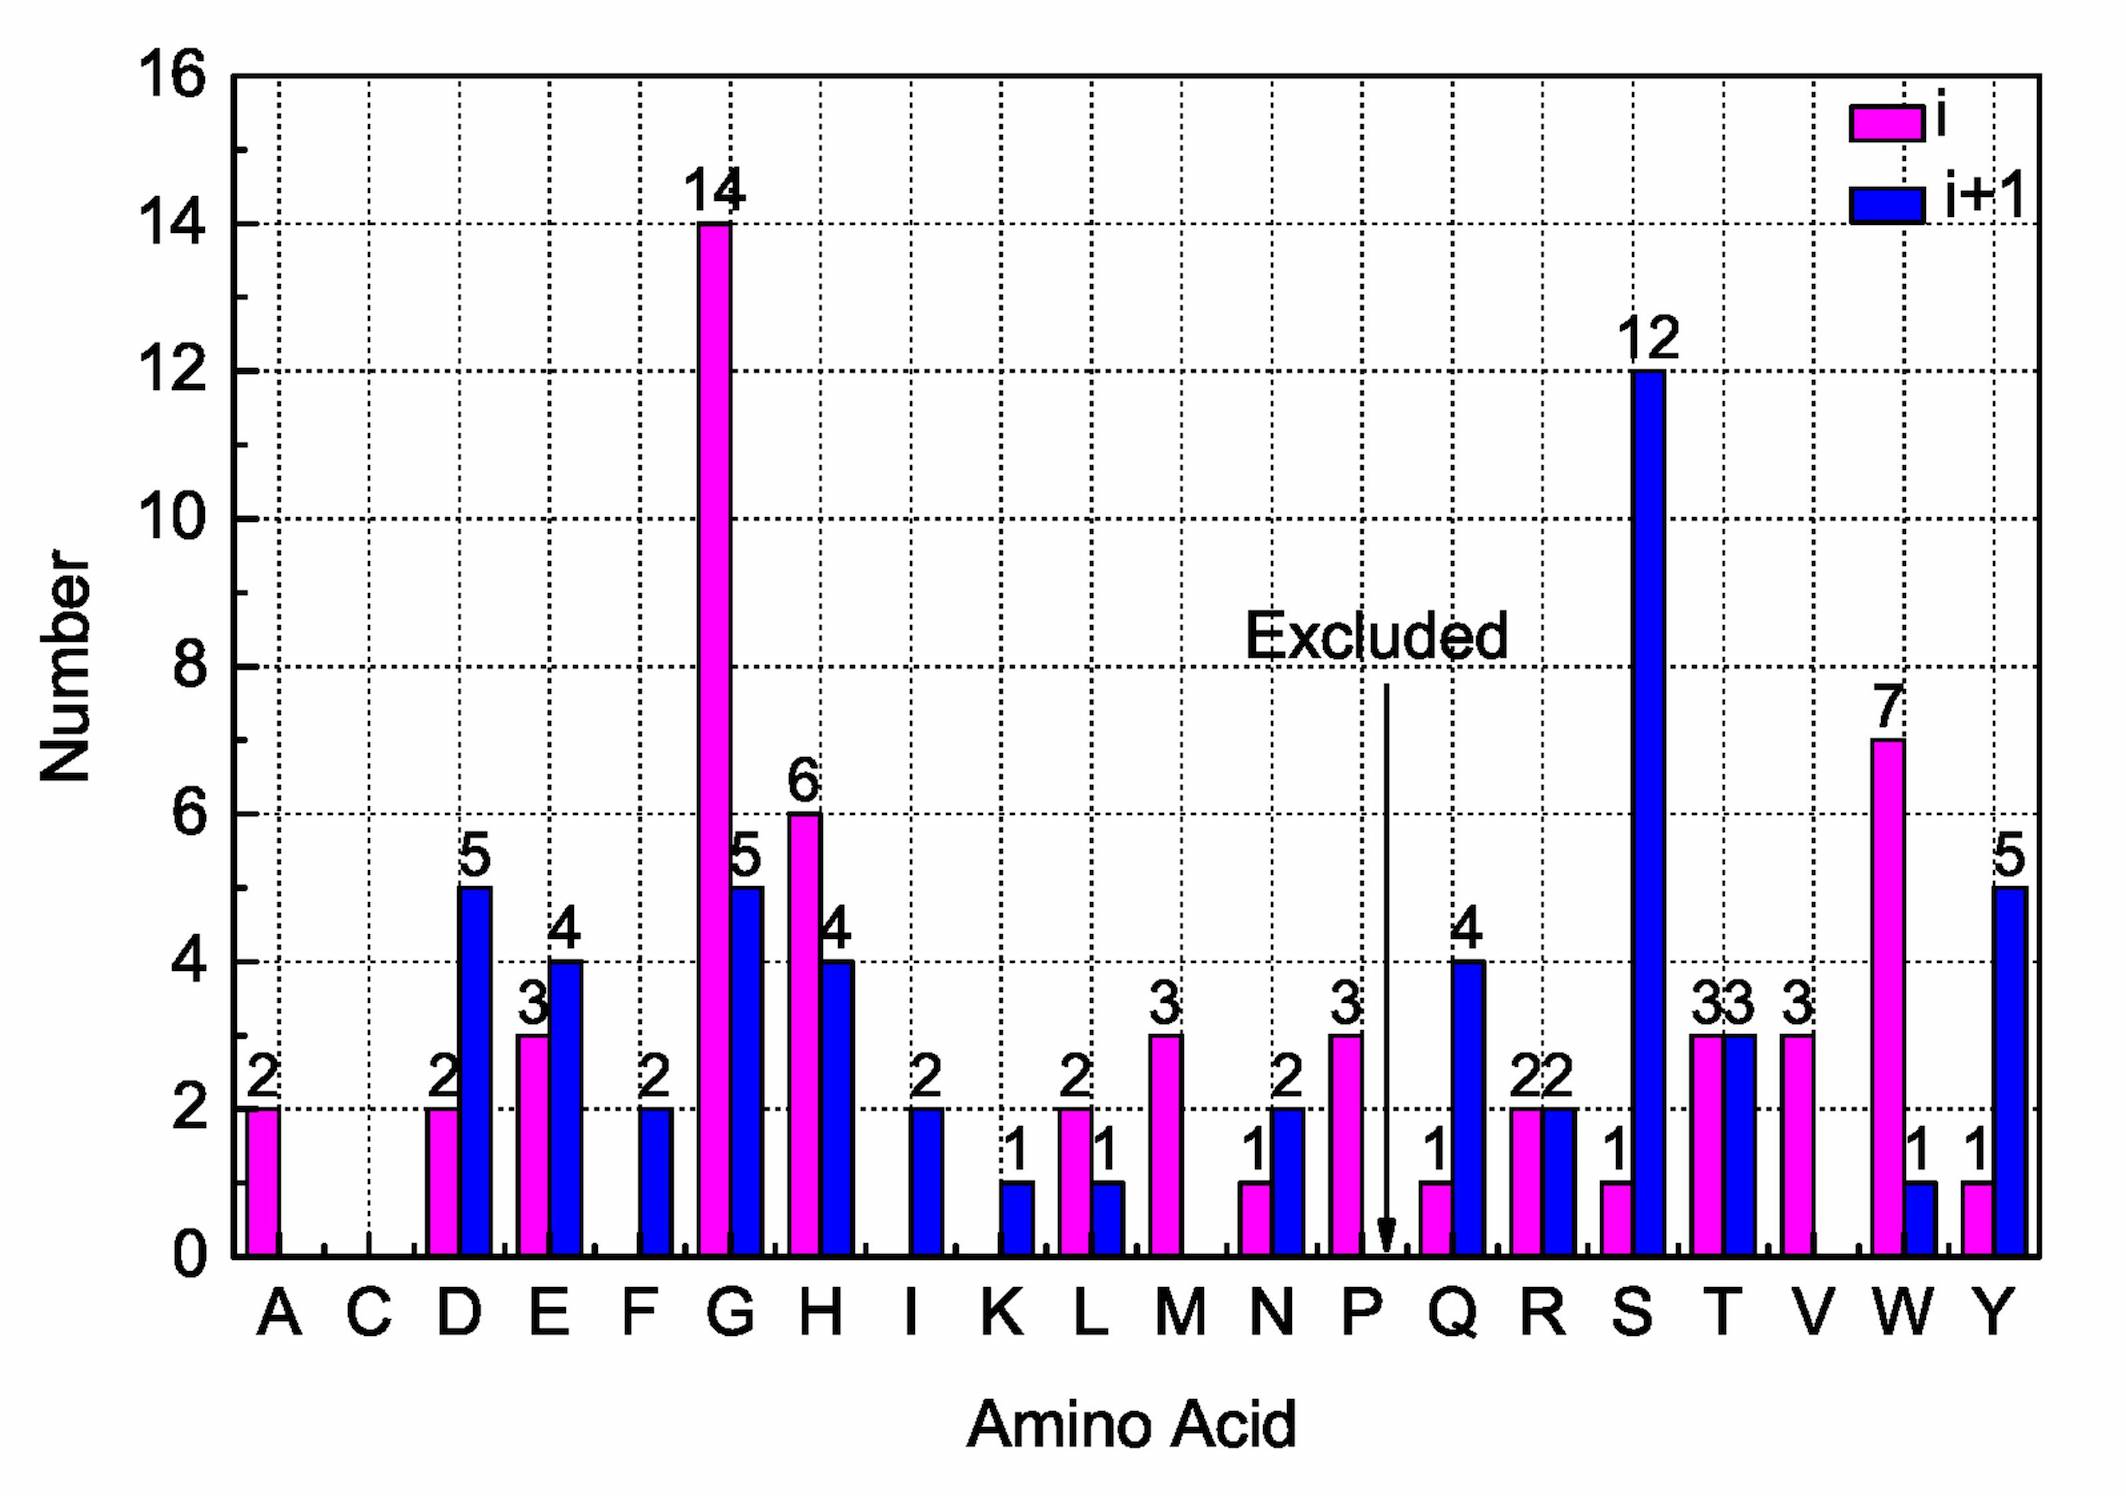
Figure 4 shows the amino acid distribution of cis X–Xnp peptide planes in our data set, separately at the and at the vertex; note that we do not exclude proline at the vertex, it appears three times in our data. We find all amino acids except Cys in these peptide planes, but the statistics is too limited for us to make a conclusion on Cys, so we look forward for an example. It is notable that Gly has very high propensity to the vertex, while Ser appears to be relatively common in the vertex. We also observe that unlike the case of the vertex where Pro is relatively abundant, examples of vertex cis-Pro are quite rare.
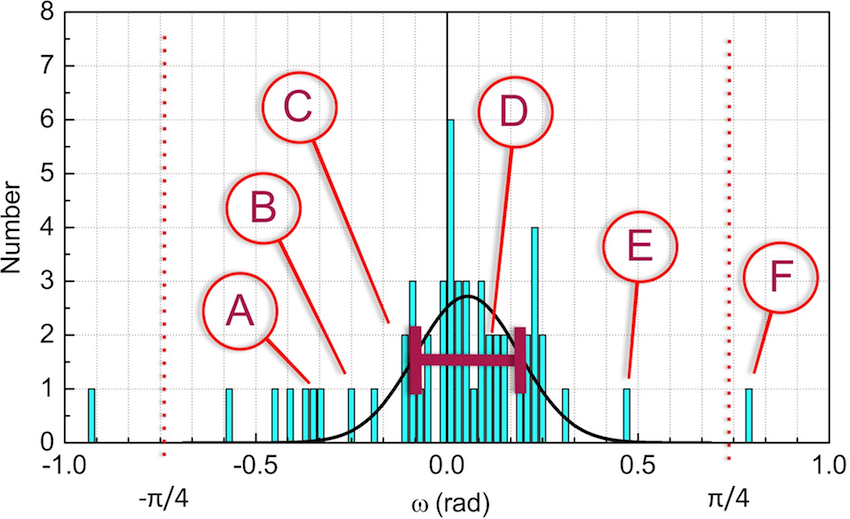
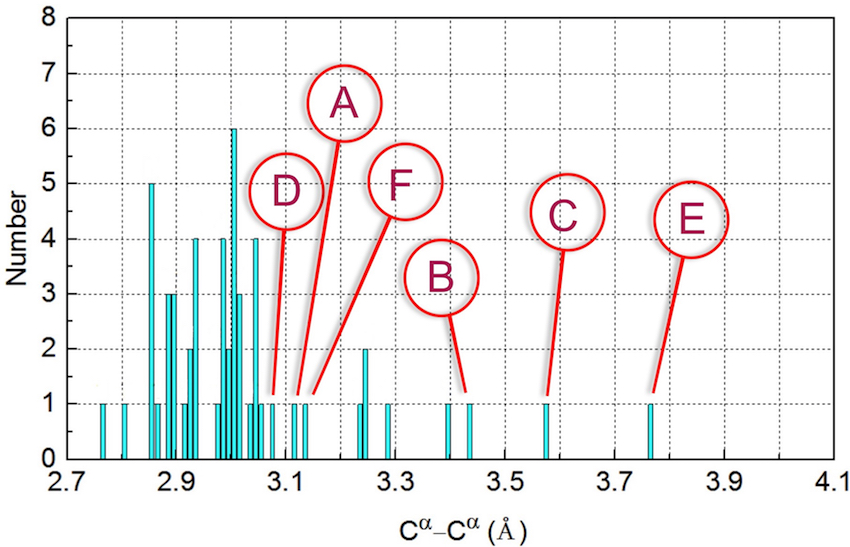
In Figure 5 (left panel) we show the distribution of the Ramachandran dihedral for values in our data set. The corresponding bond lengths are shown in the right panel. We observe that there is a gap in values of around . This justifies our choice of definition of cis-structures, for the present study: Only structures with are included in our statistics. See however, the analysis in Berkholz-2012 .
In Figures 5 we have also identified a number of entries, these are the examples that we shall follow in the sequel, to exemplify how the approach can be used to detect and identify atoms with apparently exceptional positions; we do not analyse the (biological) consequences. We note that each of the example we have chosen is in some sense exceptional: Either the value of the Ramachandran dihedral deviates from by more than one standard deviation, or as in the case of 2UU8A120-121 and 1NLSA121-122 (example B and D), the preceding peptide plane is also cis X–Xnp. The PDB codes of our examples are listed in Table 1.
| Label | PDB Entry |
| A | 2UU8A121-122 |
| B | 2UU8A120-121 |
| C | 1NLSA120-121 |
| D | 1NLSA121-122 |
| E | 1LUGA3-4 |
| F | 2GGCA191-192 |
(Extrinsic) Frenet frames and the Cα backbone
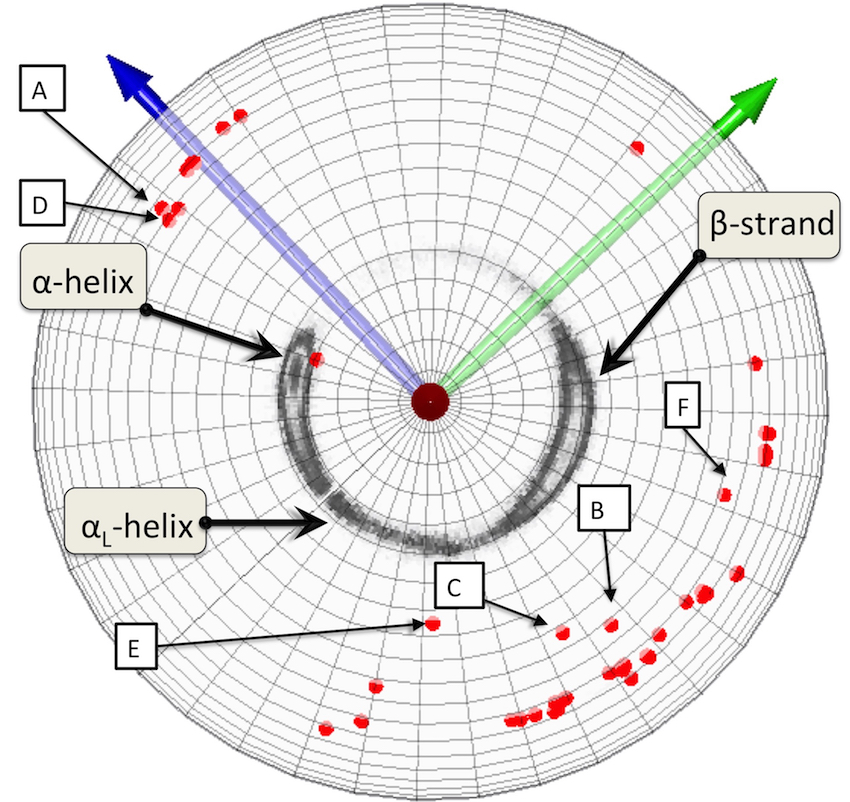
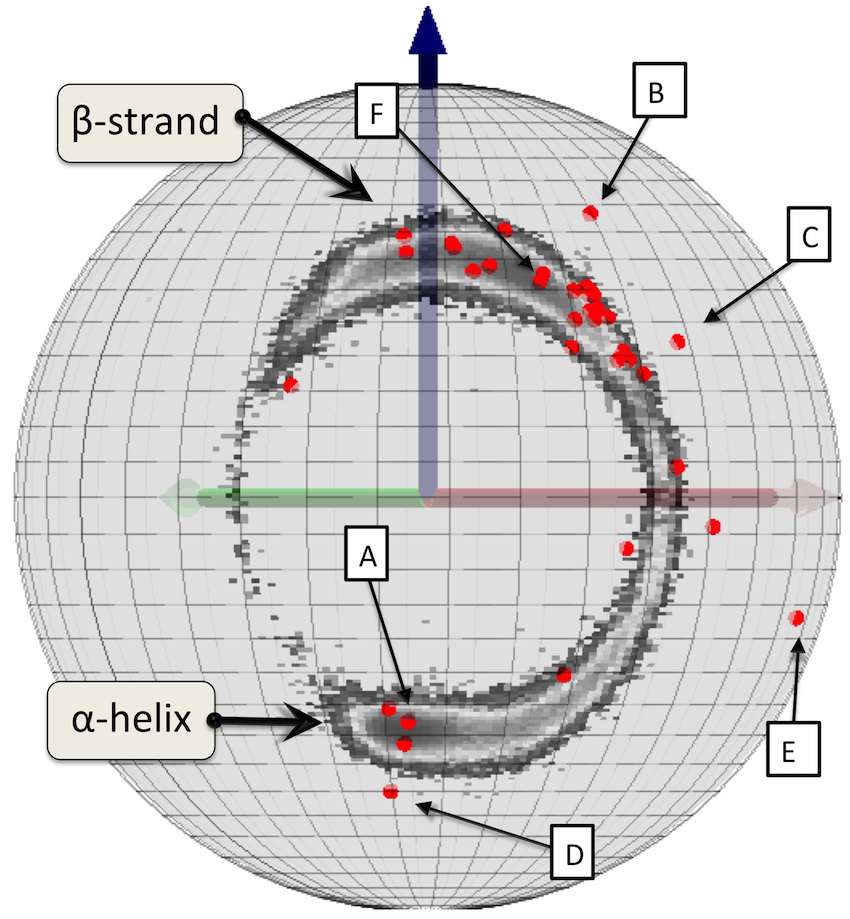
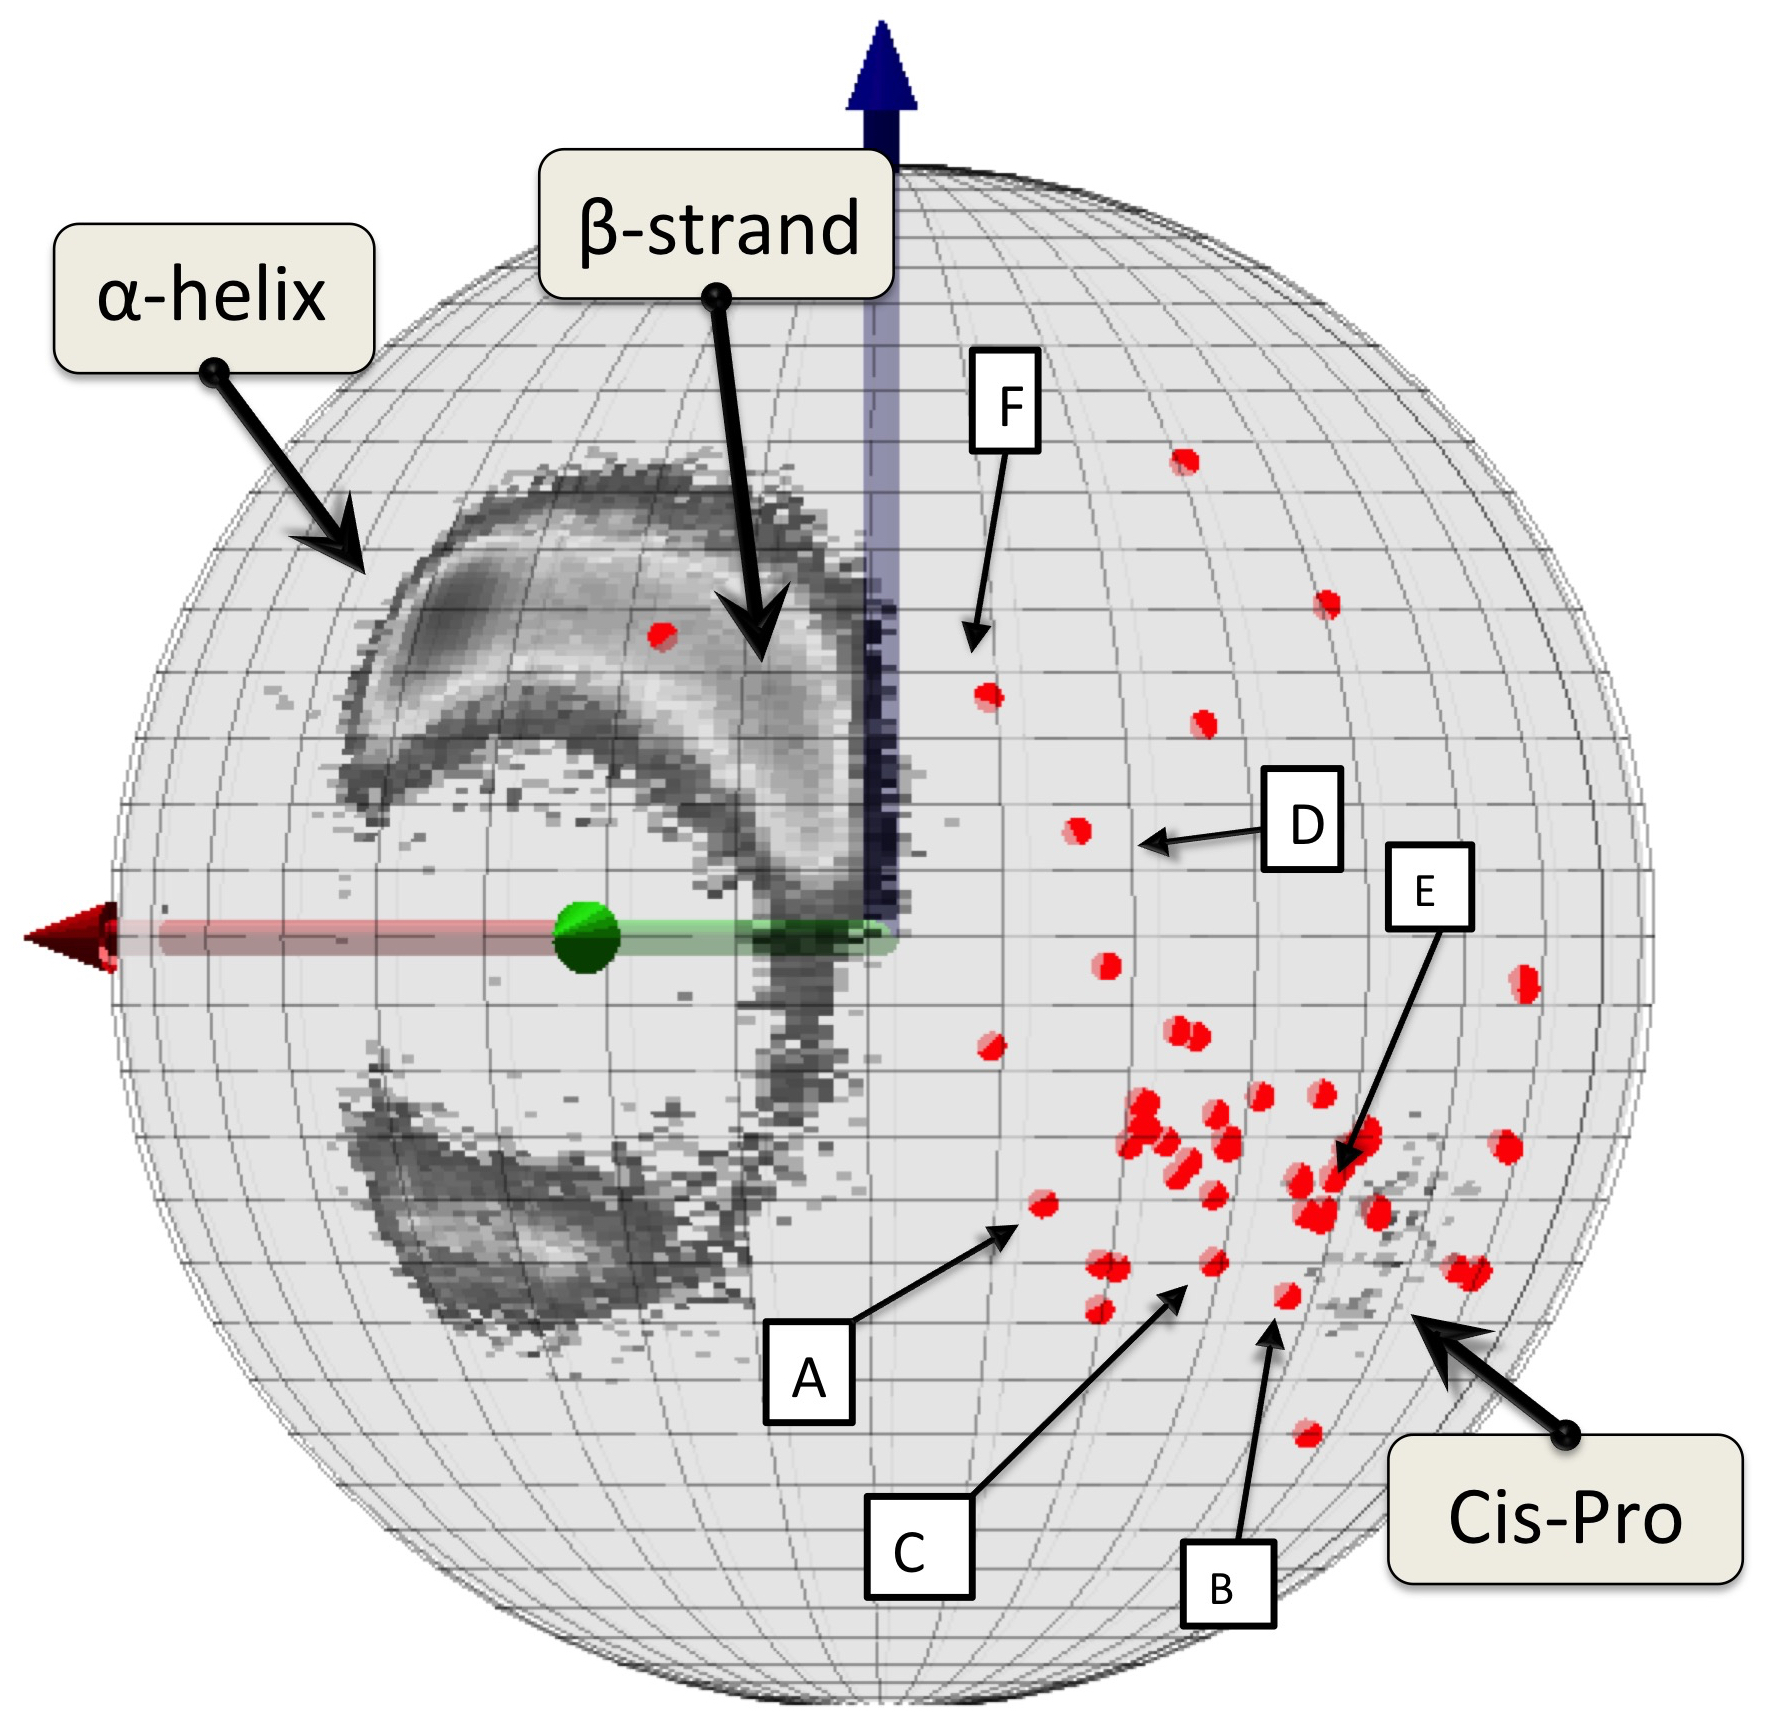
The Figures 6 show the distribution of the bond and torsion angles of the cis X–Xnp entries in our statistical set, on the Cα centered Frenet spheres; the angles are defined in equations (4), (5) and Figure 1. We use in Figures 6 the stereographic projection (6) (Figure 2). The notion of Frenet sphere and its generalisations in the context of protein visualisation, have been introduced and analysed in Hu-2011 ; Lundgren-2012 ; Lundgren-2012b . The center of the annulus in Figures 6 corresponds to , while points at infinite distance on the plane have . The torsion angle concurs with rotation around the center of the annulus, its values are marked in the left Figure 6. The grey background is the () distribution for all PDB structures with resolution below 1.0 Å. The majority of the structures are located in an annulus, between two circles. The outer boundary circle corresponds to . Structures with larger values of are sterically excluded, due to a clash between the neighboring Cα atoms. The inner boundary circle denotes . Structures with a smaller value of are sterically allowed but rare in PDB. The colored dots denote the individual () values of the cis X–Xnp peptide planes. The coloring is assigned according to the classification we obtain from Uniprot uniprot : Green is classified as helix, blue is classified as strand, and red is coil according to uniprot . The Figure 6 left denotes the () values that are assigned to the vertex, and the one on right denotes the () values that are assigned to the vertex of the peptide plane.
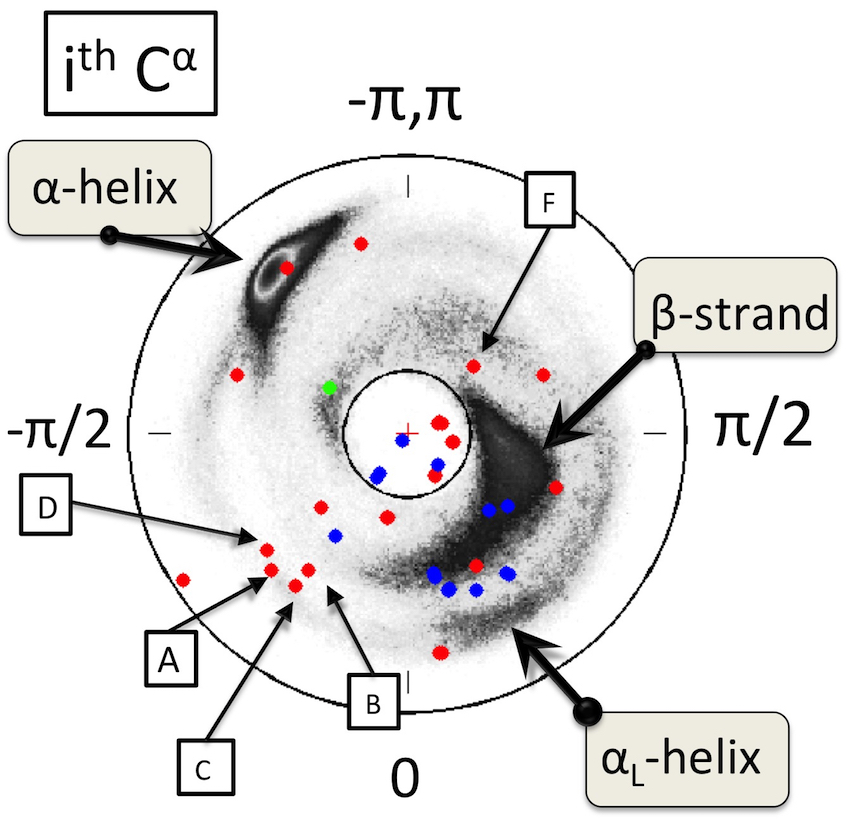
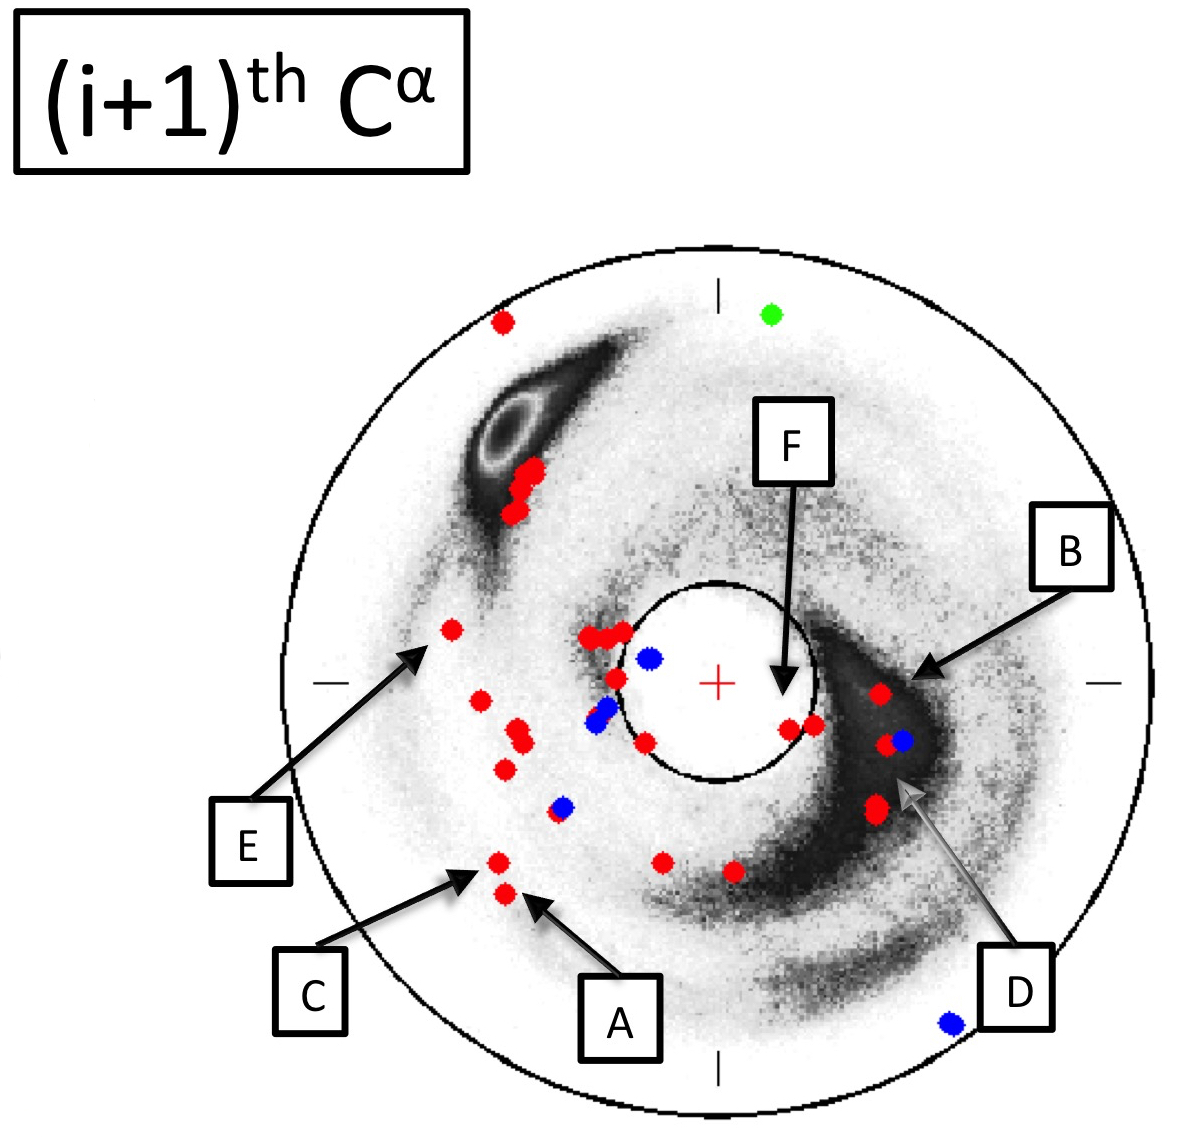
We observe that the () values of cis X–Xnp peptide planes are common in the region between which is otherwise rare in the PDB structures. Moreover, there is a clear propensity towards in particular at the Cα vertex while these bond angle values are quite rare among trans peptide planes. We note that according to (1), (4) a small value of implies geometrically that there is a tendency for the Cα backbone to straighten itself. We observe certain mismatch between the regular secondary structure assignment of a residue according to uniprot , and the actual placement of the dots in Figures 6.
Side chains and peptide planes in Frenet frames
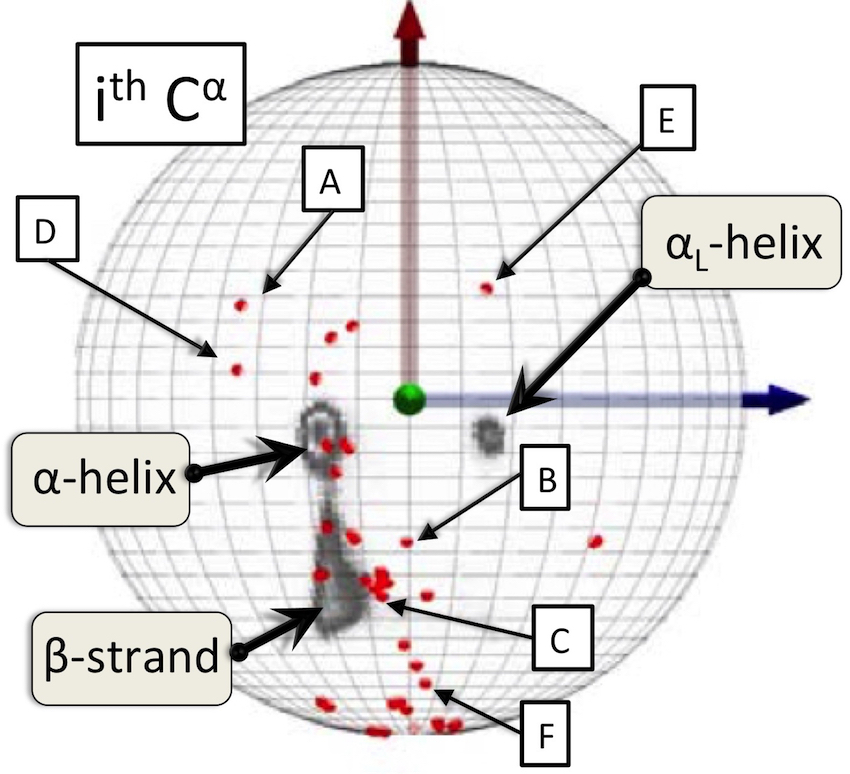
We proceed to visually investigate the individual Cβ, N and C atoms that are covalently bonded to a Cα atom at either the or the vertex of the peptide plane. The results for the cis X - Xnp peptide planes in our statistical background are displayed in Figures 7, 8 and 9; the grey background is the () distribution for all PDB structures with resolution below 1.0 Å. In each of these figures, we have denoted the six residues as examples, that we have previously identified in Figures 5, 6 and listed in Table 1.
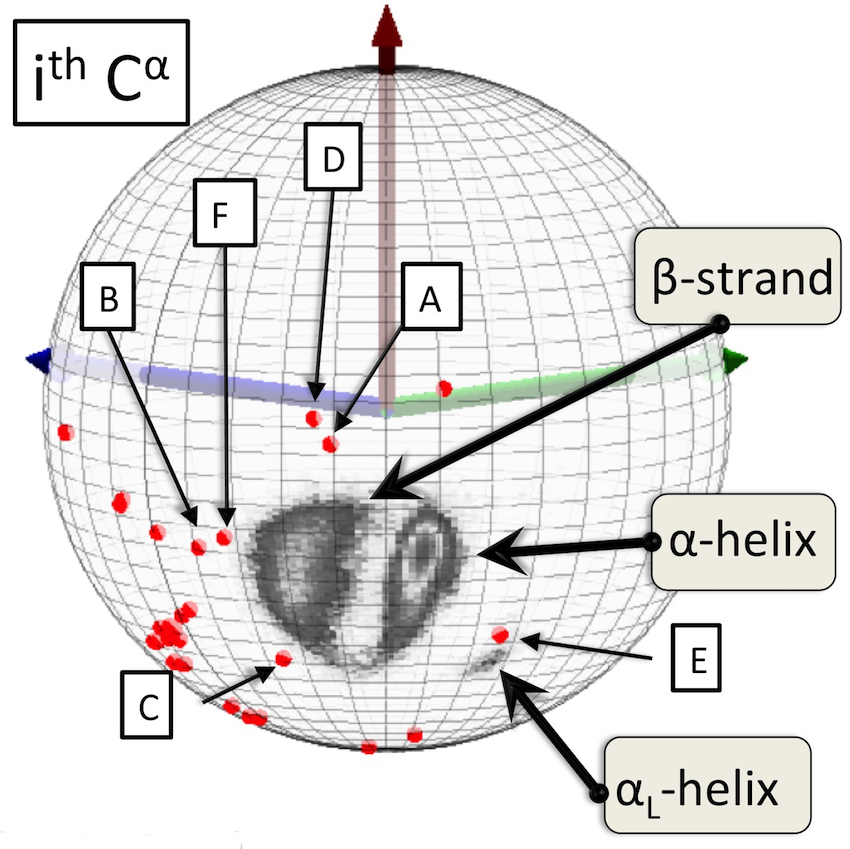
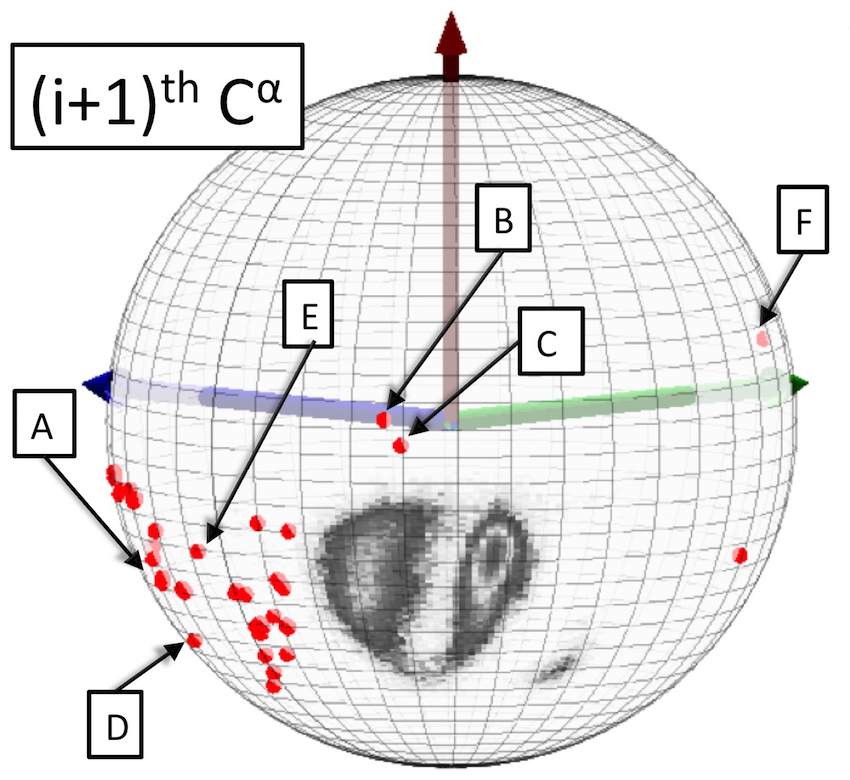
Figure 7 shows the distribution of the and Cβ atoms, on the Cα centered Frenet sphere. It is notable how the distributions are consistently shifted towards left, in the Figure. For comparison, in Figure 8 we show the same distributions in the case of cis Pro–X.
We observe the same overall pattern of shift, towards left in the Figure. We also observe that in the case of Cβ the dispersion in both cis X–Xnp and cis Pro–X distributions is higher, than in the case of the Cβ. Thus, the vertex of a cis peptide plane seems to be more strained.
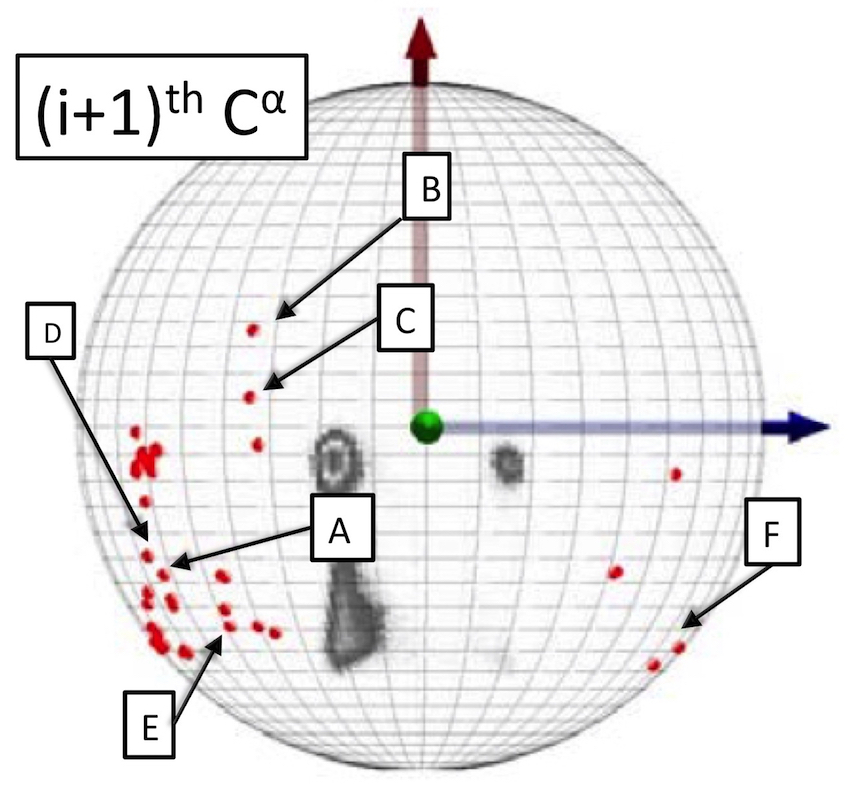
In Figure 9 we show the and N atoms, on the Cα centered Frenet sphere. We observe that there is a quite strong dispersion in both distributions, the overall pattern is clearly different than the background. Finally, in Figure 10 we have the C atoms, on the Cα centered Frenet sphere. The distribution of the C atoms does not show much deviation from the background, thus is not displayed. Whether this is due to refinement practices or actual observations, can not be determined on the basis of the existing PDB data.
(Intrinsic) CNO frames
The CNO frames are peptide plane specific, and as such intrinsic to the protein structure; as shown in Figure 3 the CNO coordinate system engages the C, N and O atoms of a single peptide plane. Accordingly we expect the CNO frames to provide us with intrinsic structural information, in particular on the residues that are adjacent to the peptide planes. As examples, we consider the C and C atoms at the two vertices together with the ensuing covalently bonded atoms C, C, Ni-1 and Ci+1, the two latter engage the neighboring peptide planes. We note that the Ni-1, C, C and Ci+1 are all engaged in the definition of the Ramachandran angles, that relate to the peptide plane. Thus no information can be gained of these atoms, in terms of Ramachandran angles.
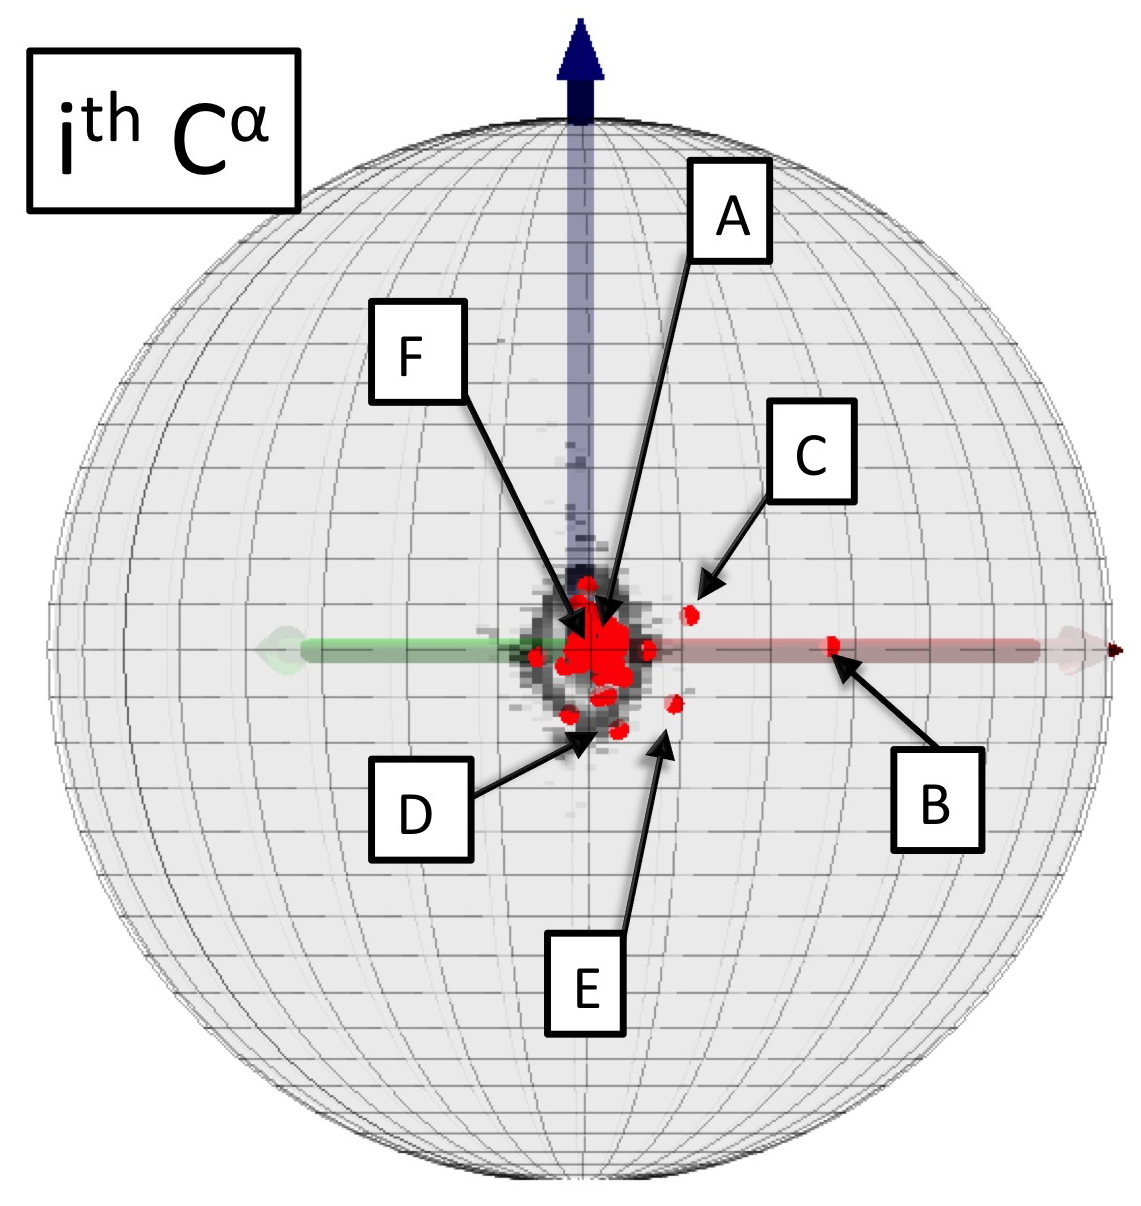
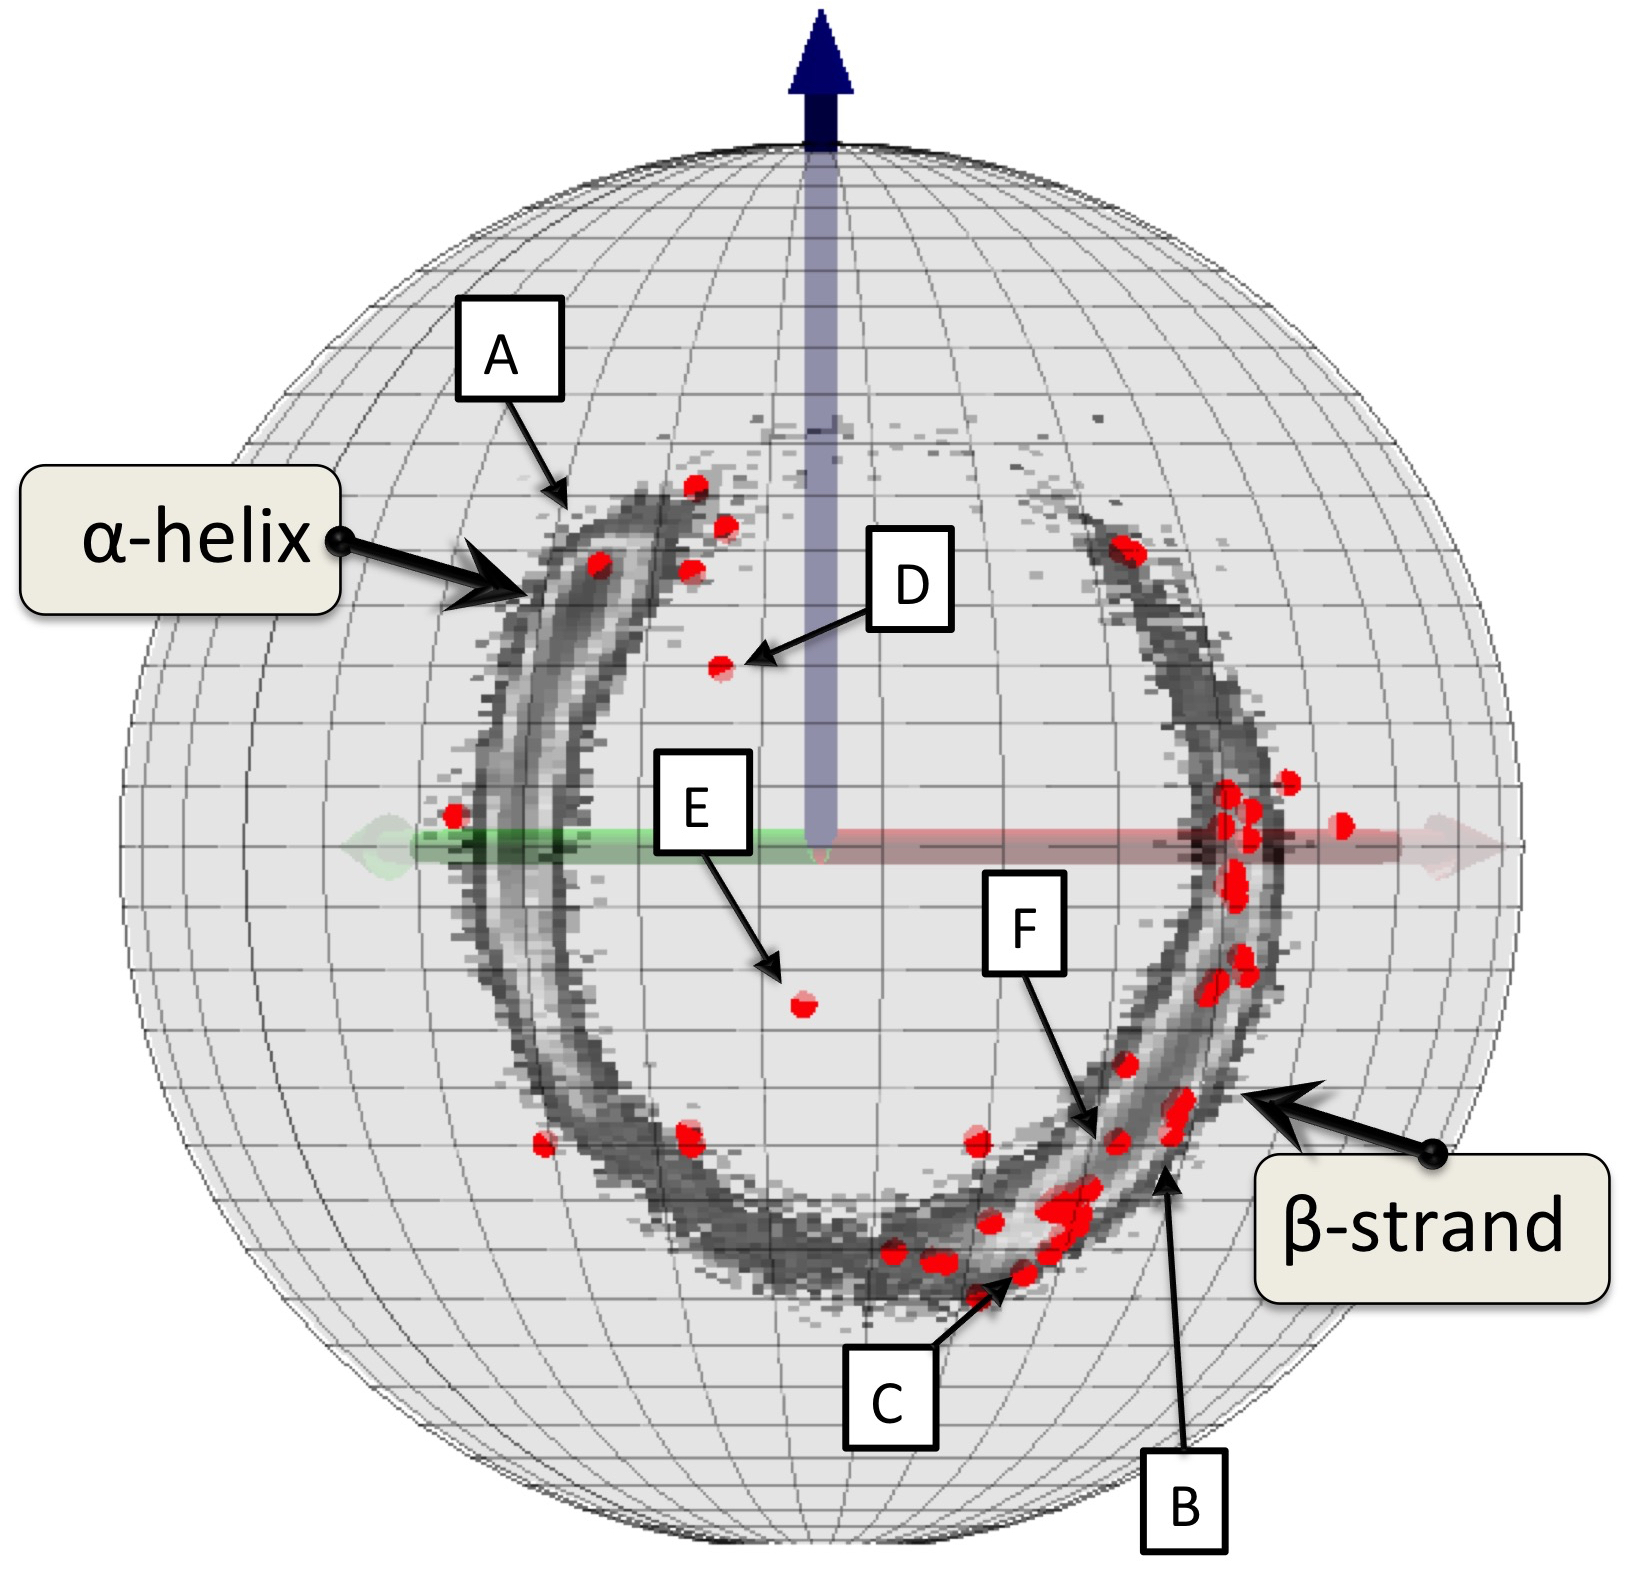
In Figure 11 we show the distributions of the Cα atoms at the vertices of the cis X–Xnp peptide plane, in the grey-scaled background of the 1.0 Å PDB data, as seen from the position of the C atom in the CNO frame. The distributions are highly localised and confirm the planar character of the peptide plane. The distribution of the cis X–Xnp structures is also centered in this region, but with a much larger dispersion.
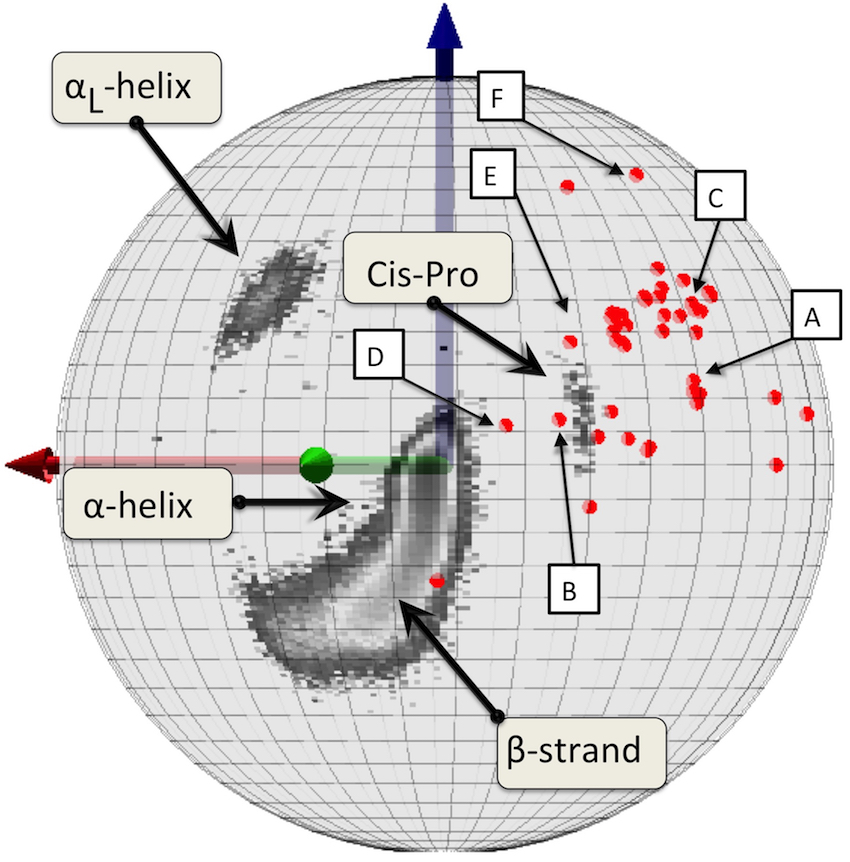
In Figure 12 we show the distributions of the Cβ atoms at the vertices of the cis X–Xnp peptide plane, in the grey-scaled background of the 1.0 Å PDB data, as seen from the position of the C atom in the CNO frame. It is notable that in the case of Cβ we observe a distinct localised cis–Pro region in the vertex, while in the case of Cα there is such a localised region at the vertex.
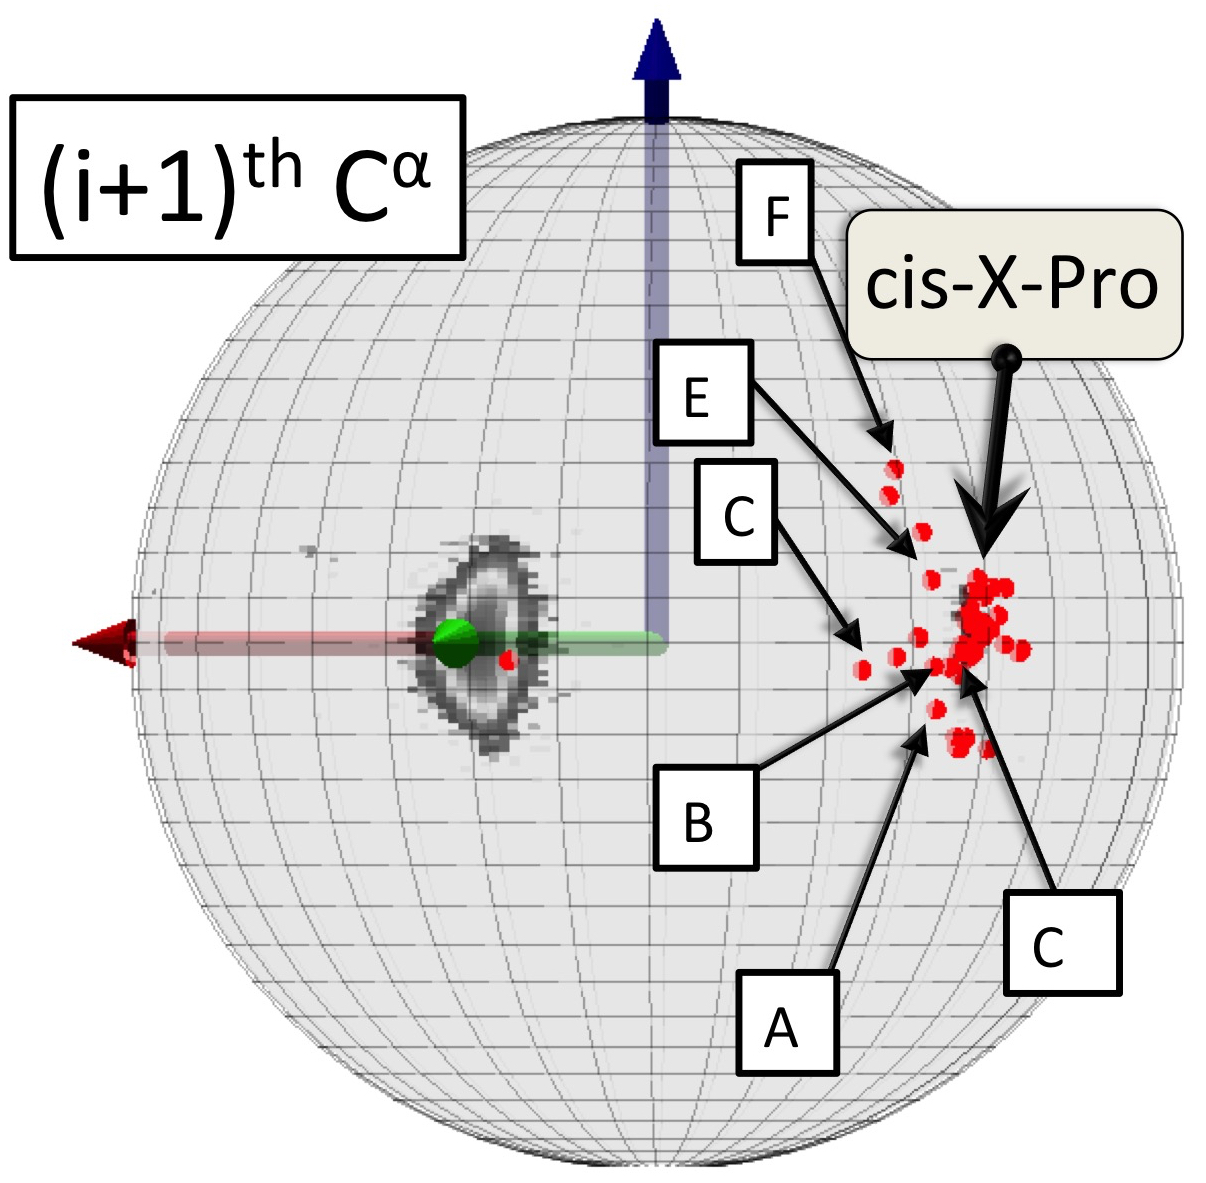
In Figure 13 we show the distributions of the N atoms in the peptide plane and the C atoms in the peptide plane, as seen from the position of the C atom in the CNO frame. We observe that most of the cis-Ni-1 atoms have positions that are in line with the PDB distribution, while there is a relatively large dispersion in the Ci+1 atoms of the cis X–Xnp peptide planes that is not observed in the case of cis X–Pro; we observe a distinct localised cis–Pro region in the ensuing Ci+1 distribution.
IV Comparison of CNO frames and Ramachandran Angles
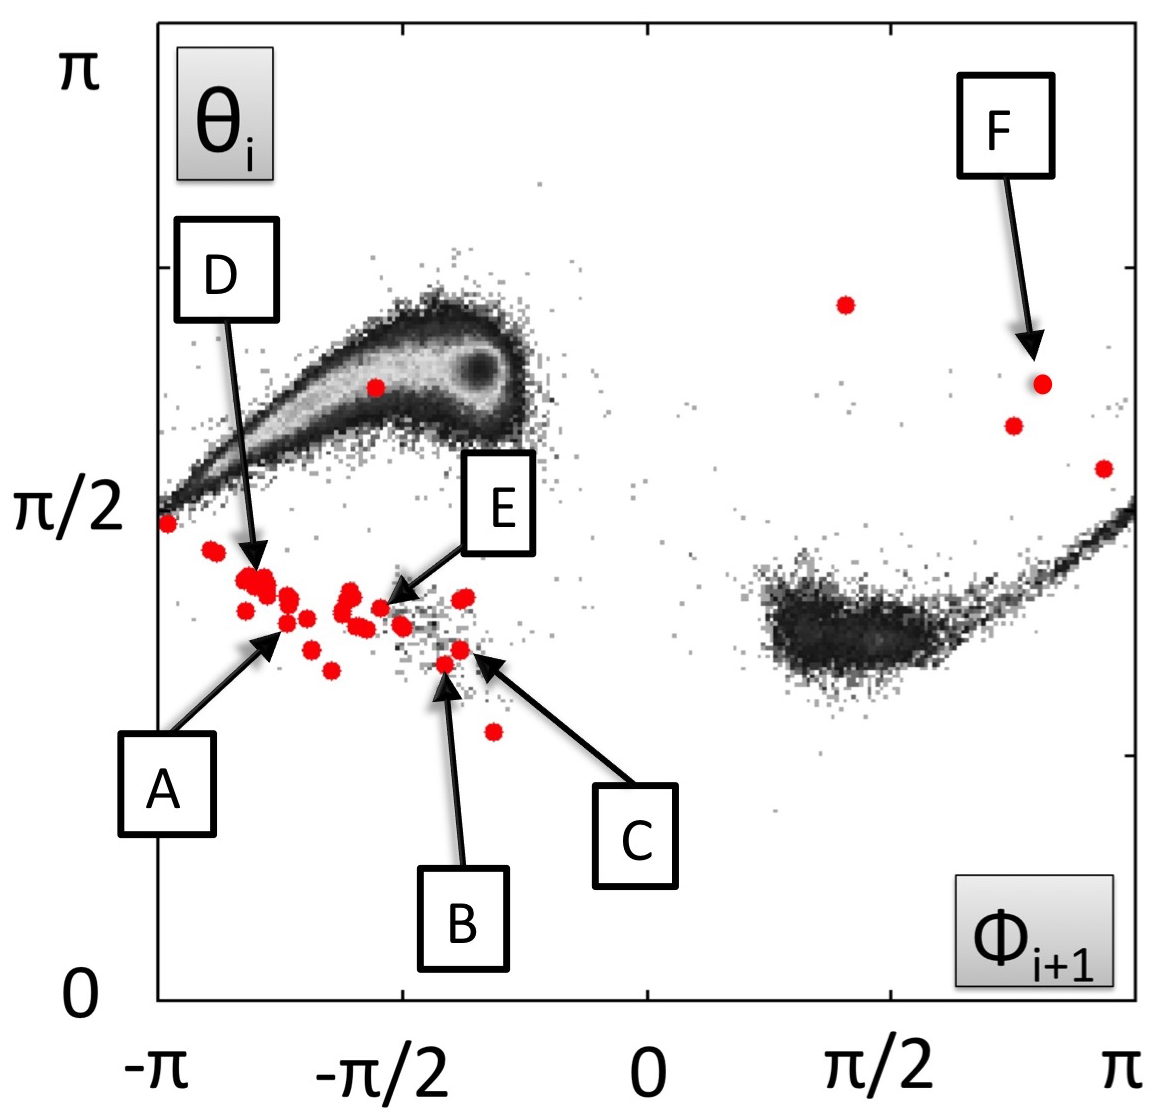
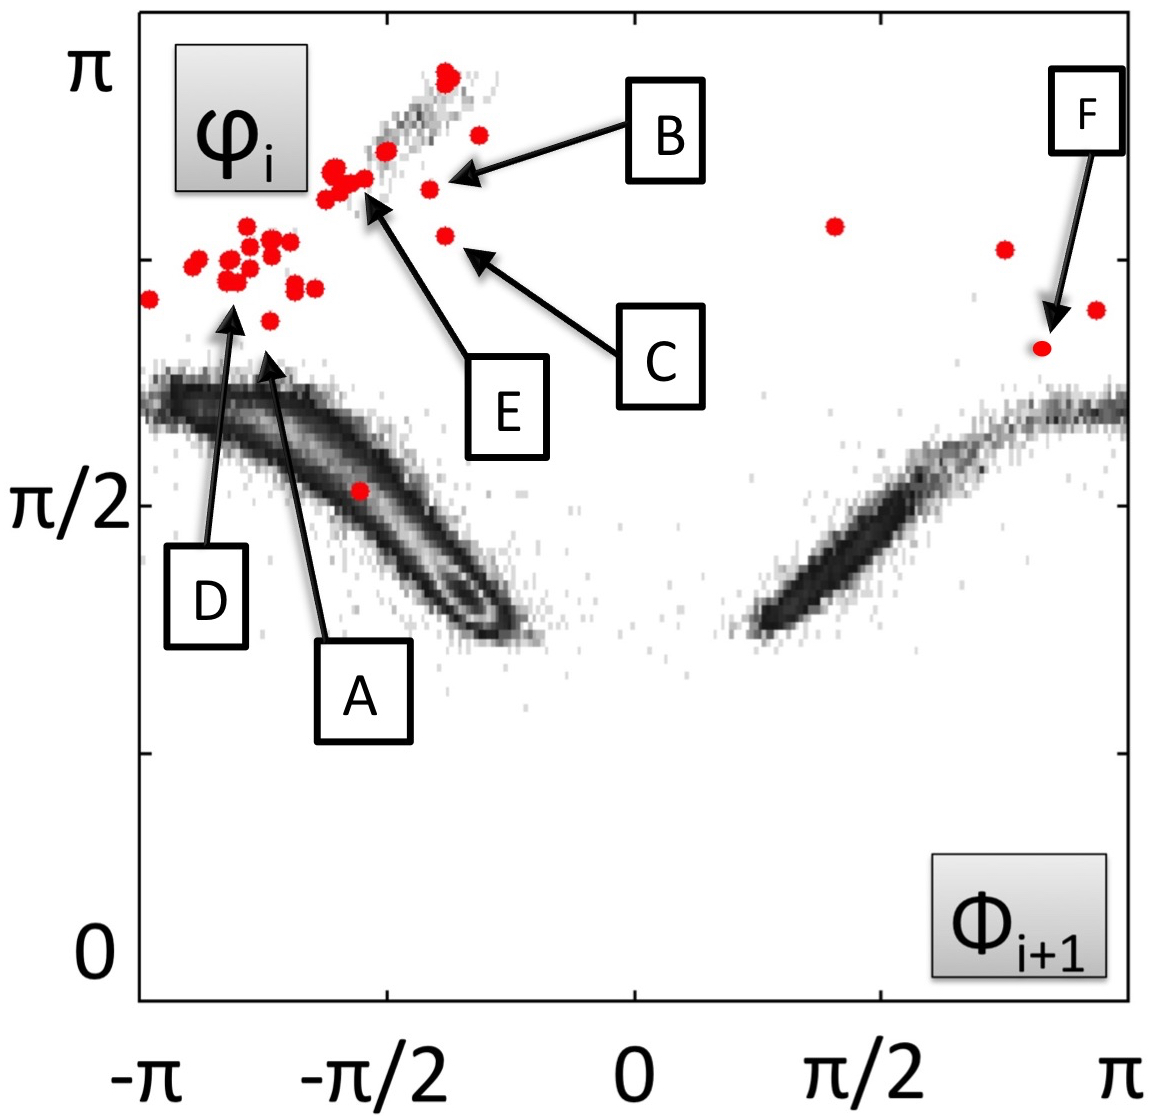
A comparison is due between the (intrinsic) angles () of the CNO frame, and the (extrinsic) Ramachandran angles (): We recall that is a dihedral rotation around the bond C – Ci, while is a dihedral rotation around the bond Ni – C. See Figure 3. Unlike () which are spherical latitude and longitude, the Ramachandran angles are toroidal coordinates and as such they do not directly determine the 3D positions of individual atoms: The topology of a torus is different from the topology of a sphere. To compare the information content in the Ramachandran angles to that in the spherical CNO coordinates, we evaluate as examples the () distributions of the Ni-1 atoms, with the goal to search for correlations with the Ramachandran angle . In the case of the Ramachandran angle, as an example we then search for correlations with the Ci+1 coordinate values of (). Note that the information content of the Ci+1 positions in terms of , and that of Ni-1 in terms of is corrupted by mutual interference.
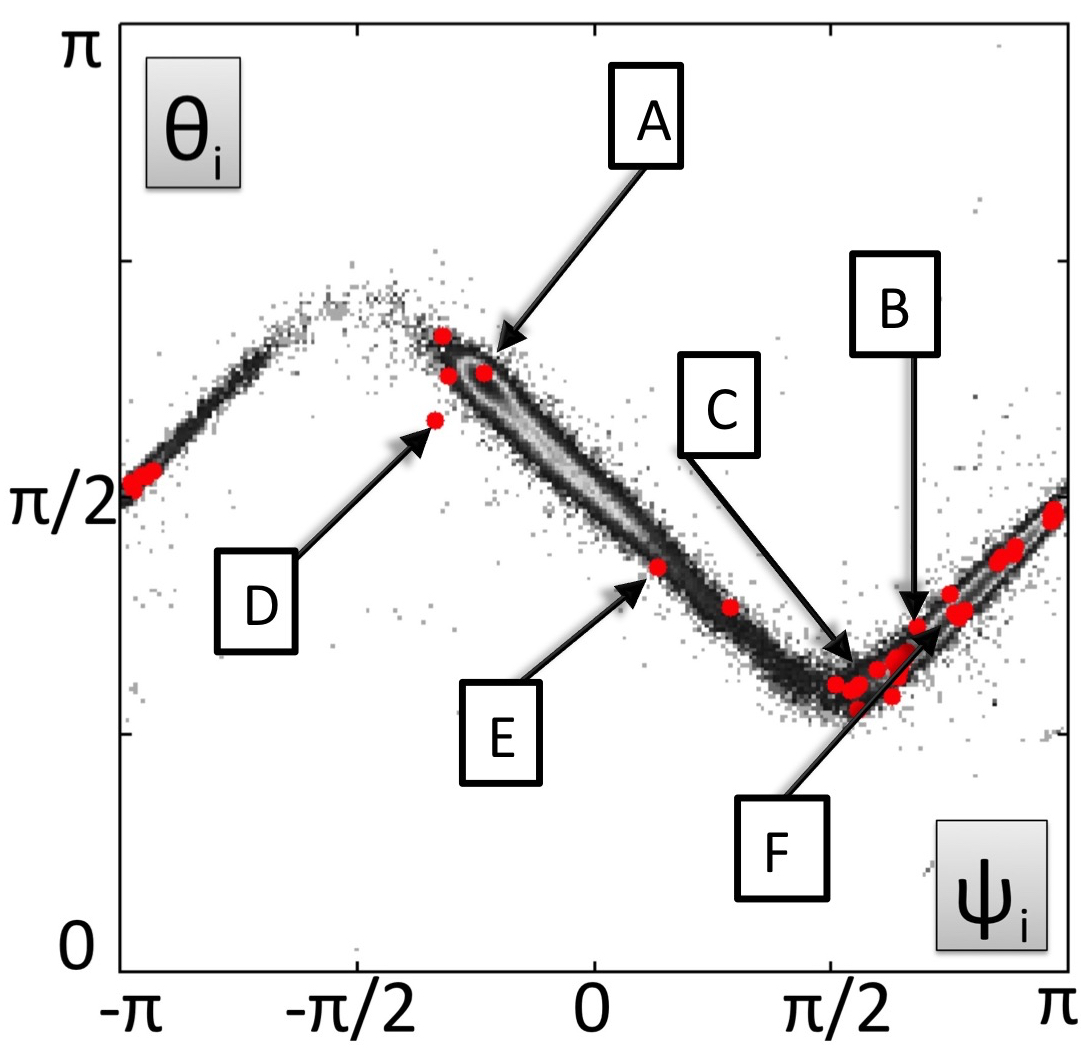
In Figure 14 we show the results for the Ramachandran angle . We observe a clear correlation between both CNO coordinates and the Ramachandran angle; since () are coordinates on the two-dimensional surface of the CNO-sphere, their combined information content is then more proliferate than that of the single Ramachandran angle; the information content in the CNO sphere is visually more detailed.
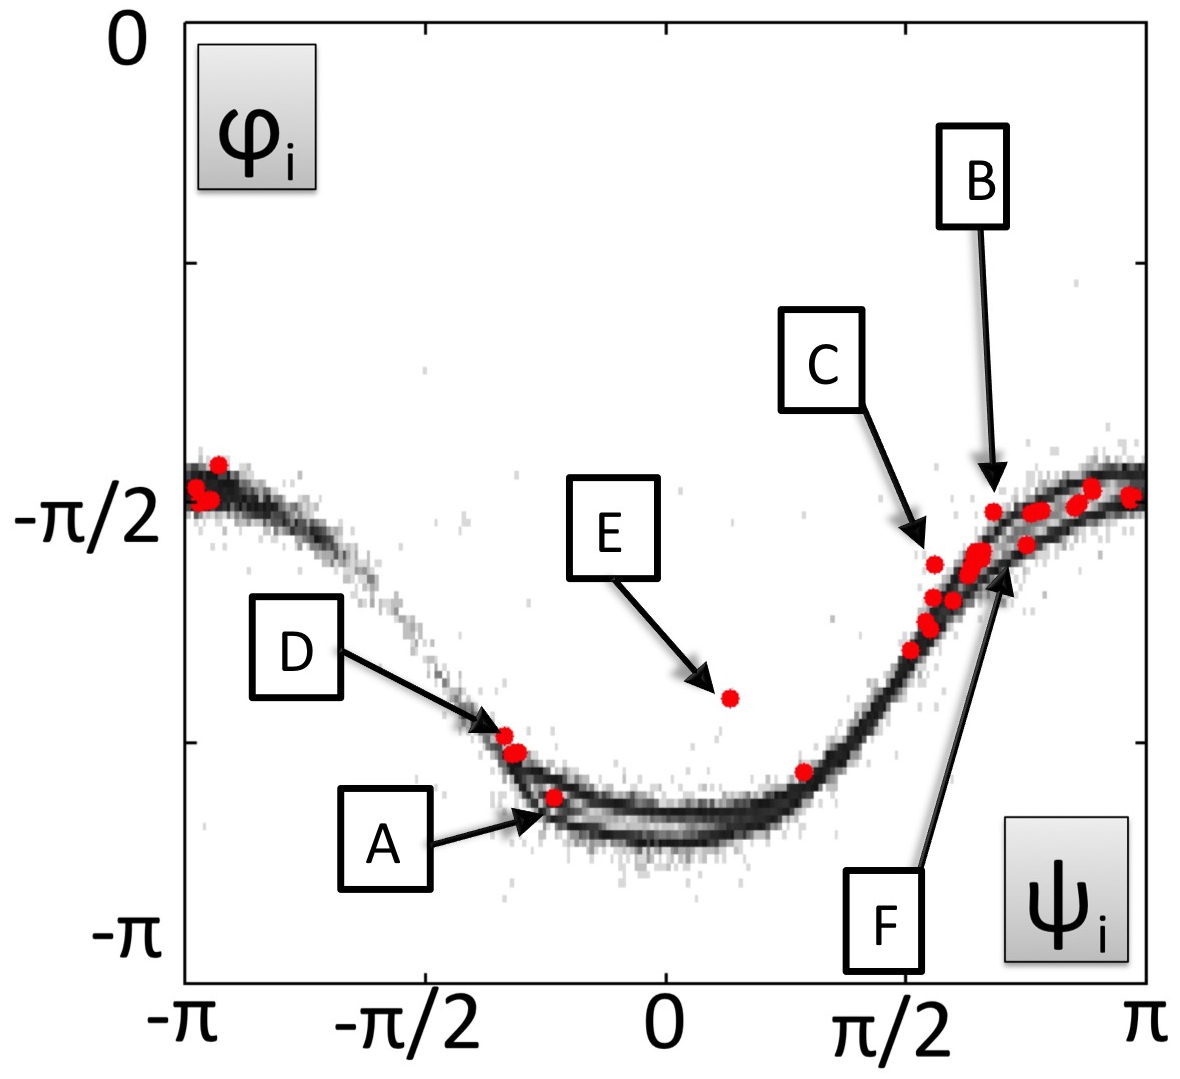
In Figure 15 we show the results for the Ramachandran angle . Also here we observe a strong correlation between both CNO coordinates and the Ramachandran angle.
In these figures we have again indicated the individual cis X–Xnp entries, distributed very much in line with the 1.0 Å background.
V Summary
We have investigated protein structure both in terms of extrinsic geometry-based coordinates and intrinsic, protein structure based coordinates. As an example of the former we have considered both Frenet frames and Ramachandran angles, and as an example of the latter we have introduced and analysed the CNO coordinate system. We propose to develop the CNO coordinates into a 3D virtual reality based structural analysis method of the protein structure. Indeed, our results suggest that intrinsic frames are a good complement to extrinsic frames, they can provide an alternative to the laboratory frames that are employed widely in 3D protein visualisation programs such as VMD, Jmol, PyMOL and others wiki-viewer . Moreover, a combination of extrinsic and intrinsic coordinates would yield versatile what-you-see-is-what-you-have type insight to the structural geometry of a protein. In particular, we have demonstrated how such a combination can be used to visually detect and analyse anomalously positioned atoms in crystallographic proteins; as an example we have scrutinised the cis peptide planes in high resolution PDB structures. The methodology we have outlined should be of value both in refining low-resolution data and in detecting structural anomalies with potentially important biomedical consequences.
Acknowledgements
This work was supported in part by Bulgarian Science Fund (Grant DNTS-CN-01/9/2014), Vetenskapsrådet (Sweden), Carl Trygger’s Stiftelse and Qian Ren Grant at Beijing Institute of Technology.
References
- (1) A.J. Hanson, Visualizing Quaternions (Morgan Kaufmann Elsevier, London, 2006)
- (2) J.B. Kuipers, Quaternions and Rotation Sequences: a Primer with Applications to Orbits, Aerospace, and Virtual Reality (Princeton University Press, Princeton 1999)
- (3) S.C. Lovell, J. Word, J.S. Richardson, D.C. Richardson, Proteins 40 389 (2000)
- (4) H. Schrauber, F. Eisenhaber, P. Argos J. Mol. Biol. 230 592 (1993)
- (5) R.L. Dunbrack Jr., M. Karplus, J. Mol. Biol. 230 543 (1993)
- (6) M.S. Shapovalov, R.L. Dunbrack Jr., Structure 19 844 (2011)
- (7) X. Peng, A. Chenani, S. Hu, Y. Zhou, A.J. Niemi, BMC Struct. Biol. 14:27 (2014)
- (8) https://en.wikipedia.org/wiki/Listofmolecular graphicssystems
- (9) S. Hayward, Protein Sci. 10 2219-2227 (2001)
- (10) D.S. Berkholz, C.M. Driggers, M.V. Shapovalov, M.R.L. Dunbrack, P.A. Karplus, Proc. Natl Acad. Sci. USA 109 449-453 (2012)
- (11) H.M. Berman, J. Westbrook, Z. Feng, G. Gilliland, T.N. Bhat, H. Weissig, I.N. Shindyalov, P.E. Bourne, Nucl. Acid Res. 28 235-242 (2000)
- (12) D.E. Stewart, A. Sarkar, J.E. Wampler, Journ. Mol. Biol. 214 253-260 (1990)
- (13) A. Jabs, M.S. Weiss, R. Hilgenfeld, J. Mol. Biol. 286 291-304 (1999)
- (14) C. Dugave, L. Demange, Chem. Rev. 103 2475-2532 (2003)
- (15) W.G. Touw, R.P. Joosten, G. Vriend, Acta Crystallogr. D71 1604- 614 (2015)
- (16) B.L. Stoddard, S. Pietrokovski, Nature Struct. Mol. Biol. 5 3-5 (1998)
- (17) S. Hu, M. Lundgren, A.J. Niemi, Phys. Rev. E83 061908 (2011)
- (18) M. Lundgren, A.J. Niemi, F. Sha, Phys. Rev. E85 061909 (2012)
- (19) M. Lundgren, A.J. Niemi, Phys. Rev. E86 021904 (2012)
- (20) http://www.uniprot.org/