Low-temperature heat transport of CuFe1-xGaxO2 ( 0–0.12) single crystals
Abstract
We report a study on the thermal conductivity of CuFe1-xGaxO2 ( 0–0.12) single crystals at temperatures down to 0.3 K and in magnetic fields up to 14 T. CuFeO2 is a well-known geometrically frustrated triangular lattice antiferromagnet and can be made to display multiferroicity either by applying magnetic field along the axis or by doping nonmagnetic impurities, accompanied with rich behaviors of magnetic phase transitions. The main experimental findings of this work are: (i) the thermal conductivities ( and ) show drastic anomalies at temperature- or field-induced magnetic transitions; (ii) the low- isotherms exhibit irreversibility in a broad region of magnetic fields; (iii) there are phonon scattering effect caused by magnetic fluctuations at very low temperatures. These results demonstrate strong spin-phonon coupling in this material and reveal the non-negligible magnetic fluctuations in the “ground state” of pure and Ga-doped samples.
pacs:
66.70.-f, 75.47.-m, 75.50.-yI INTRODUCTION
Multiferroicity, in which magnetism and ferroelectricity co-exist, is a result of strong coupling between magnetic and electric degrees of freedom in insulators and has attracted much attention because of its potential applications, since the electric (magnetic) properties of this kind of material can be modulated by an external magnetic (electric) field.Schmid ; Kimura1 ; Hur ; Lottermoser ; MF_Review The delafossite CuFeO2 is one of the candidates for such magnetic ferroelectrics.Kimura2 ; Arima
In CuFeO2, the Fe3+ ( 5/2, 0) ions are the only magnetic elements and they antiferromagnetically interact with each other, forming a good example of triangular lattice antiferromagnets (TLAs). Since the orbital singlet Fe3+ ions should have Heisenberg character, a non-collinear magnetic ground state with three spins aligned at 120∘ from each other in the base plane was naively expected.Muir ; Kawamura However, it was found that the low-temperature phase of CuFeO2 is likely a collinear four-sublattice (4SL) state, adopting an in-plane up-up-down-down order with spins pointing along or anti-parallel to the axis.Mitsuda1 ; Mitsuda2 ; Ye1 In zero magnetic field, the crystal structure of CuFeO2 undergoes lattice distortion from the hexagonal m space group at 14 K, and gradually changes into a monoclinic space group at 11 K.Terada1 ; Ye2 ; Terada2 In the meantime, the magnetic phase changes sequentially from the paramagnetic (PM) phase to the partially disordered incommensurate (PD or ICM) phase at with a sinusoidally amplitude-modulated magnetic structure and the moment along the axis, and then undergoes a first-order transition at to the 4SL state. Moreover, when a magnetic field is applied along the axis at , CuFeO2 displays multi-step magnetic phase transitions.Kimura2 ; Petrenko ; Terada3 ; Lummen In an external magnetic field ( 14 T), two first-order transitions occur and the field-induced spin structures have been described as follow:Kimura2 a collinear 4SL state for 0 7 T; a non-collinear incommensurate structure for 7 13 T with a proper helical magnetic order, in which ferroelectricity has been revealed, so this phase is called the ferroelectric incommensurate (FEIC) phase or multiferroic phase; and a collinear commensurate five-sublattice (5SL) state for 13 T, adopting an in-plane three-up two-down order with spin moments parallel (or anti-parallel) to the axis. The phase diagram can be summarized in Fig. 1(a).
Besides the magnetic-field-induced ferroelectricity, CuFeO2 can also achieve a spontaneous ferroelectric phase in zero field by nonmagnetic Al3+ or Ga3+ doping on Fe3+ site.Seki1 ; Terada4 Nonmagnetic doping causes lattice distortions and modification of magnetic interactions, which can realize the adjustment of magnetic ground state of CuFeO2 by varying impurity concentration. For example, for Ga-doped CuFe1-xGaxO2, the magnetic ground state can transform into the FEIC phase with 0.018 0.058.Terada5 In detail, in the case of 0.035, with lowering temperature, the magnetic phase changes from the PM phase to an oblique partially disordered (OPD or ICM2) phase at 14 K, in which the magnetic moments are sinusoidally modulated along the axis and oriented by from the axis.Seki2 ; Terada6 With further lowering the temperature, the magnetic phase undergoes a second transition to the PD (or ICM1) phase at K.Seki2 Below 8 K, the magnetic phase is long-range ordered into the FEIC state. In this phase, a -axis magnetic field can induce a magnetic transition to the collinear 5SL phase at 11 T.Seki2 With higher Ga-doping of 0.058 0.08, the long-range magnetic order can be destroyed; instead, the OPD phase is established at low temperatures.Terada5 ; Nakajima1 The phase diagram of CuFe1-xGaxO2 is summarized in Figs. 1(b) and 1(c).

As a basic physical property of solids, low-temperature heat transport has recently attracted much attention in the study of spin systems.Hess ; Sologubenko ; Zhao_SG ; Yamashita ; Sun_DTN ; Zhao_IPA ; Jeon First, it is a useful probe of many kinds of elementary excitations such as phonon, magnon, and spinon.Berman ; Ziman ; Ashcroft In the long-range-ordered magnetic insulators, magnons can act as heat carriers or phonon scatterers and thus affect the thermal conductivity.Sun_DTN ; Zhao_IPA ; Jeon Second, the thermal conductivity is sensitive to the spin-phonon coupling, which is usually strong in multifferroic materials.Wang_HMO ; Wang_TMO ; Zhao_GFO ; Zhao_DFO As a result, low-temperature heat transport is an effective method to probe magnetic field induced transitions. Although CuFeO2 has been studied for a long time, its heat transport properties have not been investigated. In this paper, we report a systematic study of the thermal conductivity () of CuFe1-xGaxO2 ( 0–0.12) single crystals at low temperatures down to 0.3 K and in magnetic fields up to 14 T. Various magnetic transitions are detected by either the temperature-dependence or the field-dependence data, which demonstrate strong spin-phonon coupling in this system. In addition, based on unexplored sub-Kelvin-temperature thermodynamic and transport measurements, strong magnetic fluctuations in the “ground state” were revealed.
II EXPERIMENTS
High-quality CuFe1-xGaxO2 ( 0, 0.035, 0.08, and 0.12) single crystals were grown by using a floating-zone technique.Song_Growth The chemical compositions were carefully determined by using X-ray fluorescence spectrometry (XRF) and inductively coupled plasma atomic-emission spectroscopy (ICP-AES).Song_Growth Using X-ray Laue photographs, the large pieces of crystals were cut into long-bar shaped samples with specific orientations. The thermal conductivity was measured at low temperatures down to 0.3 K and in magnetic fields up to 14 T by using a conventional steady-state technique.Sun_DTN ; Zhao_IPA ; Wang_HMO ; Wang_TMO ; Zhao_GFO ; Zhao_DFO The heat current was along either the axis () or the axis (), while the magnetic fields were applied along or perpendicular to the axis. The specific heat was measured by the relaxation method using a commercial physical property measurement system (PPMS, Quantum Design) equipped with a 3He insert.
III RESULTS AND DISCUSSION
III.1 Specific heat
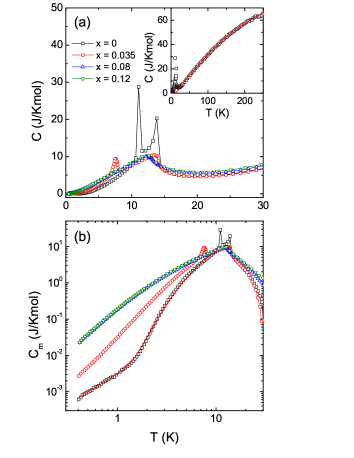
The literature contains quite limited specific-heat data of pure and Ga-doped CuFeO2.Petrenko ; Terada4 The earlier studies were carried out for 0 and 0.037 at temperatures down to 2 K. In this work, we measured the specific heat of CuFe1-xGaxO2 ( 0, 0.035, 0.08, and 0.12) single crystals at temperatures down to 0.4 K, as shown in Fig. 2, and revealed some new information. For the 0 sample, the data exhibit two sharp peaks at 14 K and 11 K, which correspond to the second-order transition from the PM to PD (ICM) phase and the first-order transition from the PD (ICM) to 4SL phase, respectively.Kimura2 ; Terada1 ; Ye2 ; Terada2 For the 0.035 sample, the lower- peak moves to 7.5 K () and becomes weaker. The first transition is still located at 14 K () but the peak is weak and very broad. These behaviors are consistent with earlier results.Petrenko ; Terada4 In the case of 0.08 and 0.12, there is only a broad peak at 12.5 K, which should be related to the magnetic transition from the PM to OPD phase.Terada5 It is known that the specific-heat data can provide useful information about magnetic excitations. To analyze the data, we need to determine the phononic specific heat of CuFeO2. For this purpose, the specific heat of the 0 sample was measured at temperatures up to 250 K, as shown in the inset to Fig. 2(a); such measurement has not been reported in the earlier works. Initially, a fitting to the high- (above ) data was tried by using the standard Debye formula,Tari
| (1) |
where , is the universal gas constant, and is the total number of acoustic phonon branches. In a simplified case, 12 (considering 4 atoms in each unit formula). However, we found that the simple Debye formula cannot simulate the data accurately. One known reason for the deviations of high- specific heat from the Debye model is the contribution of optical phonons at high temperature, which can be described by the Einstein model.Svoboda ; Hemberger ; Janiceka Actually, the phonon spectrum of CuFeO2 should consist of 3 acoustic branches and 9 optical branches and inspired by this we found that the high- data can be fitted by the formula
| (2) |
Here, the first term is the contribution of 3 acoustic phonon branches using the Debye model ( 3), while the second and third terms are the contributions from the optical branches using the Einstein model ( 5 and 4). The other parameters are the Debye temperature, 180 K, and two Einstein temperatures, 440 K and 1025 K. Note that the Debye temperature corresponds to a mean sound velocity of 2150 m/s, which is close to the experimental value determined by ultrasonic measurements.Quirion1
The fitting results are taken as the lattice specific heat of CuFe1-xGaxO2. We can get the low- magnetic specific heat by subtracting the phononic term from the raw data, as shown in Fig. 2(b). Surprisingly, the curve of the 0 sample displays a distinct anomaly at 1.5 K. It should be pointed out that the magnetic properties of CuFeO2 at such low temperatures have not been explored in the earlier works. Nevertheless, it is not likely a magnetic transition happening at 1.5 K since only the slope of changes. The sudden change of the temperature dependence of specific heat can be directly related to a change of magnetic excitations. Actually, the data below of this sample are well fitted by
| (3) |
with parameters 3.08 10-3 J/Kmol, 2.13 J/K2mol. 1.67, and 10.6 K. This means that there are two kinds of magnetic excitations. The exponential term is due to gapped spectrum of the Ising-like 4SL phase.Terada7 ; Terada8 ; Ye1 ; Nakajima2 ; Nakajima3 In this regard, the neutron scattering has detected an anisotropy gap of 0.9 meV, which is very close to the 10.6 K gap from the present specific heat data.Ye1 This contribution to the specific heat quickly decays at . The power-law behavior dominates at very low temperatures. It is usually described as the character of quantum spin fluctuations in strongly frustrated system.Ramirez ; Nakatsuji ; Okamoto ; Terada9 Therefore, the specific-heat data at sub-Kelvin tempratures demonstrate that the ground state of CuFeO2 is actually a co-existence of 4SL phase and spin fluctuated or short-range phase.
With Ga doping, the gapped excitation term disappears, indicating the weakness of the spin anisotropy. This is also consistent with the phase diagram’s indication that upon doping the ground state is changed from the gapped 4SL to un-gapped FEIC. On the other hand, the power-law term is strongly enhanced with increasing to 0.08, and there are comparably strong magnetic excitations in the OPD phase of the 0.08 and 0.12 samples. This indicates that the spin fluctuations of this material can be significantly enhanced when the low- phase is changed to OPD by doping with non-magnetic impurities.
III.2 in zero field
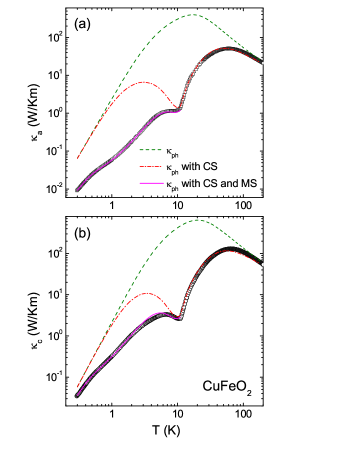
Figure 3 shows the -axis and -axis thermal conductivities of the = 0 samples in zero field. It is notable that the high- thermal conductivities actually exhibit rather large magnitudes compared with some other insulators. CuFeO2 is known to be a good semiconductor,Rogers ; Dordor so it is necessary to estimate the electronic thermal conductivity by using the Wiedemann-Franz law , where is the electrical resistivity and (= 2.44 10-8 W/K2) is the Lorenz number. Based on the resistivity data reported in the literature,Rogers along the and axes at 200 K can be estimated to be 3.7 10-4 and 1.9 10-8 W/Km, respectively. Apparently, the electronic contribution to is negligibly small and the thermal conductivity is mainly the phononic term. With lowering temperature, however, the curves do not exhibit the large phonon peak, usually located at 10–20 K.Berman Instead, they show broad peaks centering at 60 K, below which the temperature dependence of are rather complicated. As shown in Fig. 3, both and show a slight change of slope at (= 14 K) and a remarkable dip-like feature at (= 11 K). Ultrasonic measurement has revealed previously that the phonon velocity shows a sharp minimum (with 5–6% change) at and a step increase (1–2%) at , respectively.Quirion1 ; Quirion2 Apparently, the changes of velocity are not big enough to be responsible for the anomalies of . The dip of should be caused by a drastic phonon scattering by the critical magnetic fluctuations at the magnetic transition, which significantly changes the phonon mean free path.Wu_CHC ; Zhao_CVO In order to identify this kind of phonon scattering mechanism, we tried to fit the experimental data based on the classical Debye model. The phonon thermal conductivity can be expressed asBerman ; Ziman
| (4) |
in which , is the phonon frequency, is the Debye temperature, and is the mean lifetime or scattering rate of phonons. The phonon relaxation is usually defined as
| (5) |
where the four terms represent the phonon scattering by the grain boundary, scattering by the point defects, the phonon-phonon Umklapp scattering, and the magnetic scattering associated with magnetic phase transitions, respectively. is the Debye temperature, the phonon velocity is calculated from the equation , where is the number density of atoms, is the sample width, and , and are adjustable parameters. According to Kawasaki’s phenomenological theory,Kawasaki ; Rivers the critical phonon scattering at the magnetic transition can be expressed as
| (6) |
for , and
| (7) |
for . Here, , , , and are free parameters. is the critical temperature corresponding to the dip position of the curve, which is selected as 11 K. Using these formulas, the data are fitted. The best fitted results, shown as the dash-dot lines in Fig. 3, were chosen to reproduce the high- behavior of () with parameters 3.73 10-43 (3.35 10-43) m, 1.6 10-43 (7.5 10-44) s3, 3.1 10-31 (1.05 10-31) s2K-1, 2.8 (2.8), 2.5 10-4 (1.2 10-4) s2K, 4.8 1013 (4.7 1013) s-1, 1.4 (1.4), 2.5 (2.6). However, using these formulas, the calculated for are still much larger than the experimental data. Apparently, there should be another phonon-scattering term at temperatures below . It is worth mentioning that both the - and -axis for display a change of slope at about 1 K. This anomaly has some correspondence to the data. As discussed above, there seem to be two kinds of magnetic excitations in magnetic ordering phase, that is, the exponential magnetic excitations (magnons) co-exist with power-law magnetic excitations at sub-Kelvin temperatures. In this regard, there is no theoretical formula to describe the phonon scattering rate by these low-energy magnetic excitations. We propose a phenomenological expression of this additional magnetic scattering term at by taking into account the magnetic specific heat,
| (8) |
where , , are free parameters, and and are the power-law and exponential terms of the magnetic specific heat, respectively. The low- () data can be fitted quite well with parameters 2.15 1016 (2.1 1015) J-1K3/2s-3/2mol, 5.72 1014 (7.0 1013) J-1K3/2s-3/2mol, and 1.31 (1.25). The parameters and in are clearly larger than those in , which indicates a stronger phonon scattering by magnetic excitations for the in-plane phonon transport. Finally, if we switch off all the magnetic scattering by setting and to zero, the calculated show a typical behavior of phonon transport with very large phonon peaks, as shown by the dashed lines in Fig. 3.
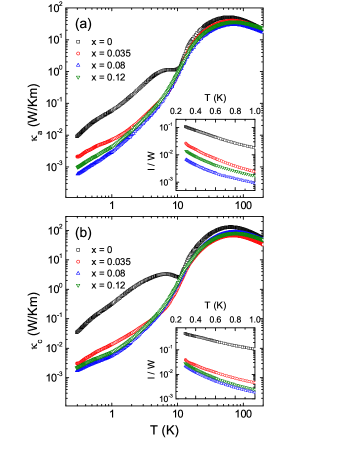
Figure 4 shows the -axis and -axis thermal conductivities of Ga-doped CuFe1-xGaxO2 ( 0.035, 0.08, and 0.12) in comparison with those of = 0 samples. Although the doping dependence of and are somewhat different at very low temperatures, the main phenomenon is that the low- thermal conductivities are strongly suppressed in the Ga-doped samples. It should be noted that the impurity doping deteriorates the periodicity of the crystal lattice and therefore shortens the mean free path of phonons, giving rise to the reduction of . This is the main reason that at high temperatures (above several Kelvins) are weakened with Ga doping. However, this kind of phonon scattering caused by impurities is negligible at very low temperatures because the wave-length of the phonon is long enough to far exceed the size of local lattice distortion.Berman Considering the specific-heat data upon Ga doping, the clear suppression of low- in Ga-doped samples should be caused by a stronger phonon scattering by the magnetic fluctuation. The phonon thermal conductivity can be expressed as a kinetic formula , in which is the low- phononic specific heat, is the averaged sound velocity and is nearly -independent at low temperatures, and is the mean free path of phonons.Berman With decreasing temperature, the microscopic scatterings of phonons are gradually smeared out and the increases continuously until it reaches the averaged sample width , where is the cross-section area of sample.Berman This boundary scattering limit of phonons can be achieved only at very low temperatures and the -dependence of is the same as the law of the specific heat Berman ; Ziman . In the present case, none of the low- curves shows the dependence at sub-Kelvin temperatures, which means that the microscopic scattering is not negligible even at temperatures as low as 0.3 K. With the value (= 180 K) from the specific-heat data, the phonon mean free path can be calculated assuming that is purely phononic.Zhao_NCO ; Sun_Comment The insets to Fig. 4 show the temperature dependence of the ratio . It is found that for 0 sample, the ratios at the lowest temperature are only about 0.1 and 0.5 for and , respectively. This indicates that there must be a magnetic scattering effect at low temperatures, which is more significant for phonons transporting along the axis. In Ga-doped samples, it is clear that the magnetic scattering effect is so strongly enhanced that the phonon mean free paths are much smaller than those of the undoped samples. This is compatible with the low- specific heat data that demonstrate much stronger magnetic fluctuations in Ga-doped samples.
It is also notable that of undoped samples are rather anisotropic, that is, are several times smaller than at low temperatures. It seems that the magnetic excitations are anisotropic and scatter the in-plane phonons more effectively. With Ga doping, the anisotropy of becomes much weaker, which means that the magnetic anisotropy is weakened by the nonmagnetic impurities.
III.3 and of CuFeO2
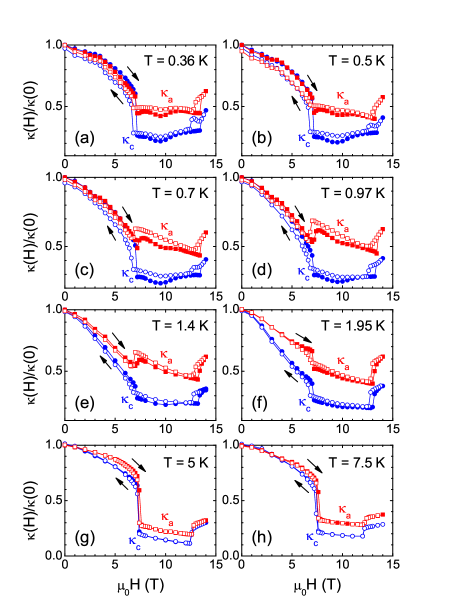
Figure 5 shows the magnetic-field dependence of and at low temperatures with zero-field cooling (ZFC). The magnetic field was applied along the axis. Both and isotherms display complex field dependence: gradually decreases with increasing field with a sudden change at 7 T, then becomes weakly field dependent until another drastic change at 13 T, followed by an increase with further increasing field. The two characteristic fields are corresponding to the magnetic transitions from the 4SL to FEIC phase and from the FEIC to 5SL phase, respectively.Kimura2 Below , the Fe3+ spins are mainly ordered in the gapped 4SL phase,Fishman ; Haraldsen and the decrease of is probably caused by the enhancement of the magnon scattering of phonons with increasing field. This explanation is reasonable since the anisotropy gap decreases linearly with increasing field and magnetic excitations are gradually populated. Between and , the Fe3+ spins are mainly ordered in the gapless FEIC phase,Fishman ; Haraldsen and there are large amount of magnons that can strongly scatter phonons, so is strongly suppressed and has weak field dependence. Above , the Fe3+ spins form the gapped 5SL phase, which has weak magnon excitations because of the re-opening of a gap.Fishman ; Haraldsen As a result, the phonon scattering is weakened and recovers at .
A notable feature of the isotherms is the difference in the sudden changes of at . At 1.95 K and 0.5 K, both and show a similar step-like decrease, which corresponds well to the jump changes of magnetostriction at critical fields.Kimura2 In the intermediate region of 0.7 K 1.4 K, however, still shows a step-like decrease while shows a step-like increase at . Apparently, the main difference between and is likely due to the competing roles of magnons in heat transport, that is, acting as heat carries or phonon scatterers. Because of the strong anisotropy,Terada7 ; Terada8 ; Ye1 the magnons are more dispersive along the plane. Therefore, the strong suppression of at is due to the phonon scattering by the weak dispersive magnons in the direction, while for , the in-plane magnons can not only scatter phonons but also transport heat.
Another phenomenon is that the isotherms show clear irreversibility in the whole field range at 1.95 K and the hysteresis becomes more pronounced with decreasing temperature. Note that the magnetization of CuFeO2 also exhibits irreversibility in the whole field range.Kimura2 The difference between the and is that the former can be irreversible at rather high temperatures while the latter are irreversible only at 2 K. It is intriguing that with decreasing field is smaller than with increasing field at , but the relative magnitudes become reverse at . In the measurement of magnetostriction with field up to 14 T, hysteretic behavior has been observed,Kimura2 which is consistent with the data. The change of magnetostriction could affect the phonon spectrum and may lead to the irreversible behavior of . However, previous reserch found that the magnetostriction either parallel to or perpendicular to the axis shows monotonic changes with increasing field,Kimura2 which is very different from the changes of .
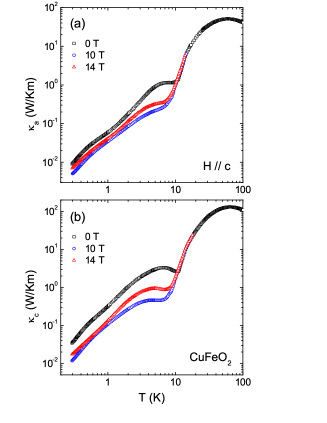
Figure 6 shows the temperature dependence of and with . Applying 10 T and 14 T fields along the axis, the dip feature at becomes wider and moves to lower temperatures, which is consistent with the vs shown in Fig. 1(a). At the same time, at are significantly suppressed in 10 T field but recover somewhat in 14 T field, as also indicated by the data. The 1 K anomaly in the zero-field curves is almost unchanged in 10 and 14 T fields. We discussed above that the 1 K anomaly is likely related to the power-law magnetic excitations at very low temperatures. The consistency of the anomaly indicates that these kinds of magnetic excitations are not significantly changed when a magnetic field drives the phase transition from the 4SL to the FEIC and then to the 5SL.
III.4 and of the 0.035 samples
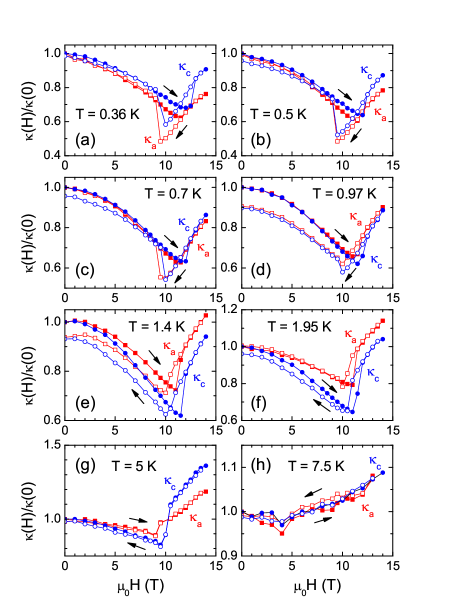
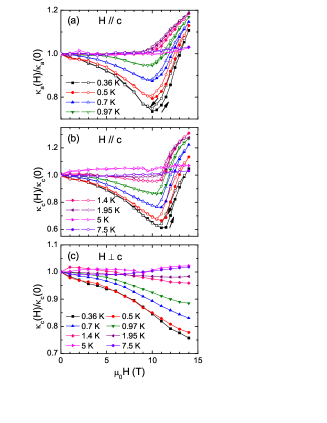
Figure 7 shows the magnetic-field dependence of and at low temperatures for the 0.035 single crystals with , which are significantly different from that of the undoped CuFeO2. First, the changes of with field become weaker than those of the undoped samples. Second, the field dependence is rather similar between the and , indicating that the Ga doping weakens the magnetic anisotropy. This similarity is consistent with what the data indicate. Third, the field dependence of is qualitatively different from those of the undoped samples, due to the differences in the ground states and field-induced transitions.
The main feature of the isotherms at 5 K is a minimum located at the magnetic transition from the FEIC to 5SL phase (the transition field is defined as ). In addition, there is also a large irreversibility of the curves in the 0.035 samples. This irreversibility mainly appears near the magnetic transition for both and , which results in obviously different minimum-fields for field sweeping up and down. It is notable that most of the curves show a step-like increase at for an increasing field, but show a step-like decrease at for decreasing field, particularly at very low temperatures. This behavior is qualitatively different from that of the 0 samples at the transition from the FEIC to 5SL phase (see Fig. 4). As a result, near the transition from the FEIC to 5SL phase, the curves of the 0 samples show a rectangular single-loop while those of the 0.035 samples show a butterfly-shaped loop.
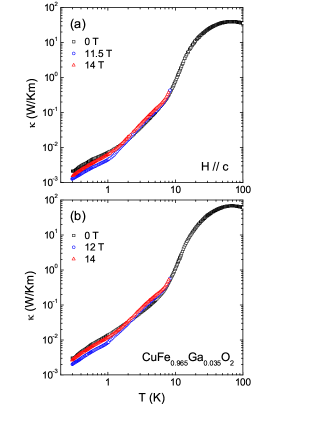
Figure 8 shows the temperature dependence of and with . Applying 11.5 (or 12) T and 14 T fields along the axis, the shoulder feature at does not change much, which is consistent with the phase diagram shown in Fig. 1(b). At 11.5 (or 12) T, near the critical field, the change of the slope becomes much sharper and the curves display a kink-like feature at about 1 K, which corresponds to the boundary between the FEIC and 5SL phases. The main reason for this enhanced anomaly should be the phonon scattering by the critical fluctuations.
As already mentioned above, the low- of the 0.035 samples are significantly smaller than those of the undoped samples. Both the weak temperature dependence (compared to the law of the boundary scattering limit) and the short mean free path of phonons indicate that the phonons are strongly scattered even at sub-Kelvin temperatures, which can only be attributed to the magnetic scattering effect. This is consistent with the specific heat data, showing that the magnetic excitations or fluctuations at low temperatures are strongly enhanced with Ga doping.
III.5 and of the 0.08 samples
Figures 9(a) and 9(b) show the magnetic-field dependence of and at low temperatures and in the -axis field for the 0.08 samples. At 1.95 K, the and isotherms show a valley-like feature: gradually decreases with increasing field and arrives a minimum at 11 T, followed by a quick increase at . In addition, an irreversibility is observed above between the field-up and field-down curves. Note that these behaviors are somewhat different from the of the 0.035 samples in two aspects. First, the of the 0.08 samples do not show sharp decrease or increase near the minimum values. Second, the irreversibility exists over all the high-field region and does not appear at the low-field side of the minimum. This is understandable since the ground states are different between the 0.035 and 0.08 samples.
These behaviors indicate a kind of spin-structure transition driven by the -axis field near 10 T. The 8%-Ga doped CuFeO2 is known to have the OPD ground state but the possible field-induced transitions have not been studied in earlier works. Analogous to the case of some other low-dimensional magnets, such as the zigzag-chain material CoNb2O6,Nakajima4 it is likely that magnetic field drives the OPD phase to some kind of ferrimagnetic phase.
For comparison, the isotherms with are shown in Fig. 9(c). At low temperatures, they exhibit a simple decrease of with increasing field without any transition and irreversibility in field up to 14 T. However, it should be noted that the behavior with is very similar to the low-field behavior with , which may indicate a similar field-induced transition at a higher field.
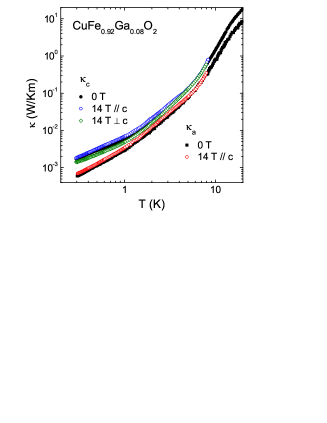
Figure 10 shows the temperature dependence of and with 14 T along or perpendicular to the axis. With 8%-Ga doping, the 1 K anomaly in the zero-field curves also moves to a bit lower temperature, similar to the case of the 0.035 samples. The 14 T fields in all directions have weak impact on this feature.
III.6 and of the 0.12 samples
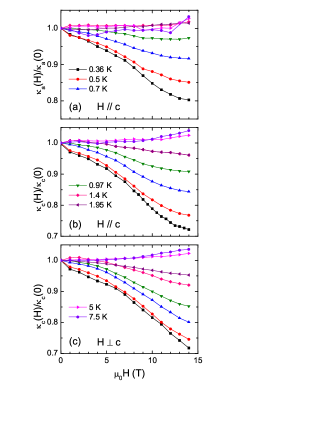
Figure 11 shows the magnetic-field dependence of and at low temperatures for the 0.12 samples. All the isotherms show similar behavior, that is, gradually decreases with increasing field up to 14 T. Furthermore, these curves are similar to those of the 0.08 sample with . The ground state and phase diagram of the 12%-Ga doped CuFeO2 have not been previously reported. Based on the phase diagram with up to 0.08, as shown in Fig. 1(c), it is likely that the ground state of the 0.12 sample is also OPD. This is supported by the nearly identical specific heat data between the 0.08 and 0.12 samples, as shown in Fig. 2(b). However, it seems that if the magnetic phase transitions of the 0.12 samples exists, they might happen at very high field for either or .
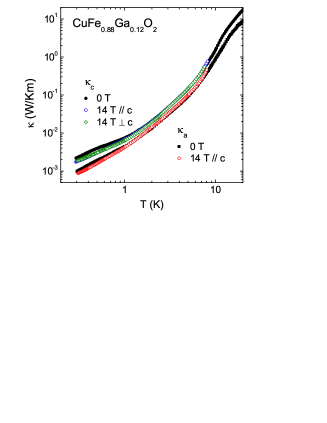
Figure 12 shows the temperature dependence of and with 14 T along or perpendicular to the axis. With 12%-Ga doping, the 1 K anomaly is still observable in the zero-field curves. The 14 T fields in all directions weaken this feature.
IV SUMMARY
In this work, we study the thermal conductivity of CuFe1-xGaxO2 ( 0–0.12) single crystals at temperatures down to 0.3 K and in magnetic fields up to 14 T. It was found that the thermal conductivities show drastic anomalies at temperature- or field-induced magnetic transitions, pointing to a strong spin-phonon coupling in this material. The temperature dependence of is rather complicated at very low temperatures and indicates magnetic scattering of phonons, which reveals non-negligible magnetic fluctuations in the “ground state” of pure and Ga-doped samples. This phenomenon is also evidenced by the specific-heat data at temperatures down to 0.4 K. In addition, the low- isotherms exhibit irreversibility in a broad region of magnetic field, which is not completely understood and calls for further investigation.
Acknowledgements.
This work was supported by the National Natural Science Foundation of China (Grant Nos. 11374277, 11574286, U1532147, 11404316), the National Basic Research Program of China (Grant Nos. 2015CB921201, 2016YFA0300103), and the Opening Project of Wuhan National High Magnetic Field Center (Grant No. 2015KF21).References
- (1) H. Schmid, Ferroelectrics 162, 317 (1994).
- (2) T. Kimura, T. Goto, H. Shintani, K. Ishizaka, T. Arima, and Y. Tokura, Nature 426, 55 (2003).
- (3) N. Hur, S. Park, P. A. Sharma, J. S. Ahn, S. Guha, and S-W. Cheong, Nature 429, 392 (2004).
- (4) T. Lottermoser, T. Lonkai, U. Amann, D. Hohlwein, J. Ihringer, and M. Fiebig, Nature 430, 541 (2004).
- (5) S.-W. Cheong and M. Mostovoy, Nat. Mater. 6, 13 (2007).
- (6) T. Kimura, J. C. Lashley, and A. P. Ramirez, Phys. Rev. B 73, 220401(R) (2006).
- (7) T. Arima, J. Phys. Soc. Jpn. 76, 073702 (2007).
- (8) A. H. Muir Jr. and H. Wiedersich, J. Phys. Chem. Solids, 28, 65 (1967).
- (9) H. Kawamura, J. Phys.: Condens. Matt. 10, 4707 (1998).
- (10) S. Mitsuda, H. Yoshizawa, N. Yaguchi, and M. Mekata, J. Phys. Soc. Jpn. 60, 1885 (1991).
- (11) S. Mitsuda, N. Kasahara, T. Uno, and M. Mase, J. Phys. Soc. Jpn. 67, 4026 (1998).
- (12) F. Ye, J. A. Fernandez-Baca, R. S. Fishman, Y. Ren, H. J. Kang, Y. Qiu, and T. Kimura, Phys. Rev. Lett. 99, 157201 (2007).
- (13) N. Terada, S. Mitsuda, H. Ohsumi, and K. Tajima, J. Phys. Soc. Jpn. 75, 023602 (2006).
- (14) F. Ye, Y. Ren, Q. Huang, J. A. Fernandez-Baca, P. C. Dai, J. W. Lynn, and T. Kimura, Phys. Rev. B 73, 220404(R) (2006).
- (15) N. Terada, Y. Tanaka, Y. Tabata, K. Katsumata, A. Kikkawa, and S. Mitsuda, J. Phys. Soc. Jpn. 75, 113702 (2006).
- (16) O. A. Petrenko, G. Balakrishnan, M. R. Lees, D. McK. Paul, and A. Hoser, Phys. Rev. B 62, 8983 (2000).
- (17) N. Terada, Y. Narumi, K. Katsumata, T. Yamamoto, U. Staub, K. Kindo, M. Hagiwara, Y. Tanaka, A. Kikkawa, H. Toyokawa, T. Fukui, R. Kanmuri, T. Ishikawa, and H. Kitamura, Phys. Rev. B 74, 180404(R) (2006).
- (18) T. T. A. Lummen, C. Strohm, H. Rakoto, A. A. Nugroho, and P. H. M. van Loosdrecht, Phys. Rev. B 80, 012406 (2009).
- (19) S. Seki, Y. Yamasaki, Y. Shiomi, S. Iguchi, Y. Onose, and Y. Tokura, Phys. Rev. B 75, 100403(R) (2007).
- (20) N. Terada, T. Nakajima, S. Mitsuda, H. Kitazawa, K. Kaneko, and N. Metoki, Phys. Rev. B 78, 014101 (2008).
- (21) N. Terada, T. Nakajima, S. Mitsuda, H. Kitazawa, J. Phys.: Conf. Ser. 145, 012071 (2009).
- (22) S. Seki, H. Murakawa, Y. Onose, and Y. Tokura, Phys. Rev. Lett. 103, 237601 (2009).
- (23) N. Terada, T. Kawasaki, S. Mitsuda, H. Kimura, and Y. Noda, J. Phys. Soc. Jpn. 74, 1561 (2005).
- (24) T. Nakajima, S. Mitsuda, K. Kitagawa, N. Terada, T. Komiya, and Y. Noda, J. Phys.: Condens. Matt. 19, 145216 (2007).
- (25) C. Hess, Eur. Phys. J. Spec. Top. 151, 73 (2007).
- (26) A. V. Sologubenko, T. Lorenz, H. R. Ott, and A. Friemuth, J. Low. Temp. Phys. 147, 387 (2007).
- (27) X. Zhao, Z. Y. Zhao, X. G. Liu, and X. F. Sun, Sci. China-Phys. Mech. Astron. 59, 117501 (2016).
- (28) M. Yamashita, N. Nakata, Y. Senshu, M. Nagata, H. M. Yamamoto, R. Kato, T. Shibauchi, and Y. Matsuda, Science 328, 1246 (2010).
- (29) X. F. Sun, W. Tao, X. M. Wang, and C. Fan, Phys. Rev. Lett. 102, 167202 (2009).
- (30) Z. Y. Zhao, B. Tong, X. Zhao, L. M. Chen, J. Shi, F. B. Zhang, J. D. Song, S. J. Li, J. C. Wu, H. S. Xu, X. G. Liu, and X. F. Sun, Phys. Rev. B 91, 134420 (2015).
- (31) Byung-Gu Jeon, B. Koteswararao, C. B. Park, G. J. Shu, S. C. Riggs, E. G. Moon, S. B. Chung, F. C. Chou, and K. H. Kim, Sci. Rep. 6, 36970 (2016).
- (32) R. Berman, Thermal Conduction in Solids (Oxford University Press, Oxford, 1976).
- (33) J. M. Ziman, Electrons and Phonons: The Theory of Transport Phenomena in Solids (Oxford University Press, 1960).
- (34) N. W. Ashcroft and N. D. Mermin, Solid State Physics (Harcourt Brace College Publishers, 1976).
- (35) X. M. Wang, C. Fan, Z. Y. Zhao, W. Tao, X. G. Liu, W. P. Ke, X. Zhao, and X. F. Sun. Phys. Rev. B 82, 094405 (2010).
- (36) X. M. Wang, Z. Y. Zhao, C. Fan, X. G. Liu, Q. J. Li, F. B. Zhang, L. M. Chen, X. Zhao, and X. F. Sun, Phys. Rev. B 86, 174413 (2012).
- (37) Z. Y. Zhao, X. M. Wang, C. Fan, W. Tao, X. G. Liu, W. P. Ke, F. B. Zhang, X. Zhao, and X. F. Sun, Phys. Rev. B 83, 014414 (2011).
- (38) Z. Y. Zhao, X. Zhao, H. D. Zhou, F. B. Zhang, Q. J. Li, C. Fan, X. F. Sun, and X. G. Li, Phys. Rev. B 89, 224405 (2014).
- (39) J. D. Song, J. C. Wu, X. Rao, S. J. Li, Z. Y. Zhao, X. G. Liu, X. Zhao, and X. F. Sun, J. Cryst. Growth 446, 79 (2016).
- (40) A. Tari, Specific Heat of Matter at Low Temperatures (Imperial College Press, 2003).
- (41) P. Svoboda, P. Javorský, M. Diviš, V. Sechovský, F. Honda, G. Oomi, and A. A. Menovsky, Phys. Rev. B 63, 212408 (2001).
- (42) J. Hemberger, M. Hoinkis, M. Klemm, M. Sing, R. Claessen, S. Horn, and A. Loidl, Phys. Rev. B 72, 012420 (2005).
- (43) P. Janíček, Č. Drašar, P. Lošt ák, J. Vejpravová, and V. Sechovský, Physica B 403, 3553 (2008).
- (44) G. Quirion, M. J. Tagore, M. L. Plumer, and O. A. Petrenko, Phys. Rev. B 77, 094111 (2008).
- (45) N. Terada, S. Mitsuda, Y. Oohara, H. Yoshizawa, and H. Takei, J. Magn. Magn. Mater. 272-276, e997 (2004).
- (46) N. Terada, S. Mitsuda, T. Fujii, and D. Petitgrand, J. Phys.: Condens. Matt. 19, 145241 (2007).
- (47) T. Nakajima, S. Mitsuda, T. Haku, K. Shibata, K. Yoshitomi, Y. Noda, N. Aso, Y. Uwatoko, and N. Terada, J. Phys. Soc. Jpn. 80, 014714 (2011).
- (48) T. Nakajima, A. Suno, S. Mitsuda, N. Terada, S. Kimura, K. Kaneko, and H. Yamauchi, Phys. Rev. B 84, 184401 (2011).
- (49) A. P. Ramirez, B. Hessen, and M. Winklemann, Phys. Rev. Lett. 84, 2957 (2000).
- (50) S. Nakatsuji, Y. Nambu, H. Tonomura, O. Sakai, S. Jonas, C. Broholm, H. Tsunetsugu, Y. M. Qiu, and Y. Maeno, Science 309, 1697 (2005).
- (51) Y. Okamoto, M. Nohara, H. Aruga-Katori, and H. Takagi, Phys. Rev. Lett. 99, 137207 (2007).
- (52) N. Terada, Y. Tsuchiya, H. Kitazawa, T. Osakabe, N. Metoki, N. Igawa, and K. Ohoyama, Phys. Rev. B 84, 064432 (2011).
- (53) D. B. Rogers, R. D. Shannon, C. T. Prewitt, and J. L. Gillson, Inorg. Chem. 10, 723 (1971).
- (54) P. Dordor, J. P. Chaminade, A. Wichainchai, E. Marquestaut, J. P. Doumerc, M. Pouchard, and P. Hagenmuller, J. Solid State Chem. 75, 105 (1988).
- (55) G. Quirion, M. L. Plumer, O. A. Petrenko, G. Balakrishnan, and C. Proust, Phys. Rev. B 80, 064420 (2009).
- (56) J. C. Wu, J. D. Song, Z. Y. Zhao, J. Shi, H. S. Xu, J. Y. Zhao, X. G. Liu, X. Zhao, and X. F. Sun, J. Phys.: Condens. Matt. 28, 056002 (2016).
- (57) X. Zhao, J. C. Wu, Z. Y. Zhao, Z. Z. He, J. D. Song, J. Y. Zhao, X. G. Liu, X. F. Sun, and X. G. Li, Appl. Phys. Lett. 108, 242405 (2016).
- (58) K. Kawasaki, Prog. Theor. Phys. 29, 801 (1963).
- (59) J. E. Rives, D. Walton, and G. S. Dixon, J. Appl. Phys. 41, 1435 (1971).
- (60) Z. Y. Zhao, X. M. Wang, B. Ni, Q. J. Li, C. Fan, W. P. Ke, W. Tao, L. M. Chen, X. Zhao, and X. F. Sun, Phys. Rev. B 83, 174518 (2011).
- (61) X. F. Sun and Y. Ando, Phys. Rev. B 79, 176501 (2009).
- (62) R. S. Fishman, F. Ye, J. A. Fernandez-Baca, J. T. Haraldsen, and T. Kimura, Phys. Rev. B 78, 140407(R) (2008).
- (63) J. T. Haraldsen, R. S. Fishman, and G. Brown, Phys. Rev. B 86, 024412 (2012).
- (64) T. Nakajima, S. Mitsuda, H. Okano, Y. Inomoto, and S. Kobayashi, K. Prokes, S. Gerischer, and P. Smeibidl, J. Phys. Soc. Jpn. 83, 094723 (2014).