Optical and structural study of the pressure-induced phase transition of CdWO4
Abstract
The optical absorption of CdWO4 is reported at high pressures up to 23 GPa. The onset of a phase transition was detected at 19.5 GPa, in good agreement with a previous Raman spectroscopy study. The crystal structure of the high-pressure phase of CdWO4 was solved at 22 GPa employing single-crystal synchrotron x-ray diffraction. The symmetry changes from space group 2/ in the low-pressure wolframite phase to in the high-pressure post-wolframite phase accompanied by a doubling of the unit-cell volume. The octahedral oxygen coordination of the tungsten and cadmium ions is increased to [7]-fold and [6+1]-fold, respectively, at the phase transition. The compressibility of the low-pressure phase of CdWO4 has been reevaluated with powder x-ray diffraction up to 15 GPa finding a bulk modulus of = 123 GPa. The direct band gap of the low-pressure phase increases with compression up to 16.9 GPa at 12 meV/GPa. At this point an indirect band gap crosses the direct band gap and decreases at -2 meV/GPa up to 19.5 GPa where the phase transition starts. At the phase transition the band gap collapses by 0.7 eV and another direct band gap decreases at -50 meV/GPa up to the maximum measured pressure. The structural stability of the post-wolframite structure is confirmed by ab initio calculations finding the post-wolframite-type phase to be more stable than the wolframite at 18 GPa. Lattice dynamic calculations based on space group explain well the Raman-active modes previously measured in the high-pressure post-wolframite phase. The pressure-induced band gap crossing in the wolframite phase as well as the pressure dependence of the direct band gap in the high-pressure phase are further discussed with respect to the calculations.
I INTRODUCTION
Nowadays used as a scintillating detector in x-ray tomography (Rathee et al., 2006), high-energy particle physics (Mikhailik and Kraus, 2010), and dosimetry devices (Silva et al., 2012), the wide-band gap (4 eV) semiconductor cadmium tungstate (CdWO4) has been extensively studied during the last three decades. It possesses a high light yield emission when hit by particles or x-rays and despite its long scintillation time (12-15 s) (Burachas et al., 1996), it played a key role in the discovery (Danevich et al., 2003) of the natural alpha activity in 180W. Also, the long decay time of the radiation created by self-trapped Frenkel excitons of CdWO4 makes this material a test bench for studying exciton-exciton interactions in semiconductors (Kirm et al., 2009). In order to improve the versatility of CdWO4 as a scintillating material, understanding how doping (Novosad et al., 2012) or externally modifying its interatomic distances affect its electronic structure, are of interest. In this context, pressure is an efficient tool to correlate changes in the bond distances with electronic properties.
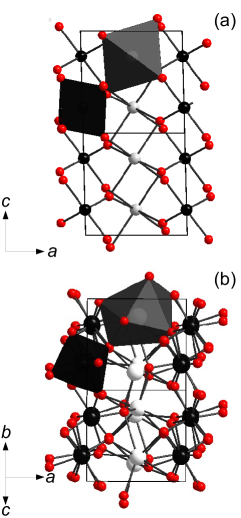
CdWO4 crystallizes in a wolframite-type structure (space group 2/) at ambient conditions in which both Cd and W atoms are octahedrally coordinated (Fig. 1). Such a structure confers CdWO4 a direct band gap along the direction of the Brillouin zone (Abraham et al., 2000; Fujita et al., 2008; Ruiz-Fuertes et al., 2012). At high pressures, the conduction band, mainly contributed by the 5 W levels, moves up as a result of the increase of repulsion, giving rise to a widening of the band gap at 12(1) meV/GPa up to at least 9.9 GPa (Ruiz-Fuertes et al., 2012). Previous high-pressure polarized optical microscopic studies (Jayaraman et al., 1995) showed the emergence of aligned color domains at around 10 GPa in CdWO4, probably due to the low-hydrostatic conditions. However, high-pressure Raman spectroscopy studies revealed that CdWO4 remains in the wolframite-type structure up to at least 20 GPa (Jayaraman et al., 1995; Lacomba-Perales et al., 2009). Above this pressure the number of Raman-active modes abruptly increases as a consequence of a phase transition, interpreted by the coexistence of a triclinic CuWO4-type structure and a tetragonal scheelite-type structure, according to the predictions (Lacomba-Perales et al., 2009). The proposed formation and coexistence of the two energetically similarly stable high-pressure phases at the same pressure, though explained the number of the observed Raman modes, is controversial since those Raman spectroscopy experiments were performed using a single crystal (Lacomba-Perales et al., 2009). In order to study such a phase transition one should employ a structural technique on a single crystal at the same experimental conditions. However, previous single-crystal x-ray diffraction (SXRD) has been limited to 8.2 GPa (Macavei and Schulz, 1993). Furthermore, previous electronic band structure calculations have indicated a band crossing in CdWO4 at 16 GPa, a pressure not experimentally explored yet (Ruiz-Fuertes et al., 2012) with optical absorption.
In this work we present a powder XRD and a SXRD study of CdWO4 up to 15 GPa and 22 GPa, respectively, to solve the structure of its high-pressure phase, and an optical absorption study up to 23 GPa to investigate the effect that the structural phase transition has on the optical properties of CdWO4. Finally, the stability of the high-pressure phase of CdWO4, the frequencies of its Raman modes, and its electronic properties have been investigated using ab initio calculations.
II EXPERIMENTAL DETAILS
For the non polarized optical absorption experiments at high pressure two 10-m-thick samples of CdWO4 were cleaved along the (010) plane from a large single crystal obtained from the MTI Corporation. redIn this orientation the cross-polarization terms of the complex reflection are both zero (Jellison Jr. et al., 2011). The samples were loaded in Neon pressure medium together with a ruby chip for pressure calibration (Mao et al., 1978) in a membrane-type diamond anvil cell (DAC) with 500-m culet anvils. The pressure chamber consisted of a hole with a diameter of 200-m drilled in an Inconel gasket previously preindented to 45-m thickness. The confocal optical setup used for the measurements consisted in a deuterium-halogen lamp, fused silica lenses, two Cassegrain objectives, and an UV-VIS spectrometer. The powder XRD experiments were carried out up to 15 GPa at the 16-IDB beamline of the HPCAT at the Advanced Photon Source (APS). The experiment was performed in a symmetric DAC with 480-m diamond culets and a rhenium gasket with a hole of 150 m was used as the pressure chamber. Neon was employed as pressure medium and the ruby fluorescence was used for pressure calibration. The monochromatic x-ray beam used had a wavelength of = 0.36783 Å and was focused down to m2. For the SXRD experiments we loaded a single-crystal sample together with a ruby chip and Neon was used as pressure medium in Boehler-Almax DACs equipped with diamond culets of 350 m diameter and tungsten gaskets preindented to 45 m thickness with a hole of 160-m diameter. The experiments were carried out at 15 and 22 GPa at the Extreme Conditions Beamline at PETRA III ( = 0.2925 Å and 0.2904 Å, respectively) using a PerkinElmer 1621 detector with a 8.3 9.6 m2 and 4 8 m2 beam and a sample to detector distance of 402.5 mm and 430.6 mm, respectively. The diffraction images were collected by 1∘ -scanning. The image format was converted according to the procedure described by Rothkirch et al. (2013) for further processing with the CrysAlisPro software (Agilent, 2013) for indexing reflections and intensity data reduction. The crystal structure of the high-pressure phase of CdWO4 exhibits a pseudo-orthorhombic metric at 22 GPa. However, attempts to solve the crystal structure in an orthorhombic space group were unsuccessful. Finally, the crystal structure was successfully solved in space group with SHELXS97-2 (Sheldrick, 2008) using direct methods and was subsequently converted to space group using PLATON (Spek, 2009). A pseudo-merohedral 2-component twin (55 %) related via a twin plane perpendicular to the -axis with the twin matrix (1 0 0, 0 1 0, 0 0 -1) was refined with SHELXL97-2 (Sheldrick, 2008). The programs were used with the WinGX interface (Farrugia, 1999). The final refinements were carried out with anisotropic displancement parameters for the tungsten and cadmium atoms and isotropic ones for the oxygen atoms. The final residual value R1 of the post-wolframite structure converged to 6.34 % at a data:parameter ratio of 26, which are excellent values for single-crystal structure refinements of high-pressure data, and even more for a twinned high-pressure phase.
III COMPUTATIONAL DETAILS
First principles calculations of the total-energy to study electronic structure and lattice dynamics were done within the framework of the density-functional theory (DFT) (Hohenberg and Kohn, 1996) and the pseudo-potential method using the Vienna ab initio simulation package (VASP) (Kresse and Hafner, 1993, 1994; Kresse and Furthmüller, 1996). The exchange and correlation energy were used in the generalized gradient approximation (GGA) with the PBE functional (Perdew et al., 1996). The projector-augmented wave (PAW) scheme (Blöch, 1994; Kresse and Joubert, 1999) was adopted and the semicore W electrons were also explicitly included in the calculations. The considered valence electron configuration was Cd 45, O 22, and W 56. The set of plane waves employed extended up to the kinetic energy cutoff of 530 eV to deal with the O atoms in order to have highly accurate results. The Monkhorst-Pack (Monkhorst and Pack, 1976) grid used for Brillouin-zone integrations ensured converged results to about 1 meV per formula unit. To perform the geometrical optimization we used 20 special -points of the reciprocal space with symmetry , 14 -points with , and 36 and 39 -points for and symmetries, respectively. In our simulations we obtain not only the energy and volume, we also obtain derivatives of the energy, forces, and stress. Hence, we also obtain the pressure from the ab initio simulations. In fact when we relax for a volume a structure, the relaxed structure should have diagonal stress tensor (hydrostatic), and zero forces on the atoms. In the relaxed equilibrium configuration the forces on the atoms were lower than 0.002 eV/Å and the deviation of the stress tensor from a diagonal hydrostatic form was less than 0.1 GPa. Lattice dynamic calculations were carried out at using the direct forces constant approach. This method involves the construction of the dynamical matrix, that requires highly converged results on forces. Diagonalization of the dynamical matrix provides both the frequencies of the normal modes and their polarization vectors. This allows us to identify the irreducible representation and the character of the phonon modes at the zone center. More details of the calculations can be found in Refs. (Ruiz-Fuertes et al., 2012; Lacomba-Perales et al., 2009; Ruiz-Fuertes et al., 2010)
IV EXPERIMENTAL RESULTS
IV.1 Optical Absorption
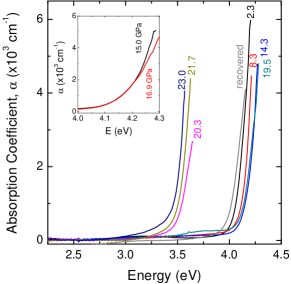
A selection of absorption-coefficient () spectra of CdWO4 at different pressures can be found in Fig. 2. At ambient pressure the absorption edge shows a steep increase up to a maximum value of 103 cm-1, in good agreement with a direct band gap (Ruiz-Fuertes et al., 2012). As observed in previous results up to 10 GPa (Ruiz-Fuertes et al., 2012), as pressure increases, the absorption edge keeps the same shape and shifts from 4 eV to higher energies up to 15 GPa. At 16.9 GPa the absorption edge reduces its steepness and starts to downshift to lower energies with increasing pressure up to 19.5 GPa when the sample exhibits a subtle color change and a low-absorbance step-like absorption spectrum emerges at lower energy ( 3.5 eV) in coexistence with the main absorption edge (Fig. 2). The shape of the newly emerged absorption spectrum indicates the contribution of two distinct electronic transitions with different absorbances. CdWO4 undergoes a structural phase transition at 20 GPa according to Raman Spectroscopy (Lacomba-Perales et al., 2009). Therefore, the existence of an additional low-absorbance absorption edge at 19.5 GPa can be attributed to the onset of the phase transition to the high-pressure phase, which at this pressure is a minor component. This is confirmed at 20.3 GPa with the loss of the high-energy absorption edge and an abrupt increase in the absorpbance of the low-energy absorption edge (103 cm-1), indicating the end of the phase transition. At higher pressures the absorption edge of the high-pressure phase of CdWO4 decreases in energy with further compression.
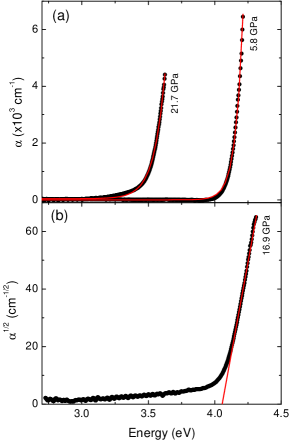
The steep-shaped absorption edges observed in the low-pressure phase absorption edge up to 15 GPa and in the high-pressure phase above 20.3 GPa are typical of direct band gaps. We have analyzed the absorption spectra in both phases employing the direct-band gap Urbarch’s rule , where is the band gap, is Urbach’s energy and is related to the steepness of the absorption tail, and is an intrinsic constant of the sample that accounts for the absorption of defects (Urbach, 1953). The fits to spectra of the low- and high-pressure phases (Fig. 3) confirm the direct nature of the band gaps in both phases (except at 16.9 and 19.5 GPa). In hydrostatic conditions (Klotz et al., 2009), where uniaxial stresses do not deteriorate the sample, and can be assumed to remain constant under pressure as long as the structure of the compounds and the density of defects remain constant (Ruiz-Fuertes et al., 2008). In the case of CdWO4 we have obtained an value of 600 cm-1 for both phases in good agreement with other wolframite-type compounds ( cm-1 for MgWO4) (Ruiz-Fuertes et al., 2012). For the , it takes a value of 0.056 eV in the low-pressure phase and 0.082 eV in the high-pressure phase. The higher value observed for in the high-pressure phase indicates an increase of point defects usually observed after a structural phase transition (Errandonea et al., 2006; Lacomba-Perales et al., 2011; Panchal et al., 2011). Regarding the absorption edges at 16.9 GPa and 19.5 GPa, in Fig. 2 we can see that they lose steepness, redshift with pressure, and cross the absorption edges measured at lower pressures. The linear dependence of with the photon energy (Fig. 3) confirms the indirect nature of the band gap at 16.9 and 19.5 GPa. After releasing pressure the recovered sample shows an absorption edge similar in shape and energy to the absorption edge of the low-pressure phase. This confirms the reversibility of the phase transition and the fact that pressure apparently does not induce defects in the used hydrostatic conditions.
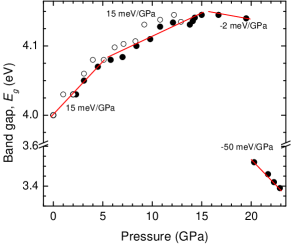
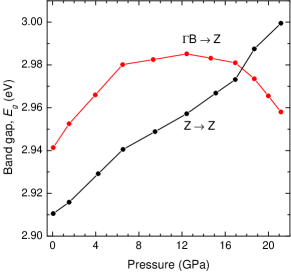
The values of the band gap energy obtained from the analysis of all measured spectra are shown in Fig. 4 together with the data from Ref. (Ruiz-Fuertes et al., 2012). We show that in the wolframite-type phase, the band gap increases up to 15 GPa with a pressure coefficient d/d of 12 meV/GPa in good agreement with previous data (Ruiz-Fuertes et al., 2012). Above 15 GPa, the change from a direct to an indirect band gap, associated to a band crossing previously reported (Ruiz-Fuertes et al., 2012) and observed in other wolframites before the phase transition (Errandonea et al., 2016), implies a negative pressure coefficient of -2 meV/GPa. At the phase transition the band gap collapses by 0.7 eV, with the direct band gap of the high-pressure phase showing a negative pressure dependence of -50 meV/GPa.
IV.2 X-ray diffraction
As explained in Sec. II, we carried out one powder XRD experiment (sup, ) up to 15 GPa and two SXRD experiments with CdWO4. One of the two SXRD experiments was performed below and the other one above the phase transition at 15 GPa and 22 GPa, respectively.
The unit-cell parameters and atomic coordinates obtained from the structural refinements of the single crystals at those two pressures are given in table 1. (sup, )
| 15 GPa | 16 GPa | 22 GPa | 22.9 GPa | ||
| Exp. | Calc. | Exp. | Calc. | ||
| 4.9431(4) | 4.9795 | 5.1884(7) | 5.2585 | ||
| 5.498(5) | 5.6553 | 6.1898(17) | 6.2535 | ||
| 4.9685(4) | 5.0110 | 7.5402(17) | 7.66382 | ||
| 93.136(6) | 92.26 | 90.01(2) | 90.67 | ||
| 134.82(12) | 140.99 | 242.15(9) | 251.99 | ||
| 2 | 2 | 4 | 4 | ||
| Cd | 0.5 | 0.5 | 0.5162(3) | 0.51039 | |
| 0.7126(1) | 0.70415 | 0.7675(3) | 0.76775 | ||
| 0.25 | 0.25 | -0.0358(2) | -0.02630 | ||
| 0.007(2) | 0.0117(3) | ||||
| W | 0 | 0 | -0.04762(17) | -0.04827 | |
| 0.1895(6) | 0.18652 | 0.48387(13) | 0.48930 | ||
| 0.25 | 0.25 | 0.20900(13) | 0.20798 | ||
| 0.0047(15) | 0.00936(19) | ||||
| O1 | 0.2112(15) | 0.20969 | 0.223(3) | 0.22598 | |
| 0.918(4) | 0.91069 | 0.511(3) | 0.50807 | ||
| 0.4645(14) | 0.45827 | 0.034(2) | 0.03741 | ||
| 0.0079(11) | 0.008(2) | ||||
| O2 | 0.2414(16) | 0.24264 | -0.150(3) | -0.14766 | |
| 0.397(5) | 0.38919 | 0.790(3) | 0.79670 | ||
| 0.3931(16) | 0.39126 | 0.155(2) | 0.14945 | ||
| 0.0089(13) | 0.012(2) | ||||
| O3 | 0.117(3) | 0.11768 | |||
| 0.670(3) | 0.67751 | ||||
| 0.371(2) | 0.36775 | ||||
| 0.010(2) | |||||
| O4 | -0.375(3) | -0.3123 | |||
| 0.457(3) | 0.46837 | ||||
| 0.300(3) | 0.29774 | ||||
| 0.014(3) | |||||
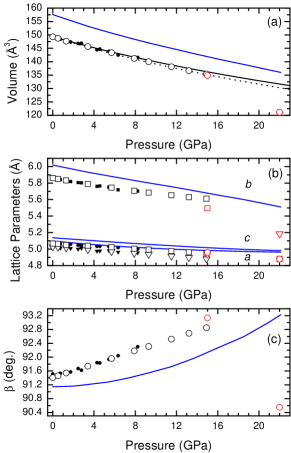
In Fig. 5 we show the pressure dependence of the unit-cell volume and lattice parameters from a previous study by Macavei and Schulz (1993) and from our powder XRD and SXRD experiments. Previous SXRD data (Macavei and Schulz, 1993) had been limited to 8.2 GPa. We have increased the pressure range to 15 GPa for the low-pressure phase and observed that the bulk modulus of this phase (Macavei and Schulz, 1993) had been overestimated (Fig. 5a). Using a second order Birch-Murnaghan equation of state to fit the combined data of Macavei and Schulz (1993) and ours, we obtain a bulk modulus GPa instead of 136 GPa that had previously been reported by Macavei and Schulz (1993). Regarding the lattice parameters (Fig. 5b) we confirm the observation by Macavei and Schulz (1993) that the axis is more compressible than the other axes. Similarly to MnWO4 (Ruiz-Fuertes et al., 2015), the monoclinic angle increases with pressure up to the phase transition.
The crystal structure of the high-pressure post-wolframite phase of CdWO4 was solved at 22 GPa from the SXRD data. While the -axis is increased with respect to the low-pressure structure at 15 GPa, the b and c basis vectors of the post-wolframite cell relate to the diagonal directions [01] and [0] in the bc plane of the wolframite cell, respectively. This is also reflected in a doubling of the unit cell volume of the post-wolframite phase with respect to that of the wolframite phase, and hence of the formula units from 2 to 4. The transformation can be described by the transformation matrix [1 0 0, 0 -1 1, 0 -1 -1]. The space group symmetry changes from 2/ in the wolframite phase to 21/ in the post-wolframite phase ( = -+, =--) at the phase transition accompanied by a change in the monoclinic -axis direction. The orientation relation between the wolframite and the post-wolframite phase was confirmed by a comparison of the orientation matrices of the same crystal at pressures below and above the phase transition. There is no group-subgroup relationship between the wolframite () and post-wolframite () space groups. A comparison of half of the post-wolframite unit-cell volume at 22 GPa with the wolframite unit-cell volume extrapolated from the equation of state to 22 GPa indicates a volume reduction of about 8 % at the phase transition (Fig. 5a). Such a huge volume drop points towards a first-order type of phase transition. Most of the volume compression is achieved by the compression of the wolframite axis, which also compensates for the significant increase of the axis (Fig. 5b). The crystal structure is severely reorganized at the phase transition, which is also expressed in a strong broadening of the single crystal reflections in the high-pressure phase. At the phase transition, the oxygen coordinations of cadmium and tungsten cations are increased from [6] to [6+1] and [7], respectively (Fig. 1).
Our crystal structure solution of the post-wolframite phase of CdWO4 from single-crystal x-ray diffraction clearly contradicts the earlier assumption of the coexistence of two high-pressure phases by Lacomba-Perales et al. (2009). In that work the formation of both a high-pressure phase with a CuWO4-type structure (S. G. ) and another one of the scheelite-type (S. G. ) had been proposed using ab initio calculations in order to interpret the experimentally observed Raman modes (Lacomba-Perales et al., 2009). Using our experimentally determined crystal structure, the Raman-mode assignment is revisited in section V.2 and the calculation of the electronic band structure is presented in section V.3, where it is discussed with respect to the pressure-induced behavior of the band gap across the phase transition.
V THEORETICAL RESULTS
V.1 Phase Stability
The calculated enthalpy differences of CdWO4 for the scheelite-type (S. G. ), CuWO4-type (S. G. ), and post-wolframite phase (S. G. ) as solved in this study are plotted with respect to the enthalpy of the wolframite-type structure (S. G. ) in Fig. 6.
.
At high pressures, Lacomba-Perales et al. (2009) reported from their calculations that the scheelite-type structure would become slightly more stable than the wolframite above 21.2 GPa. This is a pressure slightly higher than that of the phase transition onset (19.5 GPa) observed in the optical absorption study, but can be considered as a reasonable agreement. However, our calculations show that the post-wolframite structure of CdWO4, solved with SXRD at 22 GPa in this work, becomes more stable at 18 GPa than both the wolframite-type structure and the CuWO4-type structure, supporting our experimental structural solution.
In order to obtain the bulk moduli of both low- and high-pressure phases from the calculated data, we have also employed second order Birch-Murnaghan fits for a better comparison with the experimental data. The bulk modulus of the wolframite phase of CdWO4 from the calculations is . This is 9% lower than our updated value using combined experimental data from our study up to 15 GPa and from Macavei and Schulz (1993), and 18% lower than the obtained by Macavei and Schulz (1993) up to 8.2 GPa. The bulk modulus obtained in our calculations for the post-wolframite phase it is GPa.
V.2 Raman modes
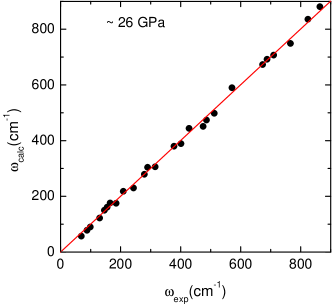
Since the previous structural prediction of the post-wolframite phase of CdWO4 had been based on the assignment of experimentally observed Raman modes, we have calculated frequencies and pressure coefficients () of the Raman active modes of CdWO4 at 26.1 GPa in the post-wolframite phase. They are presented in Table 2 together with the experimental values measured with Raman spectroscopy by Lacomba-Perales et al. (2009) at 26.9 GPa.
| (cm-1) | (cm-1/) | (cm-1) | (cm-1/) | |
|---|---|---|---|---|
| symm. | 26.1 GPa | 26.9 GPa | ||
| 57 | 2.90 | 69 | 1.96 | |
| 78 | 0.43 | 88 | 1.94 | |
| 90 | 0.68 | 99 | 0.09 | |
| 122 | 0.04 | 130 | 0.38 | |
| 137 | 1.42 | |||
| 150 | -0.49 | 146 | 1.35 | |
| 161 | -0.43 | 155 | 0.97 | |
| 176 | 1.97 | 165 | 0.19 | |
| 178 | 1.20 | 185 | 1.26 | |
| 199 | 1.28 | |||
| 218 | 0.91 | 209 | 1.26 | |
| 230 | -0.77 | 243 | -0.06 | |
| 270 | 2.16 | |||
| 279 | 0.26 | 279 | 2.53 | |
| 304 | 2.88 | 290 | 0.99 | |
| 306 | 0.19 | 315 | 3.00 | |
| 354 | 1.25 | |||
| 380 | 1.46 | 378 | 1.65 | |
| 389 | 2.66 | 401 | 2.31 | |
| 411 | 3.61 | |||
| 444 | 1.97 | 428 | 3.03 | |
| 451 | 1.56 | 475 | 2.51 | |
| 474 | 1.90 | 486 | 2.72 | |
| 498 | 1.86 | 512 | 2.33 | |
| 551 | 2.69 | |||
| 558 | 2.62 | |||
| 590 | 2.43 | 571 | 2.62 | |
| 656 | 1.52 | |||
| 673 | 2.39 | 673 | -0.82 | |
| 692 | 2.06 | 688 | 2.81 | |
| 707 | 1.71 | 710 | 1.60 | |
| 727 | 1.38 | |||
| 749 | 1.50 | 766 | 2.12 | |
| 803 | 1.85 | |||
| 836 | 1.43 | 824 | 2.23 | |
| 881 | 1.45 | 864 | 2.04 | |
With the point group and , the post-wolframite structure of CdWO4 (S.G. ) presents 36 Raman-active modes at zone center . 26 out of those modes had been experimentally observed (Lacomba-Perales et al., 2009). The agreement between the calculated and the experimental frequencies is excellent as can be directly observed in Fig. 7. In respect of the pressure coefficients the calculated and experimental values compare very well for most of the modes if we consider the overlapping and low intensity of many of the Raman modes that were measured in the earlier Raman-spectroscopy study (Lacomba-Perales et al., 2009). This confirms that after the phase transition all the observed Raman modes belong to the single high-pressure post-wolframite phase and not to two phases as proposed previously (Lacomba-Perales et al., 2009).
V.3 Electronic Structure
Previous calculations had proposed a band crossing in CdWO4 above 10 GPa (Ruiz-Fuertes et al., 2012). However, the experimental data had been limited to 9.9 GPa. In this work we have increased the experimental range to 23 GPa to explore this crossing. As shown in previous works (Abraham et al., 2000; Ruiz-Fuertes et al., 2012), the direct band gap of CdWO4 occurs along the point of the Brillouin zone. Calculations underestimate the direct band gap of the wolframite phase by 1.11 eV, as expected by DFT-GGA method and predict another indirect band gap . Ground states are considered to be accurately determined by the DFT-GGA. Since both the direct () and indirect () band gaps share the same final state we can assume that the underestimation (1.11 eV) is the same for both the direct and indirect transitions. Therefore, at ambient pressure the indirect band gap of CdWO4 should be at around 4.05 eV, 0.03 eV above the direct band gap and therefore, the indirect transition cannot be experimentally observed. As pressure is increased (Fig. 8) the O 2 states (which contribute to the valence band (Ruiz-Fuertes et al., 2012)) move downwards in energy almost symmetrically at both and points of the Brillouin zone up to 6 GPa. This results in a parallel energy increase of both direct and indirect transitions. Above 6 GPa, the energy of the O 2 orbitals continue decreasing at but slow down notably at . Above 12 GPa the energy at increases. This behavior produces an energy degeneracy of the valence band at both points of the Brillouin zone at 17 GPa. The result is a band crossing of both direct and indirect transitions in agreement with the experimental observation at 16.9 GPa (Fig. 4).
With respect to the high-pressure phase, in Fig. 9 we show the electronic band structure at 18 and 22.8 GPa. Since in the post-wolframite phase there are two additional non-equivalent positions for the O atoms and the formula units per unit cell double from = 2 to = 4, the number of symmetry directions of the Brillouin zone increases in two points to and giving rise to a more complex band structure with respect to the wolframite phase. Regarding the electronic contribution to the valence and conduction bands they are formed by the O 2 and the W 5 orbitals, respectively, as in the low pressure wolframite phase (Ruiz-Fuertes et al., 2012).
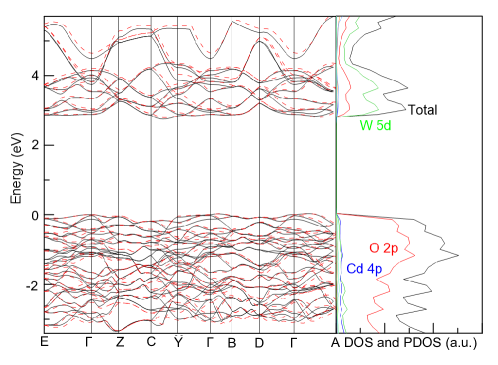
In spite of the low dispersion of the bands, as a result of the electrons, a close inspection to the calculated electronic band structure of the post-wolframite indicates that the maximum of the valence band is located along and the minimum of the valence band is found along the direction of the Brillouin zone. This would result into an indirect band gap which would widen with a pressure coefficient of 7.7 meV/GPa as the result of the pressure-induced increase in energy of the conduction band. This value contrasts with the experimental results that indicate a direct band gap which has a negative pressure coefficient. In fact, the only point of the conduction band that moves downwards in energy with pressure is the point at the direction of the Brillouin zone. When a direct and an indirect band gap are very close in energy, usually the direct one is favored. Since the direct transition in is only 0.1 eV higher in energy than the indirect , decreases in energy with pressure, and is allowed, we conclude that this direct band gap is the only one observed experimentally. The calculations underestimate the experimental band gap in 1 eV similarly to the understimation of the band gap of the low-pressure phase.
VI CONCLUSIONS
The high-pressure post-wolframite structure of CdWO4 has been solved at 22 GPa using single-crystal x-ray diffraction. It is a single phase with monoclinic structure and space group . Our result contradicts the previous proposal of two coexisting structures (Lacomba-Perales et al., 2009). Density-Functional-Theory based calculations support our structural solution which is more stable than the wolframite-type one above 18 GPa and provides a reliable assignment to the Raman modes observed by Lacomba-Perales et al. (2009) for the high-pressure phase. Moreover, optical absorption experiments have been extended to 23 GPa confirming previous results (Ruiz-Fuertes et al., 2012) up to 10 GPa. At 16.9 GPa a band crossing of an indirect band gap previously proposed by electronic band structure calculations (Ruiz-Fuertes et al., 2012) within the low-pressure wolframite phase was observed. With regards to the high-pressure phase our optical absorption calculations show a band gap collapse of 0.7 eV as the result of the phase transition to a direct band gap of 3.55 eV at 20 GPa. The experimental observation of a strong redshift (-50 meV) of this high-pressure phase band gap and its direct nature indicate that the calculated indirect band gap in post-wolframite is not experimentally observed and instead a direct band gap at appears.
Acknowledgments
J.R.-F. thanks the Juan de la Cierva Program (IJCI-2014-20513) of the Spanish MINECO. A.F. acknowledges financial support from the DFG, Germany, within priority program SPP1236 (Project FR-2491/2-1). W.M. acknowledges the BMBF, Germany (Projects 05K10RFA and 05K13RF1). This paper was partially supported by the Spanish Ministerio de Economıa y Competitividad (MINECO) under grants MAT2013-46649-C04-01/03-P, MAT2016-75586-C4-1/3-P, and No.MAT2015-71070-REDC (MALTA Consolider). Part of this research were carried out at the light source PETRA III at DESY, a member of the Helmholtz Association (HGF). Portions of this work were performed at HPCAT (Sector 16), Advanced Photon Source (APS), Argonne National Laboratory. HPCAT operations are supported by DOENNSA under Award No. DE-NA0001974 and DOE-BES under Award No. DE-FG02-99ER45775, with partial instrumentation funding by NSF. APS is supported by DOE-BES, under Contract No. DE-AC02-06CH11357.
References
- Rathee et al. (2006) S. Rathee, D. Tu, T. T. Monajemi, D. W. Rickey, and B. G. Fallone, Med. Phys. 33, 1078 (2006).
- Mikhailik and Kraus (2010) V. B. Mikhailik and H. Kraus, Phys. Stat. Sol. B 247, 1583 (2010).
- Silva et al. (2012) M. M. Silva, S. M. V. Novais, E. S. S. Silva, T. Schmitberger, Z. S. Macedo, and R. F. Bianchi, Mater. Sci. Commun. 136, 317 (2012).
- Burachas et al. (1996) S. P. Burachas, F. A. Danevich, A. S. Georgadze, H. V. Klapdor-Kleingrothaus, V. V. Kobychev, B. N. Kropivyansky, V. N. Kuts, A. Muller, V. V. Muzalevsky, A. S. Nikolaiko, et al., Nucl. Instrum. and Methods in Phys. Research A 369, 164 (1996).
- Danevich et al. (2003) F. A. Danevich, A. S. Georgadze, V. V. Kobychev, S. S. Nagorny, A. S. Nikolaiko, O. A. Ponkratenko, V. I. Tretyak, S. Y. Zdesenko, Y. G. Zdesenko, P. G. Bizzeti, et al., Phys. Rev. C 67, 014310 (2003).
- Kirm et al. (2009) M. Kirm, V. Nagirnyi, E. Feldbach, M. de Grazia, B. Carré, M. Merdji, S. Guizard, G. Geoffroy, J. Gaudin, N. Fedorov, et al., Phys. Rev. B 79, 233103 (2009).
- Novosad et al. (2012) S. S. Novosad, L. V. Kostyk, I. S. Novosad, A. P. Luchenko, and G. B. Stryganyuk, Acta Phys. Polonica A 122, 717 (2012).
- Abraham et al. (2000) Y. Abraham, N. A. W. Holzwarth, and R. T. Williams, Phys. Rev. B 62, 1733 (2000).
- Fujita et al. (2008) M. Fujita, M. Itoh, T. Katagiri, D. Iri, M. Kitaura, and C. B. Mikhailik, Phys. Rev. B 77, 155118 (2008).
- Ruiz-Fuertes et al. (2012) J. Ruiz-Fuertes, S. López-Moreno, J. López-Solano, D. Errandonea, A. Segura, R. Lacomba-Perales, A. Muñoz, S. Radescu, P. Rodríguez-Hernández, M. Gospodinov, et al., Phys. Rev. B 86, 125202 (2012).
- Jayaraman et al. (1995) A. Jayaraman, S. Y. Wang, and S. K. Sharma, Current Science 69, 44 (1995).
- Lacomba-Perales et al. (2009) R. Lacomba-Perales, D. Errandonea, D. Martínez-García, P. Rodríguez-Hernández, S. Radescu, A. Mújica, A. Muñoz, J. C. Chervin, and A. Polian, Phys. Rev. B 79, 094105 (2009).
- Macavei and Schulz (1993) J. Macavei and H. Schulz, Z. Kristallogr. 207, 193 (1993).
- Jellison Jr. et al. (2011) G. E. Jellison Jr., M. A. McGuire, L. A. Boatner, J. D. Budai, E. D. Specht, and D. J. Singh, Phys. Rev. B 84, 195439 (2011).
- Mao et al. (1978) H. K. Mao, P. M. Bell, J. W. Shaner, and D. J. Steinberg, J. Appl. Phys. 49, 3276 (1978).
- Rothkirch et al. (2013) A. Rothkirch, G. D. Gatta, M. Meyer, S. Merkel, M. Merlini, and H. P. Liermann, J. Synchrotron Rad. 20, 711 (2013).
- Agilent (2013) Agilent, CrysalisPro software system, version 1.171.36.28, Agilent Technologies UK Ltd., Oxford, UK (2013).
- Sheldrick (2008) G. M. Sheldrick, Acta Crystallogr. A 64, 112 (2008).
- Spek (2009) A. L. Spek, Acta Cryst. D 65, 148 (2009).
- Farrugia (1999) L. J. Farrugia, J. Appl. Crystallogr. 32, 837 (1999).
- Hohenberg and Kohn (1996) P. Hohenberg and W. Kohn, Phys. Rev. 139, 864 (1996).
- Kresse and Hafner (1993) G. Kresse and J. Hafner, Phys. Rev. B 47, 558 (1993).
- Kresse and Hafner (1994) G. Kresse and J. Hafner, Phys. Rev. B 49, 14251 (1994).
- Kresse and Furthmüller (1996) G. Kresse and J. Furthmüller, Phys. Rev. B 54, 11169 (1996).
- Perdew et al. (1996) J. Perdew, K. Burke, and M. Ernzerhof, Phys. Rev. Lett. 77, 3865 (1996).
- Blöch (1994) P. E. Blöch, Phys. Rev. B 50, 17953 (1994).
- Kresse and Joubert (1999) G. Kresse and D. Joubert, Phys. Rev. B 59, 1758 (1999).
- Monkhorst and Pack (1976) H. J. Monkhorst and J. D. Pack, Phys. Rev. B 13, 5188 (1976).
- Ruiz-Fuertes et al. (2010) J. Ruiz-Fuertes, S. López-Moreno, D. Errandonea, J. Pellicer-Porres, R. Lacomba-Perales, A. Segura, P. Rodríguez-Hernández, A. Muñoz, A. H. Romero, and J. González, J. Appl. Phys. 107, 083506 (2010).
- Urbach (1953) F. Urbach, Phys. Rev. 92, 1324 (1953).
- Klotz et al. (2009) S. Klotz, J.-C. Chervin, P. Munsch, and G. L. Marchand, J. Phys. D: Appl. Phys. 42, 075413 (2009).
- Ruiz-Fuertes et al. (2008) J. Ruiz-Fuertes, D. Errandonea, F. J. Manjón, D. Martínez-García, A. Segura, V. V. Ursak, and I. M. Tiginyanu, J. Appl. Phys. 103, 063710 (2008).
- Errandonea et al. (2006) D. Errandonea, D. Martínez-García, R. Lacomba-Perales, J. Ruiz-Fuertes, and A. Segura, Appl. Phys. Lett. 89, 091913 (2006).
- Lacomba-Perales et al. (2011) R. Lacomba-Perales, D. Errandonea, A. Segura, J. Ruiz-Fuertes, P. Rodríguez-Hernández, S. Radescu, S. López-Moreno, A. Mújica, and A. Muñoz, J. Appl. Phys. 110, 043703 (2011).
- Panchal et al. (2011) V. Panchal, D. Errandonea, A. Segura, P. Rodríguez-Hernández, A. Muñoz, S. López-Moreno, and M. Bettinelli, J. Appl. Phys. 110, 043723 (2011).
- Errandonea et al. (2016) D. Errandonea, C. Popescu, A. B. Garg, P. Botella, D. Martínez-García, J. Pellicer-Porres, P. Rodríguez-Hernández, A. Muñoz, V. Cuenca-Gotor, and J. A. Sans, Phys. Rev. B 93, 035204 (2016).
- (37) See Supplemental Material at [URL will be inserted by publisher] in order to see the powder diffraction patterns of CdWO4 at 1.3 and 13.2 GPa and a detailed table with the SXRD data collection parameters and refinement results including the equivalent or isotropic displacement parameters at 15 GPa for the low-pressure wolframite-type phase and at 22 GPa for the high-pressure post-wolframite phase.
- Ruiz-Fuertes et al. (2015) J. Ruiz-Fuertes, A. Friedrich, O. Gomis, D. Errandonea, W. Morgenroth, J. A. Sans, and D. Santamaría-Pérez, Phys. Rev. B 91, 104109 (2015).