Higgs with Hadronic Signatures
Abstract
The decay of the Higgs boson to b quarks should be the dominant decay mode, but it has not yet been conclusively established. The LHC run 1 results are recalled and the current status of the LHC Run 2 studies is reviewed. The analysis is approaching decisive sensitivity.
1 Introduction
The ATLAS and CMS combined Higgs coupling results[1] from LHC Run 1 included searches in association with vector bosons and top quarks. When Standard Model production is assumed then Br() is , where is measured over expected. If both production and decay rates are fitted, then Br()/Br() has .
This report discusses the results on from Run 2, which are currently a fragmentary picture but give indications of the direction. Cross-sections rise as the beam energy goes from 8 TeV to 13 TeV, especially in where the (expected) number of Higgs events analysed exceeds Run 1. The analyses have large backgrounds, so machine learning techniques such as Boosted Decision Trees (BDTs)[2] are used to identify events with enhanced signal to background.
2 VBF Higgs production
The highest-rate Higgs production process used for is vector boson fusion, with a cross-section of 3.8 pb. ATLAS and CMS have released results using different approaches. CMS, following Run 1, and with 2.3 fb-1, used a dedicated trigger selecting the topology of a central pair of b-jets and two forward jets, known as tag jets. ATLAS instead, from 12.6 fb-1, use the much rarer topology where an additional photon is produced. This simplifies the trigger and raises the signal to background but with a large price in rate.
The CMS trigger requires 3 jets at L1, and four at the HLT. Two categories are selected, either requiring a jet identified as a b-jet and a mass over 460 GeV for the tag pair, or two b jets and only 200 GeV mass in the tag pair. The signal efficiency is 6%. ATLAS used the photon as an L1 trigger, and then require a 700 GeV tag jet pair mass at HLT with no b-tag requirement.
Both ATLAS and CMS rely on BDTs to enrich in signal purity. They use different variables, but are sensitive to the same six areas: the dynamics of the VBF system, the b-jet content of the event, the quark or gluon nature of the tag jets, the suppression of jet activity between the tag jets, the H production angles and the overall momentum of the system of four jets. The modelling in the ATLAS case is corrected using side-bands. The resulting BDT output is used to define several signal regions.
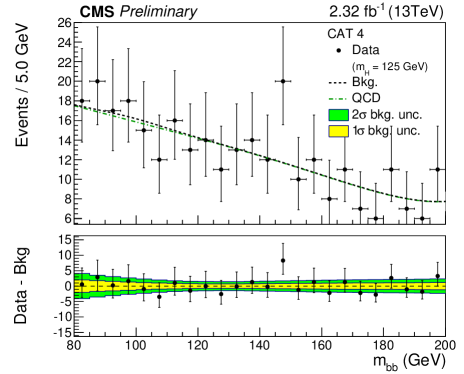
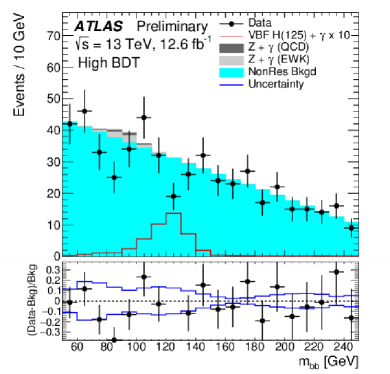
The BDT selections are designed not to bias the mass of the Higgs dijet, allowing the signal rate to be extracted from a fit to a smooth background and a signal peak, which reduces dependence upon the background simulation. In the CMS case the background shape is constrained using the lower purity regions. Figure 1 shows the most sensitive regions. The resulting estimates of the signal strength are for CMS and for ATLAS.
3 Vector-boson associated
The total cross-sections for ZH and WH are 0.88 pb and 1.37 pb respectively, but only non-hadronic vector boson decays are used. Furthermore, the background in an inclusive analysis is very large, but a boosted topology provides the sensitivity. ATLAS have released results[6] using 13.2 fb-1 which are briefly reported here.
The analysis uses selections for 0, 1 or 2 leptons, (muons or electrons), targeting , and respectively. In each case two b-jets are required from the Higgs, with possible extra jets. The backgrounds and triggers vary considerably: two leptons provides the cleanest, but low rate, channel; one lepton has the highest rate but large top backgrounds and the zero lepton channel has the best overall sensitivity.
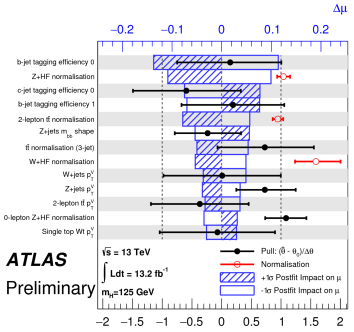
The trigger comes from either the charged leptons or E, and is most problematic in the zero lepton channel, where an online threshold of 90 GeV was used in 2016. All channels apply a pT threshold of 150 GeV to the Higgs candidate, with the exception of the di-lepton, where an additional signal region of lower pT events is used. A BDT is used to produce signal-enriched regions, but the mass is included, implying that the background modelling is critical. Figure 2 shows the impact on of various systematic errors; dominated by flavour tagging and the normalisation of plus heavy flavour background.
The resulting signal strength is . A test using the same methodology, but searching for , yields , giving confidence in the modelling.
4 Top-pair associated
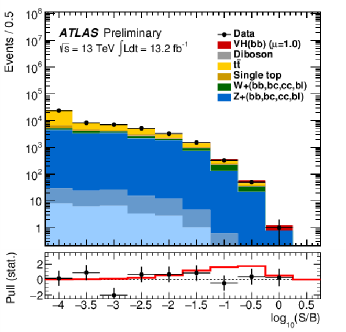
Both CMS and ATLAS have released analyses[7, 8] based on about 13 fb-1 of data. The channel cross-section rose by a factor 3.8 from 8 TeV to 0.51 pb. The leptonic top decay provides an excellent tag and trigger, but the complex final state means that , and especially , modelling issues dominate the analysis.
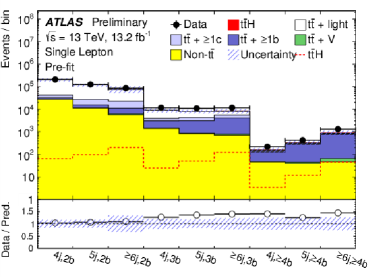
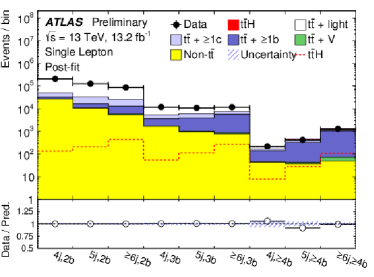
Figure 3 shows the distribution of numbers of events in bins of the number of jets and the number of b-tagged jets in ATLAS before and after the fit. Significant mismodelling can be seen - much larger that the signal size. CMS and ATLAS both used PowHeg v. 2 to simulate , but CMS used a custom tune based on 8 TeV data and get a better pre-fit agreement.
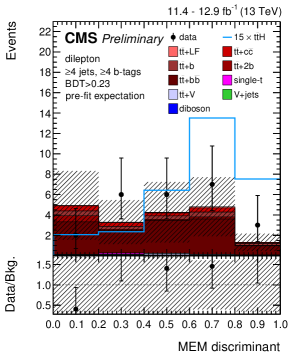
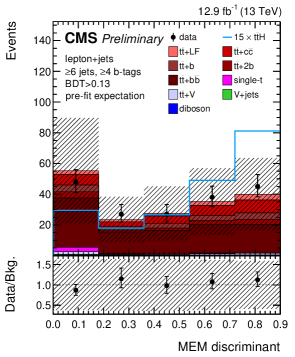
The fits are to BDT or Matrix Element Method (MEM) distributions. Uncertainties on background shapes are taken from scale variations, PDFs etc., but both ATLAS and CMS add additional uncertainty to the rate of top pairs with additional heavy-flavour quarks. The fit to the data constrains the modelling so that finally there is good agreement across the distribution and much reduced uncertainties. This is essential if the analysis is to be sensitive.
 ,
,
 ,
,
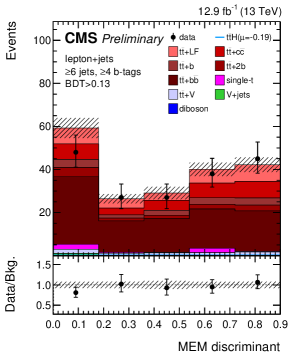
Figure 4 shows the most signal-enriched regions of the CMS analysis, in one and two lepton modes. The impact of the fit in reducing the uncertainties can again be seen.
5 Summary and Conclusions
| Production mode | Expt. | Luminosity | Rate |
|---|---|---|---|
| ATLAS | 13.2 fb-1 | 2.1 | |
| CMS | 12.9 fb-1 | ||
| ATLAS | 13.2 fb-1 | ||
| VBF | CMS | 2.3 fb-1 | |
| VBF+ | ATLAS | 12.6 fb-1 | |
| Naive average | n.a. | 0.2 | |
The measured rates of in the various analyses discussed here are presented in table 1, together with an average which symmetrises the error bars and combines all the estimates as uncorrelated. The run 2 data do not yet show clear evidence for the process, but the precision is interesting. Future measurements will have much larger samples, which will not only improve the statistical precision but also allow better control of the systematics and in many cases the identification of higher purity regions. The current, murky, situation will improve dramatically.
References
References
- [1] ATLAS and CMS collaborations, Journal of High Energy Physics 8, 45 (2016).
- [2] L. Breiman, J.H. Friedman, R.A. Olshen and C.J. Stone, Classification and Regression Trees, Wadsworth, Stamford, 1984.
- [3] CMS Collaboration, CMS-PAS-HIG-16-019, 2016.
- [4] CMS Collaboration, CMS-PAS-HIG-16-03, 2016.
- [5] ATLAS Collaboration, ATLAS-CONF-2016-063, 2016.
- [6] ATLAS Collaboration, ATLAS-CONF-2016-091, 2016.
- [7] CMS collaboration, CMS-PAS-HIG-16-038, 2016.
- [8] ATLAS collaboration, ATLAS-CONF-2016-080, 2016.