DeepGO: Predicting protein functions from
sequence and interactions using a deep ontology-aware classifier
Maxat Kulmanov1, Mohammed Asif Khan1, Robert Hoehndorf1, *,
1 Computational Bioscience Research Center,
Computer, Electrical and Mathematical Sciences & Engineering
Division,
King Abdullah University of Science and Technology,
4700 King Abdullah University of Science and Technology,
Thuwal
23955-6900, Kingdom of Saudi Arabia
* robert.hoehndorf@kaust.edu.sa
Abstract
Motivation: A large number of protein sequences are
becoming available through the application of novel high-throughput
sequencing technologies. Experimental functional characterization of
these proteins is time-consuming and expensive, and is often only
done rigorously for few selected model organisms. Computational
function prediction approaches have been suggested to fill this
gap. The functions of proteins are classified using the Gene
Ontology (GO), which contains over 40,000 classes. Additionally,
proteins have multiple functions, making
function prediction a large-scale, multi-class, multi-label problem.
Results: We have developed a novel method to predict
protein function from sequence. We use deep learning to learn
features from protein sequences as well as a cross-species
protein-protein interaction network. Our approach specifically
outputs information in the structure of the GO and utilizes the
dependencies between GO classes as background information to
construct a deep learning model. We evaluate our method using the
standards established by the Computational Assessment of Function
Annotation (CAFA) and demonstrate a significant improvement over
baseline methods such as BLAST, with significant improvement for
predicting cellular locations.
Availability and Implementation:
Web server: http://deepgo.bio2vec.net, Source code:
https://github.com/bio-ontology-research-group/deepgo
1 Introduction
Advances in sequencing technology have led to a large and rapidly increasing amount of genetic and protein sequences, and the amount if expected to increase further through sequencing of additional organisms as well as metagenomics. Although knowledge of protein sequences is useful for many applications, such as phylogenetics and evolutionary biology, understanding the behavior of biological systems additionally requires knowledge of the proteins’ functions. Identifying protein functions is challenging and commonly requires in vitro or in vivo experiments [12], and it is obvious that experimental functional annotation of proteins will not scale with the amount of novel protein sequences becoming available.
One approach to address the challenge of identifying proteins’ functions is the computational prediction of protein functions [22]. Function prediction can use several sources of information, including protein-protein interactions [24], genetic interactions [12], evolutionary relations [14], protein structures and structure prediction methods [19], literature [28], or combinations of these [25]. These methods have been developed for many years, and their predictive performance is improving steadily [22].
There are several key challenges for protein function prediction methods. One of these is the complex relation between protein sequence, structure and function [2]; despite significant progress in the past years in protein structure prediction [20], it still requires large efforts to predict protein structure with sufficient quality to be useful in function prediction. Another challenge is the large and complex output space for any classification method. Protein functions are classified using the Gene Ontology (GO) [6] which contains over 40,000 functions and cellular locations. Additionally, the GO contains strong, formally defined relations between functions that need to be taken into account during function prediction to ensure that these predictions are consistent [25, 22]. The formal dependencies between classes in GO also lead to the situation where proteins are assigned to multiple function classes in GO, for different levels of abstraction. Furthermore, several proteins do not only have a single function but may be peiotropic and have multiple different functions, making function prediction inherently a multi-label, multi-class problem. A final challenge is that proteins do not function in isolation. In particular higher-level physiological functions that go beyond simple molecular interactions, such as apoptosis or regulation of heart rate, will require other proteins and cannot usually be predicted by considering a single protein in isolation. Due to these challenges, it is also not obvious what kind of features should be used to predict the functions of a protein, and whether they can be generated efficiently for a large number of proteins.
Here, we present a novel method for predicting protein functions from protein sequence and known interactions. We combine two forms of representation learning based on multiple layers of neural networks to learn features that are useful for predicting protein functions, one method that learns features from protein sequence and another that learns representations of proteins based on their location in an interaction network. We then utilize these features in a novel deep neuro-symbolic model that is built to resemble the structure and dependencies between classes that exist within the GO, refine predictions and features on each level of GO, and ultimately optimize the performance of function prediction based on the performance over the whole ontology hierarchy.
We demonstrate that our model improves performance of function prediction over a BLAST baseline, and performs particularly well in predicting cellular locations of proteins. The main advantage of our approach is that it does not rely on manually crafted features but is entirely data-driven.
2 Materials and Methods
2.1 Datasets
For our experiments, we use the Gene Ontology (GO) [6], downloaded on 05 January 2016 from http://geneontology.org/page/download-ontology in OBO format. The version of GO has 44,683 classes of which 1,968 are obsolete. GO has three major branches, one for biological processes (BP), molecular functions (MF) and cellular components (CC), each containing 28,647, 10,161, and 3,907 classes, respectively.
We use SwissProt’s [9] reviewed and manually annotated protein sequences with GO annotations downloaded on 05 January 2016 from http://www.uniprot.org/uniprot/. The dataset contains 553,232 proteins, and 525,931 proteins have function annotations. Furthermore, we select proteins with annotations with experimental evidence code (EXP, IDA, IPI, IMP, IGI, IEP, TAS and IC) and filter the proteins by maximum length of 1,002 ignoring proteins with ambiguous amino acid codes (B, O, J, U, X, Z) in their sequence. Our final dataset contains 60,710 proteins annotated with 27,760 classes (19,181 in BP, 6,221 in MF, and 2,358 in CC).
2.2 Training
We trained three models, one for each sub-ontology in GO. First, we propagate annotations using the GO ontology structure and randomly split proteins into a training set (80%) and testing set (20%). Due to computational limitations and the small number of annotations for very specific GO classes, we ranked GO classes by their number of annotations and selected the top 932 terms for BP, 589 terms for MF and 436 terms for the CC ontology. These cutoff values correspond to selecting only classes with the minimum number of annotations 250, 50, and 50, for BP, MF, and CC, respectively.
We create three binary label vectors for each protein sequence, one for each of the GO hierarchies. If a protein sequence is annotated with a GO class from our lists of selected classes, then we assign to the term’s position in the binary label vector and use it as positive sample for this term. Otherwise, we assign and use it as negative sample. For training and testing, we use proteins which have been annotated with at least one GO term from the set of the GO terms for the model.
2.3 Data Representation
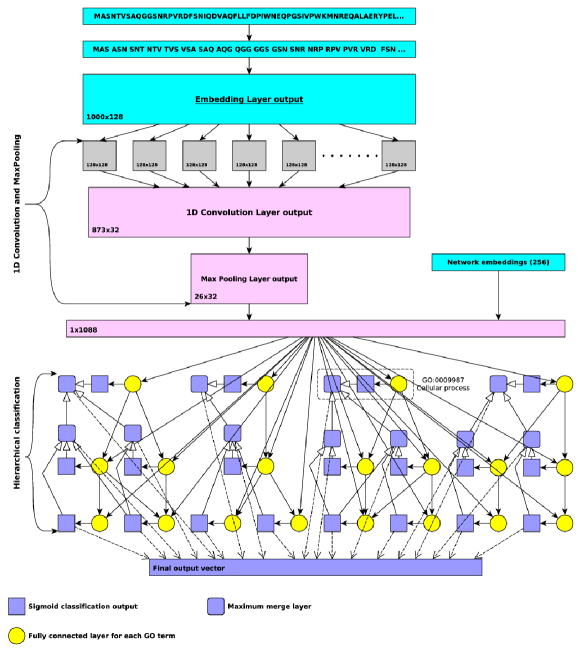
The input of our model is the amino acid (AA) sequence of a protein. Each protein is a character sequence composed of 20 unique AA codes. We generate trigrams of AA from the protein sequence. The trigrams can be represented as one-hot encoding vectors of length 8,000; however, the sparse nature of one-hot encodings only provides a limited generalization performance. To address this limitation, we use the notion of dense embeddings [17, 7]. An embedding is a lookup table used for mapping each code in a vocabulary to a dense vector. Initially, we initialized the vectors randomly and then learn the actual vector-based representations as an additional layer in our network architecture during training. This approach allows us to learn meaningful vectors, i.e., vectors that resemble correlations within the data that can be utilized as features to predict protein functions. We have also performed experiments (on a smaller dataset) with one-hot encodings of AA trigrams, and found that dense representation performs better than one-hot encoding.
We built a vocabulary of unique AA trigrams where each trigram is represented by its 1-based index. Using this vocabulary, we encoded a sequence of length as a vector of indices. If the length of the sequence is less than , we pad the vector with zeros. We ignore all the proteins with sequence length more than . The first layer in the deep learning model is intended to learn embeddings where each index is mapped to a dense vector by referring to a lookup table, using an embedding size of and therefore representing a protein sequence of length of as a matrix of .
2.4 Convolutional Neural Network
Convolutional Neural Networks (CNNs) are biologically inspired NN which try to mimic the receptive field of biological neuron. In CNNs, convolution operations are applied over the input layer to compute the output [8]. They exploit local correlation by enforcing local connections between neurons of adjacent layers, where each region of the input is connected to a neuron in the output. Having multiple convolution filters helps in learning multiple features and providing insights into multiple facets of the data. In our work, we used 1-dimensional (1D) convolution over protein sequence data. The 1D convolution exploits sequential correlation. If we have an input and a kernel function , the convolution between and with stride is defined as:
| (1) |
where is an offset constant. The output is obtained by a sum over of the convolutions between and . The output vector represents the feature map learned through convolution.
The resulting feature map will contain redundant information and is of significant size. Therefore, to reduce the feature space, redundant information is discarded through temporal max-pooling [11]. This operation selects the maximum value over a window of some length . The features after convolution and the temporal pooling layer are intended to be higher level representation of protein sequences which can then be used as input to fully connected layers for classification.
For our experiments, we used one 1D Convolution layer with filters of size which are applied on the embedding matrix of each sequence, and a 1D max-pooling layer with pool length of and stride of . Each filter is intended to learn a specific type of feature, and multiple filters may enable learning of different aspects of the underlying data. The output of the 1D max-pooling layer is a vector with length of .
2.5 Protein-protein interaction (PPI) network features
In addition to protein sequences, we use protein-protein interaction (PPI) networks for multiple species from the STRING database [26], filtered by confidence score of 300 and connected with orthology relations from the EggNOG database [18] by creating a symmetric ortholog-of edge for each orthology group. To further separate proteins by the orthology group to which they belong, we introduce a new orthology relation for each orthology group in eggNOG. In total, the network consists of 8,478,935 proteins, 190,649 edge types and 11,586,695,610 edges. Using this heterogeneous network, we generated knowledge graph embeddings of size for each protein [4].
Since our model is based on UniProt protein identifiers, we mapped nodes in the network to UniProt identifiers using the identifier mapping provided by STRING. We mapped 6,960,395 proteins in UniProt to our network and the resulting knowledge graph embeddings. For the proteins with missing network representations, we assigned a vector of zeros. We combined the knowledge graph embeddings for the nodes with the output of the max-pooling layer of length 832 as a combined feature vector.
2.6 Hierarchical classification layout
Using a fully-connected layers for each class in GO, we created a hierarchical classification neural network model. We use only the subclass relations and create a small neural network for each class in our subset of selected terms. Each network consists of two fully-connected layers. The first layer has an output of 256 neurons with a Rectified linear unit (RelU) activation function, and takes as an input the protein representation concatenated with a first layer outputs of the parent terms. The second layer has an output of a single neuron with a sigmoid activation function and takes as an input the output of the first layer. This layer is responsible for classifying the proteins for its term. To ensure consistent hierarchical classification, for each class which has children in GO, we created a merge layer which selects the maximum value of the classification layers of the term and its children. Finally, the output of the model is the concatenation of classification layers of leaf nodes and the maximum layers of internal nodes. Figure 1 shows the architecture of our neural network model.
2.7 Model implementation and optimization
In training, we minimize the multi-output binary cross entropy loss function using the Rmsprop optimizer [27] with a mini batch of size and learning rate of . Initially, the weights of our model are initialized according to a uniform distribution [16]. We fit our model with 80% of our training set and use the remaining 20% of the training set as a validation set. At the end of each training epoch, we monitor the convergence of the model on the validation set and keep the weights of the best performing model. To prevent over-fitting of the model, we use dropout layers as regularizers. We implement our model using the deep learning library Keras with TensorFlow [1] as a backend. To accelerate the training process, we use NVIDIA Pascal X GPUs. We manually tuned the following set of parameters: minibatch size, number of convolution filters, filter size, number of neurons in fully connected layer, and learning rate. Source code for our implementation is available at https://github.com/bio-ontology-research-group/deepgo.
2.8 BLAST baseline
We use the BLAST [5] sequence alignment method as a baseline to compare our model’s performance. We use BLAST to find the most similar sequence in a database of experimentally annotated proteins for a query sequence and assign all its annotations to the query sequence. We create a database for each ontology with a proteins in our training set that have been annotated with at least one term from the ontology. For a proteins in our test set, we use the BLASTP program to obtain the protein with the highest alignment score from our training set and assign all its functional terms to the protein from our test set.
2.9 Evaluation
We evaluate our model performance with two measures [10] that are used in CAFA challenge [22]. The first measure is a protein centric maximum F-measure. Here, we compute F-measure for a threshold using the average precision for proteins for which we predict at least one term and average recall for all proteins. Then, we select the maximum F-measure of all thresholds. We compute the measure using the following formulas:
| (2) |
| (3) |
| (4) |
| (5) |
| (6) |
In these measures, is GO class, is a set of predicted classes for a protein using a threshold , and is a set of annotated classes for a protein . Precision is averaged over the proteins where we at least predict one term and is the total number of such proteins. is a number of all proteins in a test set.
The second measure is a term-centric where for each term we compute AUC of a ROC Curve of a sensitivity (or a recall) for a given false positive rate (1 - specificity). We compute sensitivity and specificity using the following formulas:
| (7) |
| (8) |
Here, is a set of predicted terms for a protein using a threshold and is a set of annotated terms for a protein . Additionally, we report a term-centric measure where for each term we compute the F-measure using threshold and all proteins in our test set. Then, we take the maximum for all the thresholds.
| (9) |
| (10) |
| (11) |
3 Results
3.1 Feature learning and neuro-symbolic hierarchical classification
We build a machine learning model that aims to address three challenges in computational function prediction: learning features to represent a protein, predicting functions in a hierarchical output space with strong dependencies, and combining information from protein sequences with protein-protein interaction networks. The first part of our model learns a vector representation for a protein sequence which can be used as features to predict protein functions. The second part of the model aims to encode for the functional dependencies between classes in GO and optimizes classification accuracy over the hierarchical structure of GO at once instead of optimizing one model locally for each class. The intention is that this model can identify both explicit dependencies between classes in GO, as expressed by relations between classes encoded in the ontology, as well as implicit dependencies such as frequently co-occurring classes. While a single model over the entire GO would likely yield best results, due to the size of the GO, we independently train three models for each of GO’s three sub-ontologies, Molecular Function (MF), Biological Process (BP), and Cellular Component (CC), and focus exclusively on subclass relations between GO classes. We generate a series of fully connected layers, one for each class in the GO. Each of these layers has exactly one connection to an output neuron, , and, for each direct subclass of , a connection to another layer representing . This architecture resembles the hierarchical structure of GO and the dependencies between its classes, ensures that discriminating features of each class can be learned hierarchically while taking into account the symbolic relations in GO. More generally, each dense layer of this ontology-structured neural network layout is intended to learn features that can discriminate between its subclasses and will pass these features on to the next layers. Figure 1 illustrates the basic architecture of our model.
We train three model in a supervised way (one model for each of the GO ontologies). For this purpose, we first split all proteins with manually curated GO annotations in SwissProt in a training set (80%) and an evaluation set (20%). We use the manually assigned GO functions of the proteins in the training set to train our models. The performance of each model is globally optimized over all the GO functions (within either the MF, BP, or CC hierarchy) through back-propagation. We then evaluate the performance of our model on the 20% of proteins not used for training, using the evaluation metrics developed and employed in the CAFA challenge [22]. Table 1 shows the overall performance of our model and the comparison to using BLAST to assign functions. We find that our model, which relies only on protein sequences (DeepGOSeq), outperforms BLAST in predicting cellular locations, but does not achieve improved performance compared to BLAST in the MF and BP ontologies when evaluated either on the full set of GO functions or the subset used by our model.
3.2 Incorporating protein networks
The majority of functions and biological processes in GO require multiple proteins to be performed. One source of information for proteins acting together can be obtained from protein-protein interaction networks. By adding information about protein-protein interactions, we planned to improve our model’s performance, in particular for prediction of associations to biological processes which usually require more than one protein to be performed. We encode protein-protein interactions as a multi-species knowledge graph of interacting proteins in which proteins within a species are linked through interacts-with edges and proteins in different species through a orthologous-to edge. We then apply a method to generate knowledge graph embeddings [4] to this graph and generate a vector representation for each protein. Furthermore, we integrate this vector representation with the protein sequence representation in our model, resulting in a multi-modal model that utilizes both protein sequences and protein interactions. Incorporating this network information significantly improves the performance for almost all GO classes, and the overall performance of our DeepGO method improves significantly in comparison with DeepGOSeq which uses only protein sequence as a feature, and in comparison to the BLAST baseline. Table 1 summarizes the results.
We find that the predictive performance of our model varies significantly between proteins in different organisms, in particular between single-cell and multi-cellular organisms. Table 2 summarizes the performance we achieve for individual organisms, and further broadly distinguishes between eukaryotic and prokaryotic organisms. We find that DeepGO achieves high performance for well-characterized model organisms, likely due to the rich characterization of protein functions in these organisms; other organisms do not have a large set of manually asserted function annotations and are therefore represented more sparsely in our evaluation set.
We further evaluated how well DeepGO performs on different types of proteins. InterPro classifies proteins into families, domains and important sites [13]. We evaluate DeepGO’s performance by grouping proteins by their InterPro annotations. Supplementary Table 1 shows the performance for InterPro classes with at least 50 protein annotations in our test set. We find that for some important protein families, such as p53-like transcription factors (IPR008967), DeepGO can achieve high performance in all three GO ontologies, while for other kinds of proteins, such as those with a Ubiquitin-related domain (IPR029071), DeepGO fails to predict annotations to BP and MF accurately.
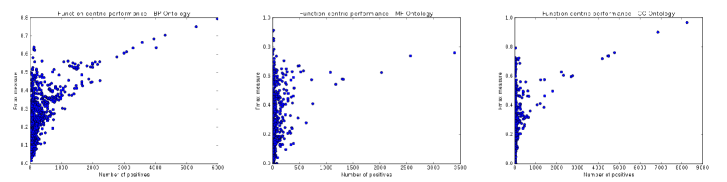
We further perform a term-centric evaluation [22] in which we test how accurate our predictions are for different GO functions. Supplementary Table 2 shows the best performing GO functions from each ontology. Unsurprisingly, high-level functions with a large number of annotations generally perform significantly better than more specific functions. We further test whether the variance in predictive performance is intrinsic to our method or the result of different amounts of training data available for proteins of different families, with different domains, or for GO functions with different number of annotations. We plot the predictive performance of DeepGO as a function of the number of training samples in Figure 2, and observe that performance is strongly correlated with the number of training instances. However, due to the hierarchical nature of GO, an increased number of training instances will always be available for more general, high-level functions. In the future, additional weights based on information content of GO classes [23] should be assigned to more specific functions which contain more information [22, 10]; using these weights during training of our model may improve performance for more specific functions.
| Method | BP | MF | CC | ||||||
|---|---|---|---|---|---|---|---|---|---|
| AvgPr | AvgRc | AvgPr | AvgRc | AvgPr | AvgRc | ||||
| BLAST | 0.31 | 0.30 | 0.33 | 0.37 | 0.37 | 0.38 | 0.36 | 0.32 | 0.42 |
| DeepGOSeq | 0.25 | 0.20 | 0.33 | 0.36 | 0.47 | 0.29 | 0.57 | 0.59 | 0.55 |
| DeepGO | 0.36 | 0.39 | 0.34 | 0.46 | 0.60 | 0.38 | 0.63 | 0.66 | 0.61 |
| BLAST (selected terms) | 0.34 | 0.38 | 0.32 | 0.54 | 0.61 | 0.48 | 0.50 | 0.51 | 0.49 |
| DeepGOSeq (selected terms) | 0.27 | 0.20 | 0.38 | 0.38 | 0.47 | 0.32 | 0.57 | 0.61 | 0.55 |
| DeepGO (selected terms) | 0.40 | 0.45 | 0.36 | 0.50 | 0.62 | 0.42 | 0.64 | 0.66 | 0.62 |
| Organism | BP | MF | CC | ||||||
|---|---|---|---|---|---|---|---|---|---|
| AvgPr | AvgRc | AvgPr | AvgRc | AvgPr | AvgRc | ||||
| Eukaryotes | 0.36 | 0.39 | 0.34 | 0.48 | 0.63 | 0.39 | 0.63 | 0.65 | 0.62 |
| Human | 0.39 | 0.45 | 0.34 | 0.51 | 0.65 | 0.42 | 0.61 | 0.59 | 0.63 |
| Mouse | 0.37 | 0.40 | 0.34 | 0.49 | 0.61 | 0.41 | 0.60 | 0.65 | 0.56 |
| Rat | 0.36 | 0.37 | 0.35 | 0.50 | 0.63 | 0.42 | 0.55 | 0.56 | 0.54 |
| Fruit Fly | 0.36 | 0.42 | 0.32 | 0.50 | 0.62 | 0.43 | 0.57 | 0.66 | 0.49 |
| Yeast | 0.40 | 0.48 | 0.34 | 0.43 | 0.49 | 0.38 | 0.58 | 0.62 | 0.54 |
| Fission Yeast | 0.38 | 0.40 | 0.37 | 0.44 | 0.59 | 0.34 | 0.77 | 0.77 | 0.77 |
| Zebrafish | 0.37 | 0.45 | 0.31 | 0.56 | 0.59 | 0.53 | 0.66 | 0.65 | 0.67 |
| Prokaryotes | 0.36 | 0.41 | 0.32 | 0.38 | 0.45 | 0.33 | 0.66 | 0.75 | 0.60 |
| Ecoli | 0.37 | 0.42 | 0.32 | 0.38 | 0.49 | 0.31 | 0.68 | 0.79 | 0.60 |
| Mycobacterium tuberculosis | 0.37 | 0.51 | 0.29 | 0.39 | 0.51 | 0.32 | 0.69 | 0.75 | 0.63 |
| Pseudomonas aeruginosa | 0.46 | 0.57 | 0.47 | 0.31 | 0.32 | 0.37 | 0.50 | 1.00 | 0.33 |
| Bacillus subtilis | 0.38 | 0.46 | 0.32 | 0.43 | 0.42 | 0.44 | 0.43 | 1.00 | 0.28 |
4 Discussion
4.1 Multi-modal function prediction
Computational approaches to function prediction have been developed for many years [22]. One of the most basic approaches for function prediction has been the use of BLAST [5] to identify proteins with high sequence similarity and known functions, and assign the functions of the best matching protein to the protein to be characterized. Approaches for orthology-based function prediction include more comprehensive modelling of evolutionary relations, including relations between protein subdomains [14], and these can outperform simple BLAST baseline experiments. Other approaches for function prediction rely on structure prediction. It is well known that protein ternary structure strongly influences a protein’s functions, but prediction of protein structure remains a challenging computational problem [20], and even with known protein structure, functions cannot always be predicted accurately. Additionally, high-level physiological functions, such as vocalization behavior (GO:0071625), will not be predictable from a single protein’s sequence or structure alone but require complex pathways and interacting proteins, all of which contribute to the function.
While many of these approaches rely on hand-crafted features, some approaches already applied feature learning (i.e., deep learning) to parts of these data types. For example, feature learning approaches have significantly improved the prediction of transcription factor binding sites and functional impact of genomic variants [30, 3]. Here, we have extended the application of deep learning approaches in function prediction in three ways: first, we apply feature learning through the use of a CNN and embedding layer to learn a representation of protein sequence; second, we developed a deep, ontology-structured classification model that can refine features on each distinction present in the GO; and third, we use multi-modal data sources, in particular the protein structure and information from protein-protein interaction networks, within a single model. Through the multi-modal nature of our machine learning model, other types of data can be integrated within the DeepGO model as long as they can be used as input to a representation learning method that learns vector representations. For example, protein structure information, if available, could be incorporated in our model by adding another feature learning branch that generates dense, low-dimensional representations of protein structure [29] and using these as input to our hierarchical classifier.
4.2 Hierarchical classification on ontologies
In addition to the multi-modal nature of features used in DeepGO, another contribution of our work is the deep hierarchical classification model that optimizes predictive performance on whole hierarchies, accounts for class dependencies, learns features in a hierarchical manner, and is optimized jointly together with the feature learning component of our model in an end-to-end manner. Our method can be applied to other applications with a similarly structured output space and which rely on learning feature representations. In particular, we plan to apply our model for predicting disease associations of genes which are encoded using the Disease Ontology [21], or phenotype associations of genetic variants which are encoded using phenotype ontologies [15].
The advantages of our model are its potential for end-to-end learning, the global optimization, and the potential to predict any class given sufficient training data. In particular the end-to-end learning provides benefits over approaches such as structured support vector machines [25], which generally rely on hand-crafted feature vectors.
However, our model also has disadvantages. First, it needs large amounts of training data for each class; this data is readily available through the manual GO annotations that have been created for many years, but will not easily be available for other areas of application, such as predicting phenotype annotations or effects of variants. Furthermore, our model is complex and requires large computational resources for training, and therefore may not be applicable in all settings.
In the future, we intend to extend our hierarchical model in several directions. First, we plan to include more information from GO, in particular parthood relations and regulatory relations, which may provide additional information. We will also explore adding more features, such as additional types of interactions (genetic interactions, or co-expression networks), and information extracted from text.
Supplementary materials
| InterPro | InterPro Name | BP | MF | CC | ||||||
|---|---|---|---|---|---|---|---|---|---|---|
| AvgPr | AvgRc | AvgPr | AvgRc | AvgPr | AvgRc | |||||
| IPR008967 | p53-like transcription factor, DNA-binding | 0.44 | 0.48 | 0.40 | 0.63 | 0.65 | 0.61 | 0.80 | 0.78 | 0.81 |
| IPR013083 | Zinc finger, RING/FYVE/PHD-type | 0.37 | 0.38 | 0.36 | 0.50 | 0.57 | 0.45 | 0.67 | 0.66 | 0.68 |
| IPR017907 | Zinc finger, RING-type, conserved site | 0.26 | 0.33 | 0.22 | 0.39 | 0.61 | 0.28 | 0.57 | 0.54 | 0.60 |
| IPR013087 | Zinc finger C2H2-type | 0.47 | 0.44 | 0.51 | 0.58 | 0.53 | 0.64 | 0.77 | 0.75 | 0.79 |
| IPR011991 | Winged helix-turn-helix DNA-binding domain | 0.39 | 0.41 | 0.37 | 0.41 | 0.52 | 0.34 | 0.64 | 0.65 | 0.64 |
| IPR015943 | WD40/YVTN repeat-like-containing domain | 0.41 | 0.41 | 0.40 | 0.52 | 0.62 | 0.45 | 0.66 | 0.66 | 0.65 |
| IPR019775 | WD40 repeat, conserved site | 0.40 | 0.39 | 0.41 | 0.55 | 0.60 | 0.50 | 0.67 | 0.67 | 0.68 |
| IPR001680 | WD40 repeat | 0.41 | 0.41 | 0.40 | 0.53 | 0.60 | 0.48 | 0.67 | 0.68 | 0.67 |
| IPR029071 | Ubiquitin-related domain | 0.28 | 0.28 | 0.28 | 0.48 | 0.54 | 0.43 | 0.63 | 0.67 | 0.61 |
| IPR016135 | Ubiquitin-conjugating enzyme/RWD-like | 0.42 | 0.39 | 0.44 | 0.57 | 0.58 | 0.57 | 0.65 | 0.62 | 0.69 |
| IPR023313 | Ubiquitin-conjugating enzyme, active site | 0.42 | 0.39 | 0.46 | 0.59 | 0.57 | 0.61 | 0.65 | 0.59 | 0.71 |
| IPR018200 | Ubiquitin specific protease, conserved site | 0.31 | 0.32 | 0.31 | 0.46 | 0.53 | 0.40 | 0.67 | 0.67 | 0.67 |
| IPR028889 | Ubiquitin specific protease domain | 0.32 | 0.32 | 0.31 | 0.46 | 0.53 | 0.40 | 0.67 | 0.67 | 0.67 |
| IPR012336 | Thioredoxin-like fold | 0.26 | 0.28 | 0.25 | 0.48 | 0.50 | 0.47 | 0.66 | 0.64 | 0.68 |
| IPR000727 | Target SNARE coiled-coil homology domain | 0.44 | 0.46 | 0.42 | 0.56 | 0.81 | 0.43 | 0.53 | 0.73 | 0.41 |
| IPR008271 | Serine/threonine-protein kinase, active site | 0.41 | 0.42 | 0.40 | 0.63 | 0.70 | 0.57 | 0.59 | 0.61 | 0.58 |
| IPR001452 | SH3 domain | 0.35 | 0.40 | 0.31 | 0.44 | 0.55 | 0.36 | 0.55 | 0.56 | 0.54 |
| IPR000980 | SH2 domain | 0.40 | 0.43 | 0.37 | 0.53 | 0.66 | 0.44 | 0.65 | 0.66 | 0.65 |
| IPR029063 | S-adenosyl-L-methionine-dependent methyltransferase | 0.43 | 0.43 | 0.43 | 0.43 | 0.57 | 0.35 | 0.73 | 0.71 | 0.75 |
| IPR000504 | RNA recognition motif domain | 0.45 | 0.46 | 0.45 | 0.70 | 0.66 | 0.74 | 0.69 | 0.66 | 0.72 |
| IPR011009 | Protein kinase-like domain | 0.39 | 0.42 | 0.36 | 0.61 | 0.67 | 0.56 | 0.59 | 0.61 | 0.57 |
| IPR017441 | Protein kinase, ATP binding site | 0.41 | 0.45 | 0.38 | 0.64 | 0.70 | 0.60 | 0.57 | 0.59 | 0.56 |
| IPR011993 | PH domain-like | 0.38 | 0.42 | 0.34 | 0.45 | 0.61 | 0.36 | 0.55 | 0.54 | 0.57 |
| IPR027417 | P-loop containing nucleoside triphosphate hydrolase | 0.37 | 0.40 | 0.34 | 0.37 | 0.60 | 0.27 | 0.63 | 0.66 | 0.61 |
| IPR016040 | NAD(P)-binding domain | 0.37 | 0.39 | 0.35 | 0.40 | 0.59 | 0.30 | 0.73 | 0.70 | 0.75 |
| IPR020846 | Major facilitator superfamily domain | 0.44 | 0.47 | 0.41 | 0.43 | 0.65 | 0.32 | 0.61 | 0.66 | 0.57 |
| IPR032675 | Leucine-rich repeat domain, L domain-like | 0.32 | 0.45 | 0.25 | 0.47 | 0.70 | 0.36 | 0.48 | 0.55 | 0.43 |
| IPR013783 | Immunoglobulin-like fold | 0.33 | 0.36 | 0.31 | 0.44 | 0.61 | 0.34 | 0.49 | 0.53 | 0.46 |
| IPR009057 | Homeobox domain-like | 0.39 | 0.44 | 0.35 | 0.57 | 0.64 | 0.52 | 0.75 | 0.74 | 0.75 |
| IPR009071 | High mobility group box domain | 0.40 | 0.41 | 0.38 | 0.64 | 0.62 | 0.66 | 0.74 | 0.72 | 0.75 |
| IPR011992 | EF-hand domain pair | 0.35 | 0.45 | 0.28 | 0.53 | 0.62 | 0.46 | 0.63 | 0.70 | 0.57 |
| IPR013320 | Concanavalin A-like lectin/glucanase domain | 0.26 | 0.34 | 0.21 | 0.35 | 0.60 | 0.25 | 0.57 | 0.56 | 0.57 |
| IPR000008 | C2 domain | 0.33 | 0.39 | 0.29 | 0.38 | 0.54 | 0.29 | 0.50 | 0.69 | 0.39 |
| Function | Label | DeepGO | DeepGOSeq | ||
|---|---|---|---|---|---|
| ROC AUC | ROC AUC | ||||
| Biological Process | |||||
| GO:0009987 | cellular process | 0.793545 | 0.680064 | 0.793765 | 0.540680 |
| GO:0044699 | single-organism process | 0.750229 | 0.699637 | 0.738709 | 0.577044 |
| GO:0065007 | biological regulation | 0.704066 | 0.759365 | 0.677123 | 0.689570 |
| GO:0008152 | metabolic process | 0.634190 | 0.759272 | 0.544373 | 0.608695 |
| GO:0032502 | developmental process | 0.551414 | 0.620468 | 0.392551 | 0.625560 |
| GO:0050896 | response to stimulus | 0.454906 | 0.683399 | 0.393794 | 0.512953 |
| GO:0071840 | cellular component organization or biogenesis | 0.448368 | 0.703925 | 0.365183 | 0.572168 |
| GO:0051179 | localization | 0.426162 | 0.708099 | 0.311107 | 0.489611 |
| GO:0032501 | multicellular organismal process | 0.413983 | 0.531594 | 0.223127 | 0.566755 |
| GO:0040007 | growth | 0.403571 | 0.237761 | 0.074300 | 0.326924 |
| GO:0002376 | immune system process | 0.383117 | 0.337897 | 0.085541 | 0.393173 |
| GO:0022414 | reproductive process | 0.370014 | 0.434946 | 0.190107 | 0.566350 |
| GO:0051704 | multi-organism process | 0.277030 | 0.512176 | 0.169651 | 0.537286 |
| GO:0007610 | behavior | 0.262774 | 0.217460 | 0.049016 | 0.405271 |
| GO:0040011 | locomotion | 0.200238 | 0.415350 | 0.071258 | 0.537358 |
| GO:0022610 | biological adhesion | 0.153846 | 0.145779 | 0.042748 | 0.187945 |
| GO:0023052 | signaling | 0.150171 | 0.084057 | 0.017836 | 0.010441 |
| GO:0048511 | rhythmic process | 0.116883 | 0.057025 | 0.015441 | 0.027048 |
| GO:0000003 | reproduction | 0.072398 | 0.010535 | 0.013423 | 0.002335 |
| Molecular Function | |||||
| GO:0005488 | binding | 0.760884 | 0.778792 | 0.726436 | 0.714915 |
| GO:0003824 | catalytic activity | 0.738823 | 0.835322 | 0.671065 | 0.732225 |
| GO:0005215 | transporter activity | 0.636451 | 0.314824 | 0.594164 | 0.450674 |
| GO:0001071 | nucleic acid binding transcription factor activity | 0.519453 | 0.362382 | 0.388293 | 0.448391 |
| GO:0060089 | molecular transducer activity | 0.502392 | 0.350086 | 0.342723 | 0.384180 |
| GO:0004871 | signal transducer activity | 0.481572 | 0.378499 | 0.343465 | 0.496081 |
| GO:0098772 | molecular function regulator | 0.329268 | 0.334650 | 0.179612 | 0.576424 |
| GO:0016209 | antioxidant activity | 0.325926 | 0.062499 | 0.056395 | 0.025002 |
| GO:0000988 | transcription factor activity, protein binding | 0.293413 | 0.239255 | 0.176398 | 0.333591 |
| GO:0005198 | structural molecule activity | 0.242152 | 0.277404 | 0.058824 | 0.426995 |
| GO:0009055 | electron carrier activity | 0.187500 | 0.017467 | 0.027778 | 0.040924 |
| GO:0045182 | translation regulator activity | 0.070175 | 0.032282 | 0.007722 | 0.027473 |
| Cellular Component | |||||
| GO:0044464 | cell part | 0.967330 | 0.826043 | 0.966631 | 0.697060 |
| GO:0043226 | organelle | 0.761161 | 0.595503 | 0.708719 | 0.645590 |
| GO:0016020 | membrane | 0.605258 | 0.691536 | 0.500599 | 0.710984 |
| GO:0044422 | organelle part | 0.602635 | 0.630250 | 0.495917 | 0.630139 |
| GO:0044421 | extracellular region part | 0.498270 | 0.306901 | 0.165513 | 0.575960 |
| GO:0032991 | macromolecular complex | 0.465488 | 0.653815 | 0.335831 | 0.638300 |
| GO:0005576 | extracellular region | 0.452276 | 0.248848 | 0.368515 | 0.542654 |
| GO:0044425 | membrane part | 0.402873 | 0.505403 | 0.301491 | 0.580220 |
| GO:0044456 | synapse part | 0.371429 | 0.084840 | 0.020779 | 0.004898 |
| GO:0099512 | supramolecular fiber | 0.345946 | 0.098424 | 0.078240 | 0.021825 |
| GO:0045202 | synapse | 0.309524 | 0.032163 | 0.000000 | 0.000000 |
| GO:0031974 | membrane-enclosed lumen | 0.303226 | 0.199096 | 0.044743 | 0.202145 |
| GO:0031012 | extracellular matrix | 0.291971 | 0.098603 | 0.012712 | 0.014834 |
| GO:0030054 | cell junction | 0.242424 | 0.243079 | 0.062822 | 0.305787 |
| GO:0009295 | nucleoid | 0.200000 | 0.003091 | 0.000000 | 0.000000 |
| GO:0044420 | extracellular matrix component | 0.125000 | 0.001101 | 0.000000 | 0.000000 |
| GO:0044217 | other organism part | 0.111940 | 0.047736 | 0.027149 | 0.004069 |
| GO:0005623 | cell | 0.068966 | 0.022208 | 0.018182 | 0.000568 |
| GO:0044423 | virion part | 0.066158 | 0.039468 | 0.000000 | 0.000000 |
| GO:0019012 | virion | 0.029412 | 0.019432 | 0.000000 | 0.000000 |
Acknowledgements
We acknowledge use of the compute resources of the Computational Bioscience Research Center (CBRC) at King Abdullah University of Science and Technology (KAUST).
Funding
This work was supported by funding from King Abdullah University of Science and Technology (KAUST) [FCC/1/1976-08-01].
References
- 1. M. Abadi, P. Barham, J. Chen, Z. Chen, A. Davis, J. Dean, M. Devin, S. Ghemawat, G. Irving, M. Isard, M. Kudlur, J. Levenberg, R. Monga, S. Moore, D. G. Murray, B. Steiner, P. Tucker, V. Vasudevan, P. Warden, M. Wicke, Y. Yu, and X. Zheng. Tensorflow: A system for large-scale machine learning. In Proceedings of the 12th USENIX Conference on Operating Systems Design and Implementation, OSDI’16, pages 265–283, Berkeley, CA, USA, 2016. USENIX Association.
- 2. B. Alberts et al. Molecular Biology of the Cell, Fourth Edition. Garland Science, 4 edition, 2002.
- 3. B. Alipanahi, A. Delong, M. T. Weirauch, and B. J. Frey. Predicting the sequence specificities of DNA- and RNA-binding proteins by deep learning. Nature biotechnology, 33(8):831–838, Aug. 2015.
- 4. M. Alshahrani, M. A. Khan, O. Maddouri, A. R. Kinjo, N. Queralt-Rosinach, and R. Hoehndorf. Neuro-symbolic representation learning on biological knowledge graphs. Bioinformatics, 2017. advance access.
- 5. S. F. Altschul, T. L. Madden, A. A. Schäffer, J. Zhang, Z. Zhang, W. Miller, and D. J. Lipman. Gapped BLAST and PSI-BLAST: a new generation of protein database search programs. Nucleic acids research, 25(17):3389–3402, Sept. 1997.
- 6. M. Ashburner, C. A. Ball, J. A. Blake, D. Botstein, H. Butler, M. J. Cherry, A. P. Davis, K. Dolinski, S. S. Dwight, J. T. Eppig, M. A. Harris, D. P. Hill, L. I. Tarver, A. Kasarskis, S. Lewis, J. C. Matese, J. E. Richardson, M. Ringwald, G. M. Rubin, and G. Sherlock. Gene ontology: tool for the unification of biology. Nature Genetics, 25(1):25–29, May 2000.
- 7. Y. Bengio, R. Ducharme, P. Vincent, and C. Jauvin. A neural probabilistic language model. journal of machine learning research, 3(Feb):1137–1155, 2003.
- 8. Y. Bengio and Y. Lecun. Convolutional networks for images, speech, and time-series, 1995.
- 9. E. Boutet et al. UniProtKB/Swiss-Prot, the Manually Annotated Section of the UniProt KnowledgeBase: How to Use the Entry View, pages 23–54. Springer New York, New York, NY, 2016.
- 10. W. T. Clark and P. Radivojac. Information-theoretic evaluation of predicted ontological annotations. Bioinformatics, 29(13):i53, 2013.
- 11. R. Collobert, J. Weston, L. Bottou, M. Karlen, K. Kavukcuoglu, and P. Kuksa. Natural language processing (almost) from scratch. Journal of Machine Learning Research, 12(Aug):2493–2537, 2011.
- 12. M. Costanzo, B. VanderSluis, E. N. Koch, A. Baryshnikova, C. Pons, G. Tan, W. Wang, M. Usaj, J. Hanchard, S. D. Lee, V. Pelechano, E. B. Styles, M. Billmann, J. van Leeuwen, N. van Dyk, Z.-Y. Lin, E. Kuzmin, J. Nelson, J. S. Piotrowski, T. Srikumar, S. Bahr, Y. Chen, R. Deshpande, C. F. Kurat, S. C. Li, Z. Li, M. M. Usaj, H. Okada, N. Pascoe, B.-J. San Luis, S. Sharifpoor, E. Shuteriqi, S. W. Simpkins, J. Snider, H. G. Suresh, Y. Tan, H. Zhu, N. Malod-Dognin, V. Janjic, N. Przulj, O. G. Troyanskaya, I. Stagljar, T. Xia, Y. Ohya, A.-C. Gingras, B. Raught, M. Boutros, L. M. Steinmetz, C. L. Moore, A. P. Rosebrock, A. A. Caudy, C. L. Myers, B. Andrews, and C. Boone. A global genetic interaction network maps a wiring diagram of cellular function. Science, 353(6306), 2016.
- 13. R. D. Finn, T. K. Attwood, P. C. Babbitt, A. Bateman, P. Bork, A. J. Bridge, H.-Y. Chang, Z. Dosztányi, S. El-Gebali, M. Fraser, J. Gough, D. Haft, G. L. Holliday, H. Huang, X. Huang, I. Letunic, R. Lopez, S. Lu, A. Marchler-Bauer, H. Mi, J. Mistry, D. A. Natale, M. Necci, G. Nuka, C. A. Orengo, Y. Park, S. Pesseat, D. Piovesan, S. C. Potter, N. D. Rawlings, N. Redaschi, L. Richardson, C. Rivoire, A. Sangrador-Vegas, C. Sigrist, I. Sillitoe, B. Smithers, S. Squizzato, G. Sutton, N. Thanki, P. D. Thomas, S. Tosatto, C. H. Wu, I. Xenarios, L.-S. Yeh, S.-Y. Young, and A. L. Mitchell. Interpro in 2017—beyond protein family and domain annotations. Nucleic Acids Research, 45(D1):D190, 2017.
- 14. P. Gaudet, M. S. Livstone, S. E. Lewis, and P. D. Thomas. Phylogenetic-based propagation of functional annotations within the gene ontology consortium. Briefings in Bioinformatics, 12(5):449, 2011.
- 15. G. V. Gkoutos, P. N. Schofield, and R. Hoehndorf. The anatomy of phenotype ontologies: principles, properties and applications. Briefings in Bioinformatics, 2017.
- 16. X. Glorot and Y. Bengio. Understanding the difficulty of training deep feedforward neural networks. In Aistats, volume 9, pages 249–256, 2010.
- 17. G. E. Hinton. Learning distributed representations of concepts. In Proceedings of the eighth annual conference of the cognitive science society, volume 1, page 12. Amherst, MA, 1986.
- 18. J. Huerta-Cepas, D. Szklarczyk, K. Forslund, H. Cook, D. Heller, M. C. Walter, T. Rattei, D. R. Mende, S. Sunagawa, M. Kuhn, L. J. Jensen, C. von Mering, and P. Bork. eggnog 4.5: a hierarchical orthology framework with improved functional annotations for eukaryotic, prokaryotic and viral sequences. Nucleic Acids Research, 44(D1):D286, 2016.
- 19. J. Konc, M. Hodošček, M. Ogrizek, J. Trykowska Konc, and D. Janežič. Structure-based function prediction of uncharacterized protein using binding sites comparison. PLOS Computational Biology, 9(11):1–9, 11 2013.
- 20. J. Moult, K. Fidelis, A. Kryshtafovych, T. Schwede, and A. Tramontano. Critical assessment of methods of protein structure prediction (casp) — round x. Proteins: Structure, Function, and Bioinformatics, 82:1–6, 2014.
- 21. J. Osborne, J. Flatow, M. Holko, S. Lin, W. Kibbe, L. Zhu, M. Danila, G. Feng, and R. Chisholm. Annotating the human genome with disease ontology. BMC Genomics, 10(Suppl 1):S6+, 2009.
- 22. P. Radivojac, W. T. Clark, T. R. Oron, A. M. Schnoes, T. Wittkop, A. Sokolov, K. Graim, C. Funk, K. Verspoor, A. Ben-Hur, G. Pandey, J. M. Yunes, A. S. Talwalkar, S. Repo, M. L. Souza, D. Piovesan, R. Casadio, Z. Wang, J. Cheng, H. Fang, J. Gough, P. Koskinen, P. Toronen, J. Nokso-Koivisto, L. Holm, D. Cozzetto, D. W. A. Buchan, K. Bryson, D. T. Jones, B. Limaye, H. Inamdar, A. Datta, S. K. Manjari, R. Joshi, M. Chitale, D. Kihara, A. M. Lisewski, S. Erdin, E. Venner, O. Lichtarge, R. Rentzsch, H. Yang, A. E. Romero, P. Bhat, A. Paccanaro, T. Hamp, R. Kaszner, S. Seemayer, E. Vicedo, C. Schaefer, D. Achten, F. Auer, A. Boehm, T. Braun, M. Hecht, M. Heron, P. Honigschmid, T. A. Hopf, S. Kaufmann, M. Kiening, D. Krompass, C. Landerer, Y. Mahlich, M. Roos, J. Bjorne, T. Salakoski, A. Wong, H. Shatkay, F. Gatzmann, I. Sommer, M. N. Wass, M. J. E. Sternberg, N. Skunca, F. Supek, M. Bosnjak, P. Panov, S. Dzeroski, T. Smuc, Y. A. I. Kourmpetis, A. D. J. van Dijk, C. J. F. t. Braak, Y. Zhou, Q. Gong, X. Dong, W. Tian, M. Falda, P. Fontana, E. Lavezzo, B. Di Camillo, S. Toppo, L. Lan, N. Djuric, Y. Guo, S. Vucetic, A. Bairoch, M. Linial, P. C. Babbitt, S. E. Brenner, C. Orengo, B. Rost, S. D. Mooney, and I. Friedberg. A large-scale evaluation of computational protein function prediction. Nat Meth, 10(3):221–227, Jan. 2013.
- 23. P. Resnik. Semantic similarity in a taxonomy: An Information-Based measure and its application to problems of ambiguity in natural language. Journal of Artificial Intelligence Research, 11:95–130, 1999.
- 24. R. Sharan, I. Ulitsky, and R. Shamir. Network-based prediction of protein function. Molecular Systems Biology, 3(1), 2007.
- 25. A. Sokolov and A. Ben-Hur. Hierarchical classification of gene ontology terms using the gostruct method. J. Bioinformatics and Computational Biology, 8(2):357–376, 2010.
- 26. D. Szklarczyk, A. Franceschini, S. Wyder, K. Forslund, D. Heller, J. Huerta-Cepas, M. Simonovic, A. Roth, A. Santos, K. P. Tsafou, M. Kuhn, P. Bork, L. J. Jensen, and C. von Mering. String v10: protein–protein interaction networks, integrated over the tree of life. Nucleic Acids Research, 43(D1):D447, 2015.
- 27. T. Tieleman and G. Hinton. Lecture 6.5—RmsProp: Divide the gradient by a running average of its recent magnitude. COURSERA: Neural Networks for Machine Learning, 2012.
- 28. K. M. Verspoor. Roles for Text Mining in Protein Function Prediction, pages 95–108. Springer New York, New York, NY, 2014.
- 29. S. Wang, S. Sun, Z. Li, R. Zhang, and J. Xu. Accurate de novo prediction of protein contact map by ultra-deep learning model. PLOS Computational Biology, 13(1):1–34, 01 2017.
- 30. J. Zhou and O. G. Troyanskaya. Predicting effects of noncoding variants with deep learning-based sequence model. Nature Methods, 12(10):931–934, Aug. 2015.