UVI colour gradients of star-forming main sequence galaxies in CANDELS: dust extinction and star formation profiles
Abstract
This paper uses radial colour profiles to infer the distributions of dust, gas and star formation in –1.4 star-forming main sequence galaxies. We start with the standard UVJ-based method to estimate dust extinction and specific star formation rate (sSFR). By replacing with band, a new calibration method suitable for use with ACS+WFC3 data is created (i.e. UVI diagram). Using a multi-wavelength multi-aperture photometry catalogue based on CANDELS, UVI colour profiles of 1328 galaxies are stacked in stellar mass and redshift bins. The resulting colour gradients, covering a radial range of 0.2–2.0 effective radii, increase strongly with galaxy mass and with global . Colour gradient directions are nearly parallel to the Calzetti extinction vector, indicating that dust plays a more important role than stellar population variations. With our calibration, the resulting profiles fall much more slowly than stellar mass profiles over the measured radial range. sSFR gradients are nearly flat without central quenching signatures, except for , where central declines of 20–25 per cent are observed. Both sets of profiles agree well with previous radial sSFR and (continuum) measurements. They are also consistent with the sSFR profiles and, if assuming a radially constant gas-to-dust ratio, gas profiles in recent hydrodynamic models. We finally discuss the striking findings that SFR scales with stellar mass density in the inner parts of galaxies, and that dust content is high in the outer parts despite low stellar-mass surface densities there.
keywords:
galaxies: formation – galaxies: high-redshift – galaxies: photometry – galaxies: star formation – dust, extinction1 Introduction
Radial star-formation gradients are crucial for determining how stellar mass is built up in galaxies as they evolve along the star-forming main sequence (e.g., Brinchmann et al. 2004; Noeske et al. 2007; Elbaz et al. 2007), and how and where the star-forming process shuts down. UV-optical star formation measurements are typically ambiguous without proper dust corrections (e.g., Meurer et al. 1999; Kriek et al. 2009; Brammer et al. 2009; Patel et al. 2011; Murphy et al. 2011; Reddy et al. 2012), so spatially resolved star-formation and dust need to be measured together. Moreover, a significant fraction of high-redshift star-forming galaxies are very dusty, with integrated values up to 2.5 mag (Williams et al. 2009; Brammer et al. 2009; Patel et al. 2011). This means that dust could be seriously distorting our view of the structure of these galaxies as observed in optical light. Dust gradients have often been overlooked or treated to be subordinate when studying distant galaxies (e.g., Tacchella et al. 2015; Nelson et al. 2016b), which may cause non-negligible biases in conclusions about the SFR and stellar age distributions.
Radial profiles may also give insights into the gas surface density distribution, if provided with the inference of gas-to-dust ratio (e.g. Rachford et al. 2009; Bolatto et al. 2013; Sandstrom et al. 2013; Genzel et al. 2013 ). Measuring gas distributions in distant galaxies requires high angular resolution, which is not usually available at radio wavelengths. maps can substitute for gas maps until better data are available.
Only a few methods have been used so far to measure radial dust and star-formation rate (SFR) gradients in distant galaxies. The main challenge is obtaining high-resolution images at all wavelengths that each method requires. H and H images from 3D-HST grism data (Brammer et al., 2012; Momcheva et al., 2016) yield maps of H and the Balmer decrement as a function of position (Nelson et al., 2016a). However, the S/N is low, and samples have to be extensively stacked in order to obtain results. Moreover, using the popular WFC3/G141 grism, both emission lines are only available in the limited redshift range –1.5. The UV -slope method (Meurer et al., 1995, 1997; Meurer et al., 1999) measures attenuation from the excess slope of the far-UV stellar continuum but is reliable only for objects having long UV exposures, because ultraviolet photons are heavily absorbed. ALMA (the Atacama Large Millimeter/submillimeter Array) is providing new high-resolution information in the form of images of cool dust shrouding star-forming regions (e.g., Barro et al. 2016; Dunlop et al. 2017). However, the current ALMA sample pool is not large enough for statistical studies.
The most common method for dust determination at high involves fitting attenuated stellar population models to the integrated broad-band spectral energy distributions of galaxies (e.g., Kriek et al. 2009). Patel et al. (2011) show that this method is closely related to the classic versus two-colour method (UVJ) that distinguishes dust reddening from old stars. The so-called UVJ diagram has been widely utilized to identify quenched galaxies (Labbé et al., 2005; Wuyts et al., 2007; Williams et al., 2009) and also to give and the dust-corrected specific star formation rate (sSFR) values consistent with the conventional SED fitting results Fang et al. (2017, submitted). Broad-band HST images also have the advantages of high S/N, wide accessible redshift range, and large samples to permit investigating second-parameter effects.
As of this writing, only one paper, Liu et al. (2016), has used high-resolution HST optical-IR images (in through band) to measure dust and sSFR gradients in star-forming main sequence galaxies (hereafter SFMS galaxies). Their analysis uses an annular aperture photometric catalogue based on images taken as part of the CANDELS program (Cosmic Assembly Near-infrared Deep Extragalactic Legacy Survey, Grogin et al. 2011; Koekemoer et al. 2011) on HST. The study concluded that at –1.4, dust extinction is the principal cause of rest-frame colour gradients at low stellar mass (), while for high-mass galaxies () age gradients are also a factor.
The present paper is built upon the same annular photometric catalogue used by Liu et al. (2016) but with two differences. First, Liu et al. (2016) used the fast spectral fitting program (Kriek et al., 2009) to obtain and sSFR in each galaxy annulus. We instead base our results on the same UVJ method as used by Fang et al. (2017, submitted), which has the advantage of showing the raw data directly on the UVJ plane and providing a simple intuitive geometric interpretation of them. Second, the SED fits of Liu et al. (2016) lacked long-wavelength (IRAC) data points because high-resolution HST imaging ends at band. Because the effects of omitting IRAC from SED fitting are not well known, we prefer to use a method that is more securely based on IRAC data. The UVJ calibration based on integrated galaxy photometry including IRAC, meets this need as well.
However, reproducing UVJ requires an indirect approach for because rest-frame band has shifted to the observed band even at . We therefore first verify that versus diagram (hereafter ) works nearly as well as UVJ for deriving and sSFR and then synthesize usable values from available HST through imaging. This proves to be possible all the way out to because of the simple, log-linear slope of galaxy continua near 10,000 Å, which generally lack strong spectral features (except for emission in strongly star-forming galaxies; see Appendix 15). The UVJ calibrations from Fang et al. (2017, submitted) for and sSFR are then transferred to the UVI plane in a manner that ensures no bias.
The organization of this paper is as follows. First we stack raw galaxy colour gradients in stellar mass and redshift bins and study their behavior on the UVI diagram. Basic features such as the raw colour-gradient directions and correlations with mass and redshift are revealed. The UVJ-based calibrations are then utilized to convert raw UVI colours into values of and sSFR, which are used to address the following questions:
-
1.
What is the average radial profile and how does it vary with stellar mass, redshift, and inclination? How does dust surface density vary radially in comparison to stellar mass?
-
2.
What do dust-corrected sSFR profiles look like? Are there signs of bulge quenching at small radii? How are these results affected by uncertainties in the stellar population models and the attenuation law?
-
3.
How do our results compare to previous measurements and to recent hydrodynamic models of galaxy formation?
The basic calibrations for both and sSFR in this work were originally developed by Fang et al. (2017, submitted). The values used are based on average fits by different authors to CANDELS photometry, which have been tabulated in Santini et al. (2015). They amount to running SED fitting codes (like fast, Kriek et al. 2009) on integrated galaxy SEDs from through IRAC passbands. The sSFR values used Fang et al. (2017, submitted) technically differ from the SED fitting values, but the differences are small and can be ignored. The SED fits assume declining -models and a foreground-screen Calzetti attenuation law (Calzetti et al., 1994, 2000), and most assume solar-metallicity. We collectively refer to this SED-fitted body of data as the ‘conventional method’ for finding and sSFR. It is possible that some of our conclusions depend on this particular recipe, and a critical discussion is given in Section 8.
A flat CDM cosmology model with and is adopted throughout this paper, and the Hubble constant is set to be 70 km s-1 Mpc-1. The letter represents the radial distance to galaxy centres along the semi-major axis unless otherwise stated. SMA represents the size of the effective radius along the galaxy semi-major axis.
| Cut | GOODS-South | UDS | Total |
|---|---|---|---|
| Full catalogue | 34930 (100%) | 35922 (100%) | 70852 (100%) |
| 8565 (24.52%) | 10077 (28.05%) | 18642 (26.31%) | |
| 8307 (23.78%) | 9686 (26.96%) | 17993 (25.40%) | |
| Photometry | 8091 (23.16%) | 9012 (25.09%) | 17103 (24.14%) |
| 4188 (11.99%) | 4671 (13.00%) | 8859 (12.50%) | |
| 2477 (7.09%) | 2725 (7.59%) | 5202 (7.34%) | |
| galfit | 2204 (6.31%) | 2505 (6.97%) | 4709 (6.65%) |
| Aperture photometry available | 1984 (5.68%) | 1895 (5.28%) | 3879 (5.47%) |
| dex | 1513 (4.33%) | 1428 (3.98%) | 2941 (4.15%) |
| 797 (2.28%) | 773 (2.15%) | 1570 (2.22%) | |
| 670 (1.92%) | 658 (1.83%) | 1328 (1.87%) |
2 Data and Sample Selection
Our work is based on two of the five CANDELS fields, GOODS-South and UDS, for which photometry and galaxy physical parameters have been well studied and compiled by the CANDELS team. We make use of the multi-wavelength photometry catalogues in GOODS-S and UDS (Guo et al., 2013; Galametz et al., 2013), the corresponding physical parameter catalogue (Santini et al., 2015), the morphology structure catalogue (van der Wel et al., 2012), the SFR and catalogue constructed by Fang et al. (2017, submitted), and the multi-aperture photometry catalogue currently under construction by Liu et al. (in prep.; see Liu et al. 2016 for more details).
Photometry measurements of the two fields are provided by Guo et al. (2013) and Galametz et al. (2013). PSF-matching has been applied to these multi-wavelength photometry data using the tfit routine (Laidler et al., 2007). Redshifts are obtained from a joint database of photometric redshifts and spectroscopy redshifts. Spectroscopy redshifts (Morris et al., 2015) are adopted in preference if available, and the median photometric redshifts deduced from 11 different photo- fitting methods are used otherwise (Dahlen et al., 2013). The redshift values are used as input to obtain integrated rest-frame magnitudes from to band using the eazy code (Brammer et al., 2008) and the templates from Muzzin et al. (2013), as implemented by the CANDELS team collaboration (D. Kocevski, S. Wuyts and G. Barro). galfit fitting results (Peng et al., 2002) are available in the WFC3/F160W band, including the axis ratio , Sérsic index from the single-component fitting, and the half-light radius along the semi-major axis (SMA) (van der Wel et al., 2012).
For stellar masses, we adopt the CANDELS ‘reference’ mass, which is the median of all SED fitting results after being scaled to the Chabrier IMF (Chabrier, 2003), to lessen potential biases caused by any specific choice of SED fitting assumptions (Santini et al., 2015). The stellar mass obtained has a nominal scatter of around 0.1 dex. See Santini et al. (2015) for details.
The galaxy-integrated sSFR and values are adopted from Fang et al. (2017, submitted). Global visual dust attenuation is the median value of five different modeling results from the physical parameter catalogue (Santini et al., 2015), 2aτ, 2dτ, 12aτ, 13aτ, and 14aτ. These all follow the conventional model, i.e., an exponentially declining star formation history (SFH) and the Calzetti dust extinction law applied as foreground screen. Three of the five methods have fixed stellar metallicity to solar abundance (2aτ, 13aτ, 14aτ). Among the five methods, the 2aτ value is seen to resemble most closely to the median value, with the smallest scatter of mag and no systematic deviation detected. Therefore we equate the median values used in this work as an equivalent outcome of solar metallicity SED models.
Star formation rates (SFR) are the same as derived by Fang et al. (2017, submitted) based on the luminosity at 2800 Å, after the correction of dust extinction at 2800 Å (Calzetti et al., 2000; Kennicutt & Evans, 2012):
| (1) |
Fang et al. (2017, submitted) tested the robustness of this method by comparing the sSFR values with those derived from UV and far-IR photometry and showed the two values are consistent in a broad range, with typical scatter of around 0.2 dex.
The spatially resolved photometry is retrieved from the multi-band, multi-aperture photometry catalogue of CANDELS (Liu et al., in prep.), which measures the annulus-averaged radial surface brightness profiles in HST/WFC3 bands and HST/ACS bands. In brief, the aperture photometry is conducted after oversampling galaxy images in a certain band using iraf and subtracting the sky background. For each galaxy, we always use elliptical annuli to run the aperture photometry with fixed shape parameters, including ellipticity, the position angle and the center position, which are determined from fitting WFC3/F160W images with galfit. Annulus radii along the ellipse major axis start with 0.04″, expanding outward in logarithmic steps of 0.1 dex, and end when the surface brightness is lower than 26 mag/arcsec2. Therefore at 2 effective radii (1.2″) of a typical galaxy in our sample, the separation between two consecutive apertures is around 5 times the drizzeld WFC3 pixel size (0.06″), allowing the radial flux profile to be determined by averaging a few tens of pixels. This procedure substantially reduces photometry noise at galaxy outskirts.
To maximize the sample size and obtain accurate rest-frame colours at the same time, we use the photometry in two ACS bands (F606W and F814W) and two WFC3 bands (F125W and F160W) simultaneously, because they are the only four bands that are well covered both in UDS and GOODS-South. In order to avoid spurious colour gradients caused by the PSF (point spread function) mismatches among different bands, all images are convolved to match the resolution of WFC3/F160W (H band), which has a PSF FWHM of 0.18″. Rest-frame and colours from to are then derived from the four observed-frame bands using the empirical fitting relations derived Appendix 15.
A total of 1328 SFMS galaxies from the GOODS-South and UDS fields that satisfy the following criteria are selected. Sample sizes after each cut are listed in Table 1.
-
1.
WFC3/F160W band magnitude brighter than 24.5 mag.
-
2.
SExtractor (Bertin & Arnouts, 1996) parameter CLASS_STAR smaller than 0.9 to remove stars.
-
3.
Both galfit and SExtractor flags equal to zero. This ensures that the WFC3/F160W images are not contaminated by star spikes, haloes, image edges, or artifacts and that the galfit fit is good (refer to van der Wel et al. 2012 for details).
-
4.
Galaxy stellar mass within the range of –, and –. For galaxies beyond , the rest-frame colour index cannot be obtained accurately due to a lack of photometry information redder than the WFC3/F160W band (see Appendix 15).
-
5.
Aperture photometry available in the four bands, ACS/F606W, ACS/F814W, WFC3/F125W, and WFC3/F160W.
-
6.
Green-valley galaxies and quiescent galaxies are removed according to the positions on the sSFR- plane. Following Fang et al. (2017, submitted), linear fittings of the sSFR- relation are conducted in three redshift ranges, , and , using a sample of galaxies selected by criteria 1, 2, 3 itemized above and . The residual relative to these relations, , must be above dex in order to select only SFMS galaxies.
-
7.
Axis ratio , where and are the effective radii along the galaxy projected semi-major and semi-minor axes, as obtained from the WFC3/F160W galfit fitting (van der Wel et al., 2012). This makes appropriate correction of PSF-smearing effect in the following sections possible, and also reduces reddening uncertainties by selecting out objects with high inclination (attenuation). We are aware that the axis ratio cut can seriously bias the sample towards intrinsically prolate or oblate objects, if our sample contains comparable amounts of these two geometry types and their ratio quickly varies with mass and redshift. However, as shown by van der Wel et al. (2014b), the prolate objects are only common (>20 per cent) in the mass-redshift range of , (named as “prolate range” hereafter for convenience). In the other ranges where our selected galaxies lie, the prolate population is <20 per cent and the predicted variation of prolate galaxy fraction with mass and redshift is only around ten per cent. Therefore the considered selection bias should be modest in the “prolate range” and negligible for the other ranges. When the cut is made to the “prolate range” sample, 48.5 per cent of the galaxies are selected, a few per cents smaller than the percentage (53.4 per cent) selected to the whole sample, which can be explained by that slightly more prolate objects with small axis ratio are being weeded out compared with the whole sample. We stress that accurate modelling of 3-D geometry parameters is helpful to fully quantify the effect in future works.
-
8.
Effective radius along the semi-major axis, SMA, in the WFC3/F160W band is larger than the typical F160W PSF size 0.18″(3 pixels), to make sure that the colour gradients are resolved.
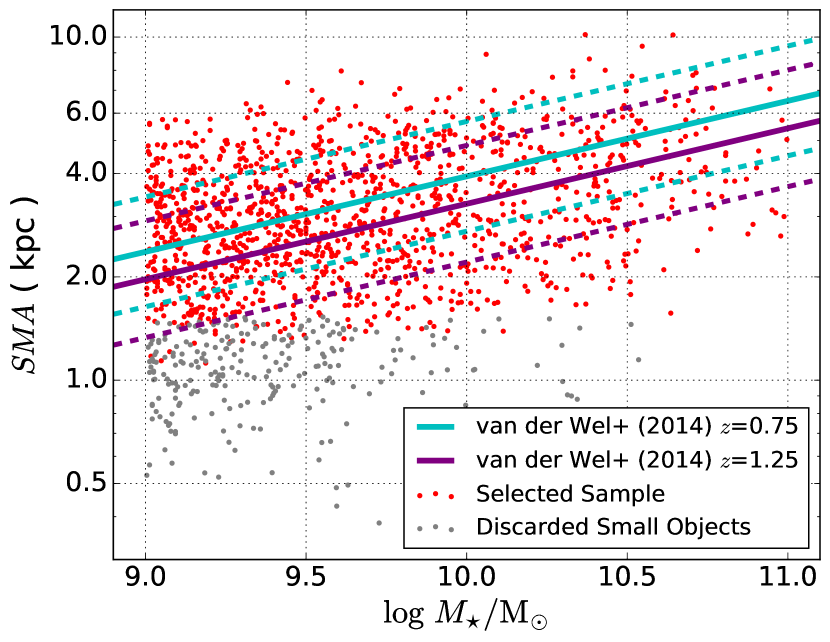
The final sample distribution on the F160W size-mass plane is plotted as the red points in Fig. 1. Galaxies satisfying criteria 1–4 and 6–8 but having angular sizes smaller than required by criterion 5 are plotted as gray points. The angular size of SMA spans from 0.30″to 0.85″, which is several times the PSF FWHM size, and the corresponding SMAs are 2.5–5.5 kpc. As seen from the plot, the angular size cut deletes more low-mass galaxies, but almost all of the discarded objects lie beyond the range of the size-mass relation. This lack of sample completeness in our work cannot be avoided given the limited available resolution.
3 The UVI colour diagram
Two-colour diagrams are frequently used in analyzing the character of stellar population ages and dust extinctions. A common example is rest-frame versus (e.g., Labbé et al. 2005; Wuyts et al. 2007; Williams et al. 2009; Patel et al. 2011). However, our reddest data being limited to 1.6 µm (WFC/F160W), rest-frame band photometry becomes increasingly uncertain beyond . We therefore explore the possibility of replacing with a bluer rest-frame band to construct an alternative two-colour diagram.
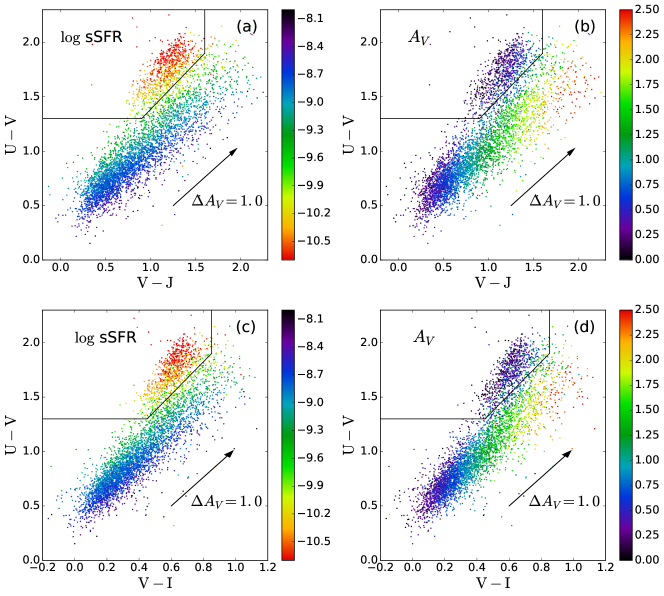
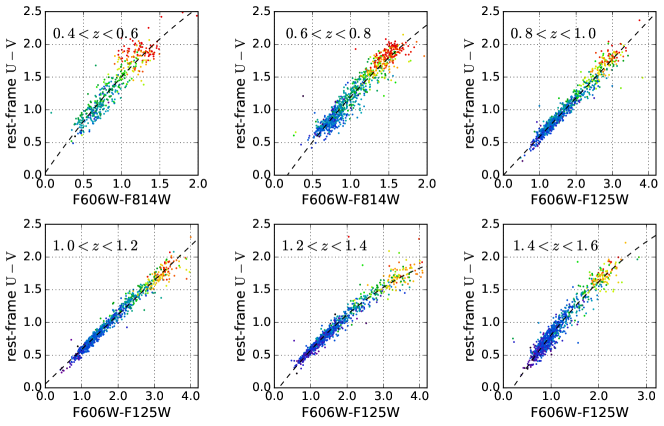
Fig. 2 shows the distribution of a selection of galaxies on the versus plane (hereafter UVI), as well as in UVJ for comparison. All CANDELS GOODS-South and UDS galaxies with , , and filtered by criteria 1, 2, 3 in Section 2 are shown. Each point in the plot represents the integrated colours of an individual galaxy. The colour codings show the distribution patterns of sSFR and in UVI and UVJ, the latter initially presented by Fang et al. (2017, submitted) and reproduced here for reference. It is seen that reproduces all the main features of UVJ, including the quenched region and the same distinctive patterns of sSFR and stripes.
The agreement between UVI and UVJ is consistent with the smooth slope and small cosmic scatter of galaxy SEDs in the -- range. A drawback of the substitution is that UVI has smaller dynamic range and thus places somewhat poorer constraints on sSFR and than UVJ. The separation between the quenched population and the star-forming region, as well as the width of SFMS ridge-line, is therefore smaller in the UVI diagram than in UVJ. However we will estimate the associated uncertainty in Section 5 below and validate that UVI is a satisfactory substitute for UVJ.
Fig. 2 shows boundary lines that separate quenched galaxies from the SFMS population. The boundary lines in UVJ are the same as those adopted for by Williams et al. (2009) with the redshift dependence neglected in this work for simplicity. For UVI, the boundary lines are determined by visually confirming that objects on the UVJ boundaries also lie on the boundary lines in UVI.
4 UVI colour gradients
4.1 Sample binning, PSF smearing effect, and the stacking methods
Since galaxies evolve with mass and redshift, we divide the sample into four stellar mass bins, –, –, –, and –, and four redshift bins, 0.4–0.8, 0.8–1.0, 1.0–1.2, and 1.2–1.4 and stack galaxy colour profiles in the same mass-redshift bin to reduce photometry uncertainty and cosmic scatter. However, there are two challenges to be considered. First, the light smearing effect caused by PSF on colour gradients must be evaluated carefully, especially within 0.18″(3 times the drizzled WFC3 pixel size). Second, even in the same mass-redshift bin, galaxies can have non-negligible physical size scatter, which may make the derived average colour profiles seriously dependent on the choice of the corresponding positions to overlay the profiles. Our strategy to deal with these is to generate and compare multiple versions of colour gradients using different sample stacking methods (stacking galaxy colour profiles on a fixed size scale in arcsec, versus stacking colour profiles after individual galaxy profiles are normalised by their effective radii), and different treatments of PSF smearing effect (no treatment versus correction based on a variety of prior models). We also do not calculate colour gradients inside 0.2 effective SMA (around 0.7 kpc, or 0.06″), where PSF smearing is overwhelmingly important.
Since the photometry in all bands has been convolved to match the WFC3/F160W resolution (Guo et al. 2013), any influence caused by different PSF sizes of HST filters has been eliminated. All galaxies receive the same statistical weight in a stack. The maximum radial extent to measure colour gradients is set to 2 times the SMA, where reliable photometry is still available.
4.2 Colour gradients uncorrected for beam smearing and stacked by radius scaled to SMA
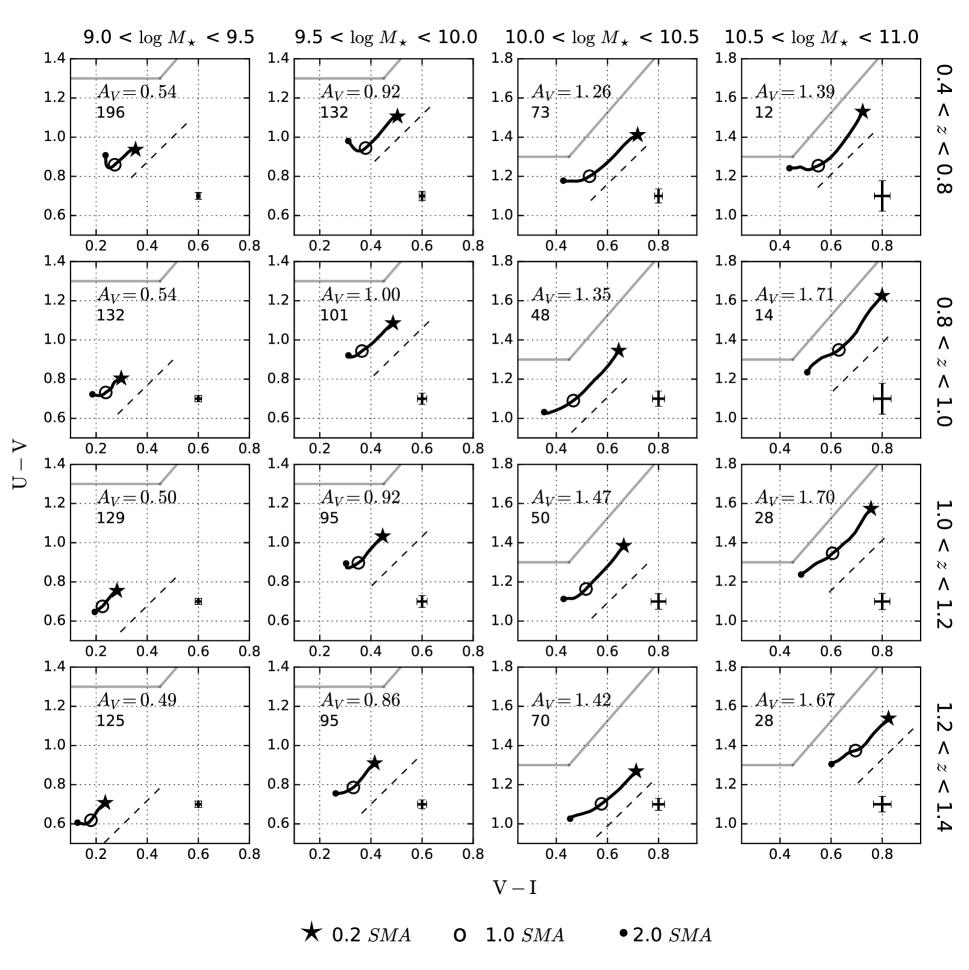
This subsection shows raw stacked colour gradients without any beam-smearing correction. First, we scale the radial colour profiles of each individual galaxy by its SMA (effective radius along the galaxy major axis), by interpolating between the apertures as described in Section 2. Then these scaled colour profiles are stacked together to produce the average profiles as shown in Fig. 3.
The grid of panels in Fig. 3 shows the shapes of the stacked colour trajectories in UVI-space as a function of mass and redshift. Each panel is a UVI diagram, and the black lines are the paths taken by the colours in going from the innermost radius (upper right) to the outermost radius (lower left). The three symbols indicate local colours at 0.2 SMA (star), 1 SMA (open circle), and 2 SMA (dot). The direction of dust reddening by the Calzetti law is shown as the dashed lines.
The main feature of this figure is that gradient trajectories approximately follow the reddening vector, which indicates that most of the gradients are caused by dust variations and that sSFR is nearly constant with radius. This conclusion is unchanged under beam-smearing correction and stacking by radius rather than scaled radius, as shown in the next section.
4.3 Colour gradients stacked based on angular distance and beam-smearing correction
Next, we turn to another stacking method of colour profiles and then evaluate and correct the beam-smearing effects caused by the PSF.
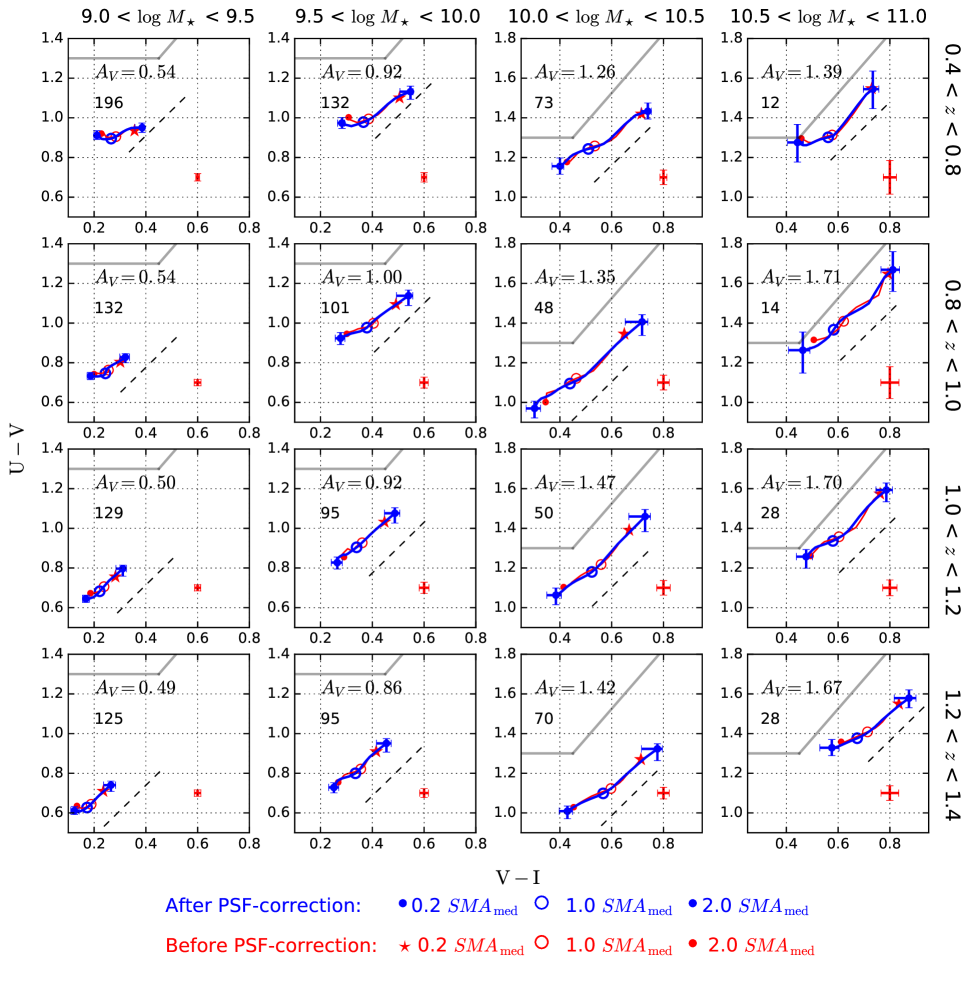
To start with, galaxy colour profiles are stacked together based on the angular distance in arcsec to their centers, instead of the nomalisation used in Section 4.2. The resultant colour gradients are shown as red curves in Fig. 4. This stacking method ensures that the stacked profiles have a well-defined angular resolution at each radius, which is necessary to conduct the following PSF correction. We are aware that this method holds out risk that different galaxy parts are stacked together for galaxies with different angular sizes. However, fortunately when comparing these colour profiles (red curves in Fig. 4) with those stacked by scaled radii (Fig. 3), no significant difference is found, showing that this issue does not alter our principal conclusions.
Regarding the PSF smearing effect, the observed shapes of galaxy colour profiles can be different from the intrinsic ones even though all the corresponding band images have been PSF-matched. Qualitatively, for a galaxy with a light distribution that is more centrally peaked in one band than another, more light will be smeared out from the centre of that band when convolved by the same PSF function. Because the presence of colour gradients is indicating that the light in one band is indeed more centrally concentrated than in another band, the PSF smearing effect across different bands will cause the observed colour gradients to be smaller than the intrinsic ones.
We model and correct this effect following Szomoru et al. (2010). This method requires a prior model of the intrinsic light distribution, and the final light profiles are generated by adding the residual from fitting the observed light profiles with the PSF-convolved model on to the prior profiles. Although a prior assumption is always used, it has been shown that the final result is insensitive to the choice of prior, and the method also avoids false features caused by noise, as can occur in the direct deconvolution method.
To implement this, the redder-band image of each filter pair is modeled as a single Sérsic component. The median values of the Sérsic indexes, effective radii, and ellipticities of the galaxies in the stack, as retrieved from the CANDELS WFC3/F160W morphology catalogue (van der Wel et al., 2012), are used to construct this model. The bluer-band image is modeled by adding various prior colour gradient components on to the red image. These prior gradients are assumed to be proportional to except for the central regions, with slope values obtained from fitting the observed colour gradients between 0.6 SMA and 1.5 SMA, where beam-smearing effects are small. Flat truncation or linear interpolation of the prior colour gradients is adopted within 0.05/0.1/0.2/0.3/0.4/0.5/0.6 SMA to avoid unphysical logarithmic divergence at the centre and to cover all physically probable conditions. The Szomoru et al. (2010) procedure is then applied to all the prior models, and the multiple colour gradients are generated based on different priors. For a certain mass-redshift bin, the median values of these generated curves are taken as the our PSF-corrected colour profiles, while the maximum deviations from the medians are retained as PSF-correction uncertainties.
For the purpose of demonstration, an example from the stack with and is shown in Fig. 5. As shown in the two upper panels of Fig. 5, the corrected profiles are systematically redder in the centre and mildly bluer in the outskirts.
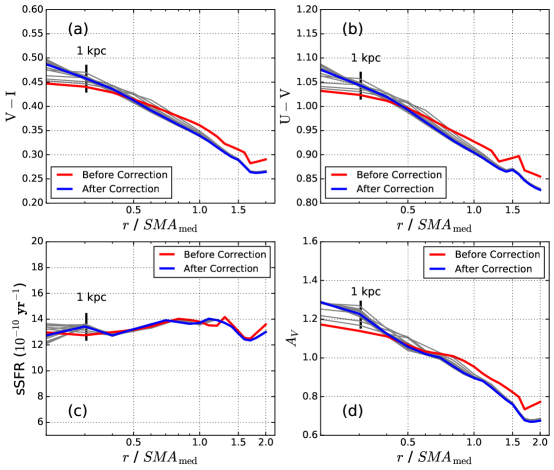
The resultant PSF-corrected colour profiles for all redshift and mass bins are plotted as the blue curves in Fig. 4, with error bars indicating the combined uncertainty of the PSF-correction and the standard deviation of the stacked profile. As expected, the PSF-correction stretches the length of colour gradients on the UVI diagram by making galaxy colours redder in the centre and bluer in the outskirts. However, the overall effect of PSF-correction is not large.
4.4 Basic findings on stacked colour gradients
By comparing the overplotted red and blue curves in Fig. 4 with Fig. 3, we are able to capture certain basic features in common. These features, as we have shown in Section 4.2 and Section 4.3, are robust against different treatments of PSF-correction and galaxy-radius stacking. They are the foundation for drawing further scientific conclusions in the rest of this article.
First, the most striking aspect of the figures is that the gradient trajectories are all roughly parallel to the reddening vector (except for small upturns near 2 SMA, which are discussed below).
Second, all points lie well within the star-forming region on the UVI plane, indicating that on average the centres of galaxies are not observed to have quenched at our raw resolution of , which is typically 1.5 kpc at . This can be extended down to 0.2 SMA ( kpc) using PSF-correction. Fig. 5 demonstrated that PSF-corrections are small even at this radius, indicating that this region is well resolved. Nearby bulges are roughly of this size ( kpc, Gadotti 2009; González Delgado et al. 2015, 2016). If distant bulges have the same radial extent as local bulges and if they are fully quenched at the epochs we are observing them, their centres should lie inside the quenched region of the UVI diagram, but this is not seen, either for the raw gradients or the corrected gradients. Instead, central PSF-corrections tend to extend a bit further inward the dust trends seen at larger radii.
Third, we find that the magnitude of the colour gradients increases significantly with mass at low ranges, especially from – to –. But from – to –, the strength of colour gradients tends to saturate. Considering that is observed to be near the pivot mass of disk settling at intermediate and high redshifts (Kassin et al., 2012; Simons et al., 2016), the strength of colour gradients, as an indicator of the radial variation of underlining stellar population or dust/ISM distribution, may be sensitive to and correlated with disk formation. Elongation along the Calzetti vector increases with both mass and global at fixed redshift, but the increases with time at fixed mass are small. This is in agreement with previous work showing that dust content increases strongly with mass (e.g., Reddy et al. 2006, 2010; Pannella et al. 2009). To first order, is well parametrized by mass alone in our data. Nevertheless, we will show in Fig. 7 that massive galaxies arriving at a given mass at late times (e.g., – and –0.8) have slightly less for their mass, perhaps reflecting a loss of ISM as star formation shuts down.
The fourth noteworthy feature of Fig. 3 and Fig. 4 is the smoothness of the gradient trajectories. The number of galaxies averaged in each bin is evidently adequate to smooth out the measurement noise in the individual profiles, along with the effects of any local structures like clumps (e.g., Elmegreen & Elmegreen 2005; Wuyts et al. 2012; Guo et al. 2012, 2015). Assuming that the underlying calibration of UVI to dust and star formation is also smooth, this implies that the resulting radial curves of sSFR and will also be smooth. This proves to be the case, as will be shown in Section 6.
The fifth feature of Fig. 3 and Fig. 4 is the slight upturns in the paths that are visible in the extreme outer parts of galaxies near 2 SMA. Closer inspection shows these upturns to be about equally prominent at all masses but to be stronger at late times (the lowest mass bin at lowest redshift is particularly strongly affected). The origin of these upturns is unknown. Probable interpretations can be that galaxies are surrounded by old stars that were scattered from central parts due to dynamical migration (Roškar et al., 2008) or accreted via minor mergers. Similar age or colour gradient turnover have been noted for local galaxies (e.g. Bakos et al. 2008; Radburn-Smith et al. 2012; D’Souza et al. 2014; Zheng et al. 2015). Also Wuyts et al. (2012) finds disks with older stellar ages in the outskirts at . The direction of the upturn indicates older stars, and this will be evident as a downturn in sSFR at the outer radii of our galaxies at late times. The existence of these upturns and their uncertain interpretation is the reason why we have truncated our analysis at 2 SMA. Further consideration is beyond the scope of this paper.
5 and sSFR calibrations
We turn now to the task of converting raw UVI colours into values of and sSFR. As shown in Fig. 2, galaxies on the UVI diagram exhibit clear sSFR and patterns with small scatter. These ordered patterns make it possible to deduce sSFR and values from the and of a whole galaxy or of any part of a galaxy.
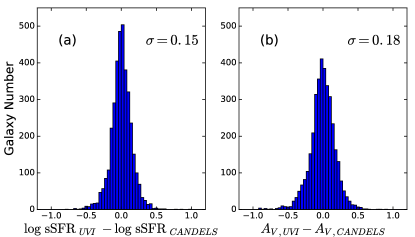
We start by creating a map of sSFR and in the UVI plane. We do this by plotting integrated UVI colours as in Fig. 2c and Fig. 2d, and dividing the resulting distribution into multiple mag rectangles. In each rectangle we calculate the median CANDELS catalogue values of sSFR and and assign them to the centre of the rectangle. In this way, maps of sSFR map and are generated based on the integrated properties of the galaxies. Then, given any position on the UVI plane, the corresponding sSFR and values are obtained by linearly interpolating among the nearby rectangle centres.
To assess the results, we derive a set of sSFR and values for all galaxies using integrated UVI colours as in Fig. 2 ( and ) and compare them to the original values in the CANDELS catalogue ( and ). Histograms of the difference between the two set of parameters are shown in Fig. 6. As annotated in the figure, sSFR and can be constrained using UVI with an rms accuracy of 0.15 dex and 0.18 mag respectively.
6 Radial profiles
6.1 Radial profiles
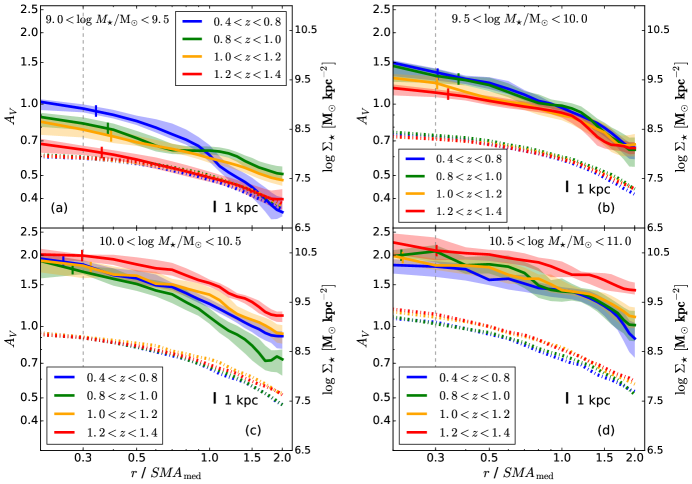
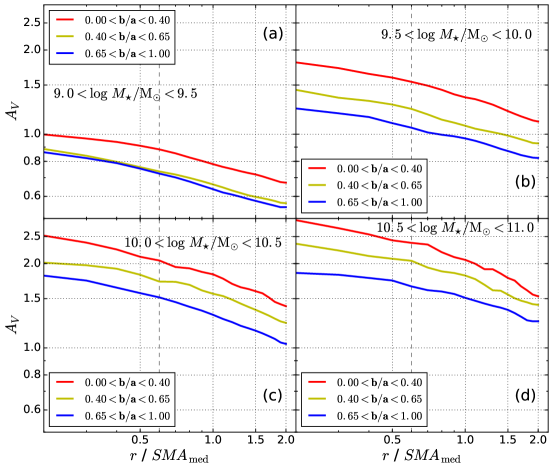
Using the calibration method developed in Section 5, the PSF-corrected UVI colour profiles (blue curves in Fig. 4) are converted to radial profiles, as shown in Fig. 7. Radial distances in arc seconds are rescaled to SMA units using the median angular size of the stacked galaxies in each mass-redshift bin. Coloured vertical line segments indicate the median physical position of 1 kpc. Shadowed regions account for the scatter caused by the stacked colour profile uncertainties (i.e., standard deviation of the mean) combined in quadrature with the PSF correction uncertainties shown in Fig. 5.
Fig. 7 bins galaxies by mass and colour-codes the profiles by redshift. A steady increase of the attenuation value, as well as the size of the radial gradient, with stellar mass at fixed redshift is observed. In contrast, redshift trends are much milder. Note that the conventional analysis method we are using for and sSFR predicts dust attenuation values as high as – mag in galaxy centres and up to 1.5 mag at the outskirts. These high values, if real, mean that our optical view of SFMS galaxy structure is highly distorted by dust and that recovering accurate galaxy structural parameters depends on an accurate dust correction. We return to this topic in Section 7.
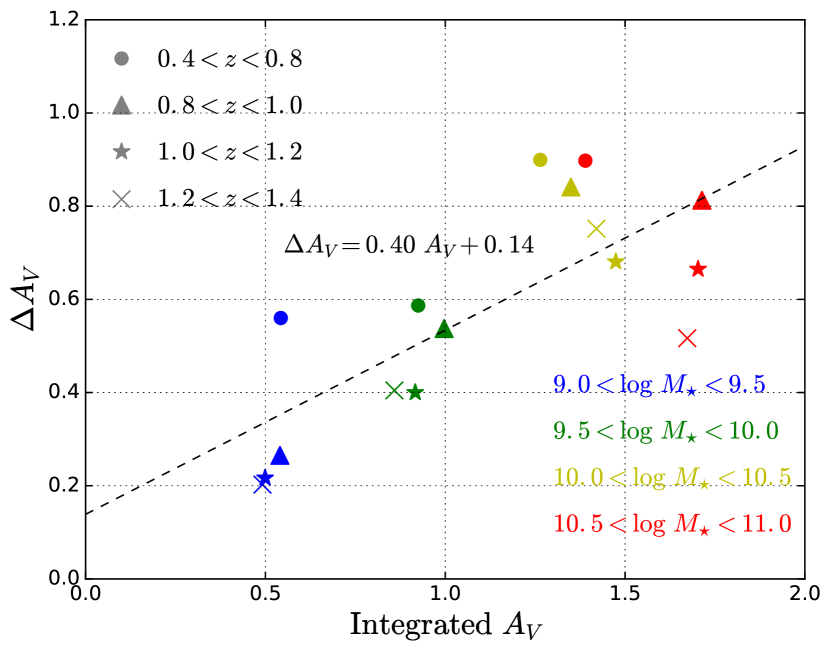
A measure of the gradient size, , is plotted versus galaxy global in Fig. 8. is defined as the difference in between 0.2 SMA and 2.0 SMA. The points are colour-coded by mass and redshift, and it is seen that a straight line is tolerable fit with small Y intercept. This rough proportionality indicates a consistent pattern in vs. radius that is repeated from bin to bin. Over the measured radii, averages about 0.4 , and also increases slightly with time. Aside from this latter point, the rough proportionality means that the development of dust inhomogeneity comes along with dust production in a concordant fashion.
However, a major new finding in Fig. 7 is the ratio of to stellar mass surface density, . Median profiles are shown as the dotted lines in Fig. 7 based on stellar mass profiles obtained by Liu et al. (in prep.) from fitting fast (Kriek et al., 2009) to the multi-band aperture photometry profiles. It is seen that stellar mass typically falls by a factor of 10–20 from centre to edge whereas , which is strictly proportional to dust surface density under the foreground screen assumption, drops by a factor of 2. The dust to stellar mass ratio therefore increases outward by roughly one dex. This is perhaps unforeseen behavior and is discussed further in Section 8.1.
6.2 Radial sSFR profiles
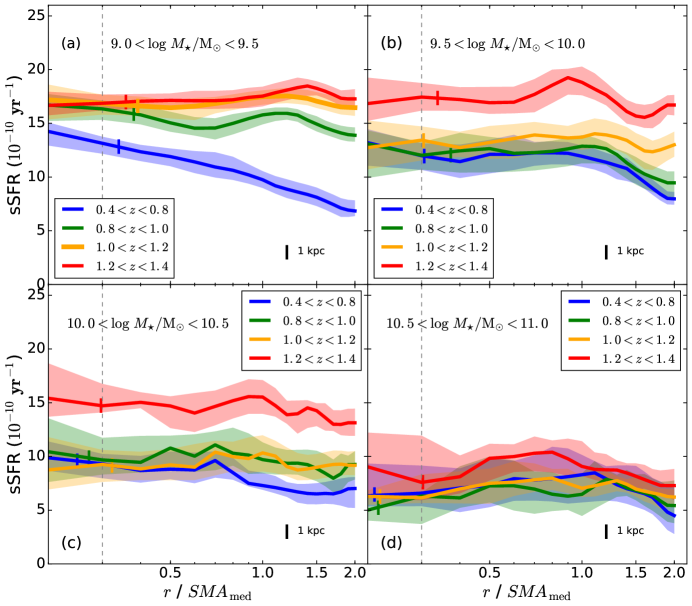
Radial sSFR profiles accompanying the profiles in Fig. 7 are plotted in Fig. 9. The profiles of high-redshift galaxies are seen to lie above those of low-redshift galaxies, reflecting the overall drop in the level of the SFMS since (e.g., Noeske et al. 2007; Whitaker et al. 2012; Speagle et al. 2014). More striking is the small variation in sSFR with radius. With the exception of a single deviant curve at small masses and late times, sSFR profiles below are flat. This was foreshadowed by the UVI gradient vectors in Fig. 3 and Fig. 4, and is also consistent with the results of Liu et al. (2016). These galaxies are evidently forming stars at virtually the same relative rate at all radii. In the most massive bin above , a central drop of around 20 per cent is seen, which may indicate the onset of central star-formation quenching associated with bulge formation in massive galaxies. This is discussed further in Section 8.2.
7 Comparison with two recent works
7.1 profiles
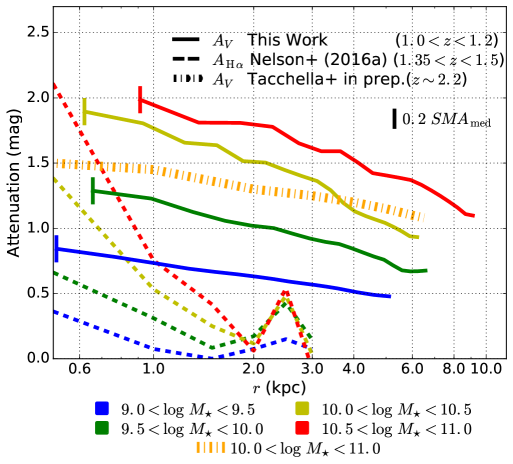
As noted, relatively few previous studies have presented radial profile measurements of or sSFR in the manner shown in this paper. However, two recent studies have appeared that permit a direct comparison. Fig. 10 compares our profiles to Balmer-based dust profiles using from Nelson et al. (2016a), and to UV-based dust profiles using the slope of the UV continuum (Meurer et al., 1999), from Tacchella et al. (2017). The Balmer decrement results have been interpolated to fit the same stellar mass bins as in our work; they measure dust extinction towards star-forming regions. Our UVI method, based on fits to optical/near-IR SEDs, measures continuum extinction to the average star. The UV- method measures the extinction of the young-star stellar continuum and thus might be expected to be intermediate between the other two.
In fact, Fig. 10 shows that the UV- method and the UVI method yield similar radial trends in , with highest extinction values at centres and mild decreases towards the galaxy outskirts by about a factor of 2 at 2 SMA. A similar decline was found by Wuyts et al. (2012), who also studied star-forming galaxies at and , though no explicit radial profiles were shown. These mild trends also agree with local galaxies observed by Wild et al. (2011), where continuum extinction was found to drop by only around 20–30 per cent from 0.35 to 1 Petrosian radius, more strongly in high-SFR galaxies.
In contrast, there is a strong discrepancy between both continuum methods in Fig. 10 and the results from Nelson et al. (2016a), which exhibit sharp peaks in galaxy centres but nearly transparent profiles beyond 2 kpc. This radial trend is very much steeper than the slow fall-offs in both continuum methods. A popular two-component dust model (e.g., Calzetti et al. 2000; Charlot & Fall 2000; Wild et al. 2011) permits to be higher than the continuum attenuation due to extra attenuation toward star-forming regions. However, measurements of both nearby galaxies and distant galaxies out to consistently find (e.g., Calzetti et al. 2000; Wild et al. 2011; Wuyts et al. 2013), at variance with the much larger ratio variations in Fig. 10. Taking into account potential systematic uncertainties may mitigate this somewhat, such as [N ii] contamination, inappropriate SFH assumptions, and different stacking methods. However, it is highly unlikely that the full discrepancy can be explained by tweaks to the conventional picture.
More likely, if low in the outer parts of distant galaxies holds up with further data, this will signal a breakdown in our current geometrical model of dust, which is putting dust of all types into foreground screens. More plausibly, dust and gas are mixed with stars, but in different ways for different stellar populations. The foreground dust model for H regions may also be wrong; the geometry of dust in H ii regions is complex and varies radially within the galaxy in at least one nearby object (Liu et al., 2013). Moreover, a major difference between local galaxies and distant galaxies is the much higher dust content in the latter, which averages 1.5–2.5 mag in the high-mass bins. That much dust might possibly lead to weird ‘skin effects’ (Wild et al., 2011) if certain populations lie farther in front of the dust than others. Even so, constructing a model in which H in dusty galaxies has essentially zero attenuation, even in the outer regions, appears challenging.
7.2 sSFR profiles
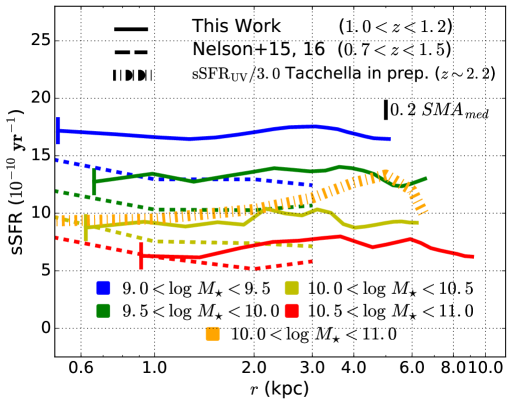
Fig. 11 compares sSFR profiles in different stellar mass ranges. In contrast to , sSFR profiles are much more consistent.
The dashed lines again represent sSFR derived from H emission in Nelson et al. (2016b), corrected by the profiles in Fig. 10 (which came from Nelson et al. 2016a). In the correction, we assume the same differential attenuation law as Wuyts et al. (2013):
| (2) |
where is the additional attenuation of light at galaxy H ii regions, compared to the attenuation caused by ambient diffuse dust in other regions (). We rewrite the equation above by replacing with :
| (3) |
The sSFR profiles in Nelson et al. (2016b) are calculated from the quotient between H and WFC3/F140W surface flux density (corresponding to rest-frame 7000 Å at , almost the same wavelength as H). Therefore we include the corrections both from H and from the broadband in the final sSFR calculation:
| (4) |
where is the value presented by (Nelson et al., 2016b), and is the dust corrected sSFR. This correction more than removes the steep central drops in raw seen in Nelson et al. (2016b), showing that they are plausibly due to dust and not to drops in central sSFR. The orange dotted curve are the sSFR values measured by Tacchella et al. (2017) using the UV- method, which have been scaled down by a factor of 3 to correct for the general decline of sSFR with redshift (see Rodríguez-Puebla et al. 2016). Considering the vastly different radial dust corrections in Nelson et al. (2016a) versus the two continuum methods, it is remarkable that all three methods wind up giving sSFR profiles that broadly agree in shape and overall magnitude. Generally flat sSFR profiles are seen, though a slight central fall of about (20 per cent) may be present in the most massive bin in our data (red curve). This is discussed below.
8 Discussion
The previous sections have derived consistent trends in the radial behaviors of both sSFR and using the UVJ-based calibration, which in turn is founded on the conventional SED-fitting approach that assumes -models, solar metallicity, the Calzetti attenuation law, and dust in a foreground screen. Nevertheless, there are two puzzling aspects of the data that prompt further discussion:
1) A well established property of galaxies is that their stellar radii grow with time (van Dokkum et al., 2013; Patel et al., 2013). In contrast, the present analysis finds that specific star-formation rates are roughly the same at all radii. If this were literally true at all times and all radii, stellar radii would not grow, leading to a contradiction with the data.
2) A second issue is the ratio of to stellar-mass surface density. From Fig. 7, we see that this ratio increases radially outward by a factor of 10 over the range of radii sampled. As shown below, if dust scales roughly with gas, this implies a large outward increase in gas-to-star density, which is surprising for galaxies that supposedly have the same sSFR at all radii. Alternatively, a large outward increase in the dust-to-gas ratio could reconcile the data, but the magnitude of the needed effect is again large and is backwards from normal galaxy models, which tend to be metal-poor in their outer parts.
The following sections discuss these two potential problems. We consider vulnerabilities in the conventional analysis that might help to explain away or mitigate the above results. We also compare to recent hydrodynamic models of galaxy formation, which, as will be seen, are largely in accord with these observed properties.
8.1 Critique of values
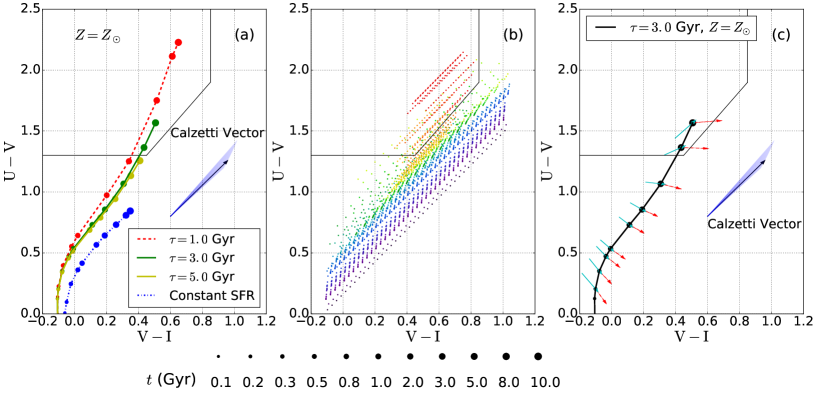
We start the discussion of dust by reviewing how the conventional values of from SED fitting are derived. This is explained by Fang et al. (2017, submitted) and illustrated here in Fig. 12. Panel a) shows a variety of -models [i.e., models with exponentially declining SFHs, ] without dust. -models generate tracks whose slopes are steeper than the Calzetti vector, which permits separating their stellar population ages from dust reddening. Adding dust to -models stretches them out along the Calzetti vector, producing the familiar stripes of constant sSFR, with sSFR decreasing upwards. This is illustrated in panel b), which mixes together solar-metallicity -models with different ages, ’s, and and colour-codes each point by its sSFR. It is seen that models near a given spot in UVI have remarkably similar sSFRs despite having a mixture of ages and ’s. Note that this pattern is violated by the constant SFR model (infinite ), which evolves parallel to the reddening vector at late times, despite having a falling sSFR. sSFR would be modestly overestimated for such populations using the conventional SED method, while would be overestimated by up to 1 mag for periods of constant star formation lasting for several billion years. To derive , a galaxy is slid backwards along the Calzetti vector to intersect the locus, and the resulting varies approximately linearly with .
We note that the conventionally derived values have strong support. For example, UV-infrared excess (IRX) is an independent measure of dust besides the optical/near-IR SED method used here. IRX has been shown to correlate well with both (Arnouts et al., 2013) and with (Forrest et al., 2016), supporting the notion that an optical/near-IR colour index can measure dust. The correlation between and established in this paper then validates . Also Tacchella et al. (2017) use the relatively independent UV- method, and our agreement with them in Fig. 10 is further support.
As a further check, we have investigated the dependence of on galaxy inclination. Star-forming galaxies are beginning to settle to rotating disks by (Kassin et al., 2012), and, if measures dust, it should be higher in edge-on galaxies (see study of local disk galaxies by Devour & Bell 2016). A test of this is shown in Fig. 13, which shows profiles of galaxies grouped by inclination. Flattened galaxies are now included, and the sample is divided into bins of mass and axial ratio. It is seen that rises with inclination, as predicted. The relative change in with radius is similar for all inclinations, as shown by the constant visual offset between the (however, logarithmically plotted) curves for different axis-ratio samples. This indicates a similar radial pattern of dust at different inclinations. Axis ratio data thus further support the scenario that measures dust and that colour gradients mainly reflect dust gradients.
A final comparison is with the recent hydrodynamic models of galaxy formation by Ceverino et al. (2014) (also see Zolotov et al. 2015), as analyzed by Tacchella et al. (2016). For low-mass galaxies with near , their fig. 7 shows a radial decline in stellar mass surface density, , of dex/dex over our range of measured radii, compared to a fall in gas surface density, , of only dex/dex. This gradient ratio of 0.15 in gas to stars agrees well with the ratio = 0.25 seen in our data in Fig. 7, assuming that scales in proportion to . A similar ratio is seen for their high-mass galaxies though both declines are individually larger. Thus our data look like models.
In short, continuum data from several studies (Wuyts et al. 2012, Tacchella et al. 2017, and this work) indicate slowly falling profiles in the outer parts of distant galaxies, and thus the presence of considerable gas there if the dust-gas ratio is approximately constant (Rachford et al., 2009; Bolatto et al., 2013; Sandstrom et al., 2013).
We note in passing that, although both data and theory support the conventional SED-fitting method, which employs -models, values could be lower using different stellar population models. An experiment with a toy composite stellar population is shown in Appendix B, formed by combining different amounts of very old and very young stars. Such a mixture might be appropriate to a fully quenched bulge surrounded by a strongly star-forming outer disk. The total central quenching in this model is thus too extreme for our galaxies, but they may be evolving in this direction. It is seen that the effect of compositeness is to create models on curved loci that lie to the right of the -model tracks, and thus yield lower values of . A second example is the constant star-formation model (infinite ) in Fig. 12, which also evolves off to the right. Our point is that using -models is not a neutral assumption about but rather tends to maximize it. This should be kept in mind, especially at late times, when compositeness tends to increase.
Furthermore, alternative dust geometry models may also change our understanding of the dust surface density distribution. Different from the dust screen model assumed in this work, which predicts a proportional relation between SED-fitted and dust surface density, can be a highly non-linear function of dust surface density if in reality dust is homogeneously mixed with stars (“dust slab" model, see eq. 3 of Genzel et al. 2013). Similar models have been considered in several local studies (e.g. Tuffs et al. 2004; Wild et al. 2011; Genzel et al. 2013; Devour & Bell 2016), however still in question for high redshift galaxies (Wuyts et al., 2011; Nordon et al., 2013; Salmon et al., 2016). As a verification of the non-linear effect, we have used fast to fit model SEDs of SFMS galaxies, created assuming exponential declining SFHs, solar metallicity and different amount of attenuation following the slab dust model. To best resemble the real data and SED fitting process by Santini et al. (2015), these model galaxies are in the same mass and redshift range as the observations, and their SEDs are sampled in the same observed bands as the GOODS-South photometry catalog (Guo et al., 2013) to serve as the SED-fitting input. We find that when the output declines from 2.0 mag to 1.0 mag, which is the typical case in Fig. 7, the dust surface density (proportional to the total optical depth) drops by a factor of 6. This value is still smaller than the observed stellar mass density change (a factor of 10-20). Moreover, Nordon et al. (2013) suggested that the realistic dust-star geometry of high redshift galaxies should be a hybrid of the dust screen model and the slab model, which indicates that the factor derived here with the slab model is an upper limit.
In summary, we find good agreement of profile measurements with other observation results and hydrodynamic simulations, assuming that the dust-gas ratio is approximately constant. When trying to infer dust (gas) surface density from profiles, the slab dust model predicts a 3 times steeper drop than the screen model, which indicates that dust geometry can significantly influence our understanding of the dust surface density distribution. However, this only mitigates but does not remove the even larger difference between the inferred radial dust (gas) density slope and the stellar density slope. Such persisting difference is also found to exist in hydrodynamic simulations (Tacchella et al., 2016). The deviation from SFH could bring bias to our measured value, but will also break our established consistence with other independent works.
The next section discusses this result in comparison to more steeply falling SFR profiles.
8.2 Critique of sSFR values
The second problem with the conventional SED-fitting approach is that the resulting sSFR profiles appear to be constant with radius. If true at all times and all radii, this would yield star-forming galaxies with constant stellar-mass effective radii. In contrast, light-weighted effective radii are seen to increase roughly as (Patel et al. 2013; van Dokkum et al. 2013, see also Papovich et al. 2015). It is true that mass-weighted and light-weighted radii can differ in galaxies with stellar-population gradients (Fang et al., 2013), but galaxies with flat sSFR profiles should not have such gradients. A related datum is the evolution of galaxies in (, ) space, which plots stellar mass surface density within 1 kpc versus total stellar mass. appears to grow more slowly than (Barro et al., 2015), again indicating lower central stellar-mass growth.
We turn again to hydrodynamic models for help in reconciling these discrepancies. We find that plots of model sSFR in fig. 7 of Tacchella et al. (2016) are remarkably flat over our measured range of radii, especially in smaller galaxies at early times. The resemblance to our data is striking. Nevertheless, the stellar-mass radii of these same galaxies are growing. This is because gas is being added beyond our measured radii, where considerable star formation is taking place. Hence, our decision to limit the data to 2 may have inadvertently eliminated regions that are contributing most to radius and stellar-mass growth. Taking this limitation into account would reconcile our flat sSFR profiles with the observed radii growth of star-forming galaxies and also with the slower growth of relative to in Barro et al. (2015). In essence, galaxies grow inside-out in an overall sense while star-forming, but our data only sample the inner regions.
Beyond this, the streaming of stellar mass on to galaxy outskirts via minor mergers and accretion may also contribute to the galaxy size growth, which has been discussed in recent works (Welker et al., 2017). We leave this possibility open considering that the roles of mergers in galaxy formation is still in debate (e.g., Lotz et al. 2010; Puech et al. 2014 and references therein).
We further note that, although sSFR is flat, SFR falls steeply (see Fig. 7) in contrast to gas and/or , which both fall slowly. This behavior is a feature not only of the data but also of the hydrodynamic models. A steep fall in SFR plus a slow fall in gas is not consistent with the Kennicutt law (Kennicutt, 1992), which says that , where . Obtaining agreement with the models and our data would require increasing to –4 over our measured range of radii. Local spatially resolved galaxies exhibit the same trend, and suggest that the high value of at galaxy outskirts is caused by H i dominating over (Bigiel et al., 2008). This scenario should be pursued at high redshift in future measurements.
Even though our data do not probe large radii, they are a good probe of inner quenching. A major finding of this paper is that, as an average trend bulges are not strongly quenched over our measured range of masses and redshifts (cf. the empty quenched regions in Fig. 3 and 4). We now attempt to assess the levels of central star formation more quantitatively. The sSFR profiles in Fig. 9 are uniformly flat for all lower masses but may show central dips in the highest mass bin. Fitting sSFR as a power of to these profiles yields an average deficit of sSFR at 0.2 SMA relative to 1.0 SMA of 20 5 per cent, increasing to 245 per cent in the lowest redshift bin (–0.8). In other words, sSFR profiles are flat at low mass but show small central depressions at high mass, possibly growing modestly with time. Bulge quenching thus appears to set in near at high masses, evolving ultimately to the sequence of strongly quenched bulges in high stellar-mass galaxies that is seen today (e.g., González Delgado et al. 2015, 2016).
This picture broadly agrees with previous work on galaxies, with some differences. Wuyts et al. (2013) used dust-corrected H to measure radial star-formation patterns in massive galaxies above at –1.5. The main result was constant sSFR throughout most of the galaxies, in agreement with our flat sSFR profiles. Some reduction in central sSFR was noted, but no numbers were given. Patel et al. (2013) measured the time evolution of stellar mass profiles in Milky Way progenitors and found that growth rates inside and outside 2 kpc were the same down to (when corrected for differences) and diverged slowly after that. In a similar study, van Dokkum et al. (2013) found identical inner and outer growth rates down to . Shibuya et al. (2015) found a steep increase of Sésic index for star forming galaxies at and , compared to the nearly invariant trends in other mass-redshift ranges. The onset of bulge quenching is detectable in our most massive bin, which is closest to the Milky Way progenitor mass at (), in a rough agreement with the two Milky Way progenitor studies, and lies in exactly the same range where Sésic index is seen to increase.
In a study using CANDELS images, Liu et al. (2016) measured colour gradients in star-forming galaxies at . This study used the same radial photometry catalog used in the present study. Radial rest-frame colour gradients were nearly zero for after dust correction, but significant residual colour gradients were found above this, corresponding to at . The mass trend agrees with our results, but the central fall of 60 per cent in high-mass galaxies is three times larger than what we find. The Liu et al. (2016) study determined dust and SFR by running fast directly on B through H band HST images, whereas our study attempts to match a calibration based on SEDs that originally includes IRAC bands. Preliminary tests fitting fast with and without IRAC show significant scatter and biases, which may contribute to the difference.
The only previous work in potentially serious disagreement with the present results is Tacchella et al. (2015), which used H fluxes to measure sSFR gradients in star-forming galaxies at . In massive galaxies with –11.7, central sSFR was found to be only 1/10 of outer sSFR in the same objects (cf. their fig. 1B(c)). However, no information on the H/H ratio as a function of position was available. The subsequent data of Nelson et al. (2016a) in Fig. 10 show that central H can be strongly absorbed, and correcting that yields flat sSFR profiles (cf. Fig. 11). The integrated dust attenuation value of the massive galaxies studied by Tacchella et al. (2015) is around 1.0 mag, which indicates that in the galaxy centers can be even larger than that value. So radial dust corrections are needed to precisely constrain sSFR profiles. Subsequent work by Tacchella et al. (2017) on galaxies used the UV- technique and found flat sSFR profiles for galaxies in the range –11.0, as shown in Fig. 11. Similar measurements at found centrally depressed sSFR for galaxies with high central mass density, but no confirmed central sSFR drop is seen when their sample is binned into stellar mass bins (Jung et al., 2017).
We conclude this section with a discussion of other uncertainties that may affect our sSFR profiles. Salmon et al. (2016) conducted an independent study of the attenuation law and found good overall agreement with Calzetti but a small change in slope that varies with the amount of attenuation, producing a curved reddening line in UVJ (and UVI) above the Calzetti vector. Using the Salmon law would alter sSFR gradients by typically 0.1 dex over our measured radii, by amounts that depend on dust content. Low-mass, low-dust galaxies would have central sSFR increased by 0.1 dex, while high-mass high-dust galaxies would have central sSFR decreased by 0.1 dex, increasing central quenching.
Metallicity gradients, if present, would further impact sSFR profiles. Panel c) of Fig. 12 shows the effect of varying on a galaxy’s location in the UVI diagram. Broadly, increasing shifts points to the right and (possibly) down. If stars are more metal-rich at the centres of galaxies, we would first move that point left (and upwards) to correct it to solar metallicity and then apply the present UVI calibration. In the presence of metallicity gradients, this correction would move central points more than outer points, creating a tilt with respect to the Calzetti vector, and thus an sSFR gradient. Higher central metallicities would reduce central sSFR’s, and thus produce more bulge quenching than the conventional method, which uses uniform solar metallicities.
The size of the resulting gradients depends on metallicity, since stellar colours are less sensitive at low (see Fig. 12c). A gradient of dex/dex produces dex/dex at super-solar metallicities, but the effect is three times smaller at sub-solar metallicities. IFU surveys of distant galaxies (Stott et al., 2014; Wuyts et al., 2016; Leethochawalit et al., 2016) indicate that gas-phase metallicity gradients mainly cluster in the range -0.05 to +0.05 dex/kpc at –2.5, which converts to approximately -0.5 to +0.5 dex/dex for our galaxies. However, galaxies that are initiating bulge quenching would tend to be more massive and more highly differentiated radially, and thus might be expected to have metallicity gradients near the upper end of this range.
We have thus identified two corrections – metallicity gradients and corrections to the attenuation law – that both tend to increase the modest central sSFR depressions that we detect. As metallicity cannot be measured from UVI alone, correcting for it will require detailed absorption-line spectra as a function of radius. Putting all numbers together, we can imagine that the raw central drops of 20–25 per cent measured in the massive bin could be perhaps twice as large. However, none of these factors can actually move raw points into the quenched region in UVI, and hence our averaged galaxy centres are not close to being fully quenched.
The final factor to be considered is the accuracy of stellar population models. As long as stellar populations are -models or mixtures of -models, our sSFR values are accurate, as shown in panel b) of Fig. 12. Section 8.1 mentioned two types of models that evolve off the locus to the right: composite models, as shown in Fig. 16 and discussed in the Appendix B, and the model with constant SFR (infinite ) in Fig. 12. sSFRs for both of these models using the present UVI calibration would be overestimated. However, as long as stellar populations are reasonably uniform throughout a galaxy, this error does not affect gradients. A non-uniform attenuation model is also considered in the Appendix B, i.e., mixing dusty young stars with dust-free old stars, which could be closer to the realistic case of composite stellar population. But still, quenched centres cannot be recovered under such model tests. This overall means our findings of flat radial sSFR trends are robust against straightforward modeling of composite stellar population. But we acknowledge the subtle possibility that more sophisticated stellar population models in the future, including varying stellar metallicity and more complex compositeness, can potentially alter the conclusion.
To summarize, our measurements suggest that flat sSFR profiles are the norm for low-mass galaxies but that bulge quenching sets in around at high masses. Both findings are in general accord with previous works. The apparent contradiction between flat sSFR profiles and radius growth can be reconciled by noting that our data are truncated at 2 and stars may be forming outside this radius, as seen in recent hydrodynamic models.
9 Conclusions
We have shown that measuring profiles is a promising way to study the interstellar medium and its distribution in distant galaxies. The major conclusions from this paper are as follows:
1) We analyze the radial colour gradients of star-forming galaxies from to 1.4 and –11.0. HST images of CANDELS galaxies from through are used to derive rest-frame values of and in annular bins. Galaxies are stacked in bins of mass and redshift, and radial colour gradients for each bin are plotted in UVI. The data cover 1 dex in radius starting near 1 kpc and extend to 2 , where they are truncated.
2) The sizes of colour gradients increase with global and with galaxy stellar mass. Gradients parallel the Calzetti reddening vector in the UVI plane, indicating that most of the gradient is due to dust, not sSFR. Corrections are derived for PSF smearing, and the data are stacked in both arcsec and fractional effective radius, but the basic conclusions remain the same. In particular, galaxy centres averaged in redshift and stellar mass bins lie within the star-forming region of UVI and are not quenched.
3) The integrated colours of galaxies in the UVI and UVJ diagrams are compared, and it is shown that UVI can also be used to derive sSFR and analogous to UVJ. The calibrations for sSFR and derived by Fang et al. (2017, submitted) for UVJ are transferred to UVI using the integrated colours of galaxies in common. The calibrations are based on fits to CANDELS catalogue values of sSFR and that are derived using SED fits to integrated optical/near-IR photometry, assuming declining- stellar-populations, stellar metallicity, a Calzetti attenuation law, and dust in a foreground screen. The resulting values are similar or identical to conventional values of sSFR and derived by using the fast SED fitting code. After mapping on to the UVI diagram, the values of sSFR and are recovered with an rms error of 0.15 dex and 0.18 mag respectively.
4) Integrated sSFR values decline weakly with both mass and time, while integrated increases strongly with mass. Integrated increases weakly with time at fixed mass, but this trend reverses at the highest masses, where decreases with time, possibly due to a loss of ISM at late times. is higher in edge-on galaxies, and gradients are steeper in dustier galaxies.
5) Radial sSFR and profiles based on our conventional SED fitting calibration are presented versus radius. The sSFR profiles are generally flat except for the –11.0 bin, where values at 0.2 SMA average 20 per cent smaller than at 1.0 SMA, increasing to 25 per cent in the lowest redshift bin. These trends are consistent with bulge quenching setting in near at high mass. profiles fall smoothly by about a factor of two from the centre to the edge of the data at all masses and redshifts.
6) Two puzzling aspects of the data are considered. The first is that sSFR profiles are flat in most mass bins yet the radii of star-forming galaxies are observed to increase as . This discrepancy can be explained if new gas and stars are being added outside our range of measured radii that we are not sensitive to. A second point is that dust (gas) surface density declines much more slowly than stellar-mass surface density (assuming that is proportional to gas surface density and non-varying dust-to-gas ratio). Switching from the dust screen assumption to the slab model only mitigates but does not remove this difference. Comparing this to SFR profiles then implies a Kennicutt law with exponent 4, much steeper than the conventional value of 1.4. Interestingly, both of these features – flat inner sSFR profiles and shallow radial declines in gas surface density – are also seen in recent hydrodynamic models, which also have growing radii, flat inner sSFR profiles, and shallower fall-offs in gas than in stars (Tacchella et al., 2016).
Acknowledgements
We thank the anonymous referee for constructive comments. We acknowledge the CANDELS team members for the substantial effort in science operation and catalogue construction, including photometry, morphology, redshift, rest-frame photometry, and physical parameter works, which this work is heavily based on. WW thanks Shude Mao for undergraduate advising, Fengshan Liu and Sandro Tacchella for inspiring discussions and sharing pioneering results, Eric Bell for useful comments, and Tsinghua Center for Astrophysics, and University of California, Santa Cruz for generous supports. WW and SAK acknowledge support from NASA grant 15-ADAP15-0186, ‘What is the Dominant Mode of Star-Formation as a Function of Galaxy Mass and Redshift?’. SMF, YG, DCK, and JJF acknowledge the NASA HST grant GO-12060.10-A and NSF grant AST-0808133. The aperture photometry project was supported by the NSFC (11103013 and 11573017). ZC acknowledges support from NFSC funding 11403016.
This work is based on observations taken by the CANDELS Multi-Cycle Treasury Program with the NASA/ESA HST, which is operated by the Association of Universities for Research in Astronomy, Inc., under NASA contract NAS5-26555. Also this work is based in part on observations made with the Spitzer Space Telescope, which is operated by the Jet Propulsion Laboratory, California Institute of Technology under NASA contract 1407. We also thank various important ground-based observation projects, which greatly empower the CANDELS catalogues by expanding observation data to ranges from UV to far IR. This research made use of Astropy, a community-developed core Python package for Astronomy (Astropy Collaboration, 2013).
References
- Arnouts et al. (2013) Arnouts S., et al., 2013, A&A, 558, A67
- Bakos et al. (2008) Bakos J., Trujillo I., Pohlen M., 2008, ApJ, 683, L103
- Barro et al. (2015) Barro G., et al., 2015, preprint (arXiv:1509.00469)
- Barro et al. (2016) Barro G., et al., 2016, ApJ, 827, L32
- Bertin & Arnouts (1996) Bertin E., Arnouts S., 1996, A&AS, 117, 393
- Bigiel et al. (2008) Bigiel F., Leroy A., Walter F., Brinks E., de Blok W. J. G., Madore B., Thornley M. D., 2008, ApJ, 136, 2846
- Bolatto et al. (2013) Bolatto A. D., Wolfire M., Leroy A. K., 2013, ARA&A, 51, 207
- Brammer et al. (2008) Brammer G. B., van Dokkum P. G., Coppi P., 2008, ApJ, 686, 1503
- Brammer et al. (2009) Brammer G. B., et al., 2009, ApJ, 706, L173
- Brammer et al. (2012) Brammer G. B., et al., 2012, ApJS, 200, 13
- Brinchmann et al. (2004) Brinchmann J., Charlot S., White S. D. M., Tremonti C., Kauffmann G., Heckman T., Brinkmann J., 2004, MNRAS, 351, 1151
- Bruzual & Charlot (2003) Bruzual G., Charlot S., 2003, MNRAS, 344, 1000
- Calzetti et al. (1994) Calzetti D., Kinney A. L., Storchi-Bergmann T., 1994, ApJ, 429, 582
- Calzetti et al. (2000) Calzetti D., Armus L., Bohlin R. C., Kinney A. L., Koornneef J., Storchi-Bergmann T., 2000, ApJ, 533, 682
- Ceverino et al. (2014) Ceverino D., Klypin A., Klimek E. S., Trujillo-Gomez S., Churchill C. W., Primack J., Dekel A., 2014, MNRAS, 442, 1545
- Chabrier (2003) Chabrier G., 2003, PASP, 115, 763
- Charlot & Fall (2000) Charlot S., Fall S. M., 2000, ApJ, 539, 718
- D’Souza et al. (2014) D’Souza R., Kauffman G., Wang J., Vegetti S., 2014, MNRAS, 443, 1433
- Dahlen et al. (2013) Dahlen T., et al., 2013, ApJ, 775, 93
- Devour & Bell (2016) Devour B. M., Bell E. F., 2016, MNRAS, 459, 2054
- Dunlop et al. (2017) Dunlop J. S., et al., 2017, MNRAS, 465, in press
- Elbaz et al. (2007) Elbaz D., et al., 2007, A&A, 468, 33
- Elmegreen & Elmegreen (2005) Elmegreen B. G., Elmegreen D. M., 2005, ApJ, 627, 632
- Fang et al. (2013) Fang J. J., Faber S. M., Koo D. C., Dekel A., 2013, ApJ, 776, 63
- Forrest et al. (2016) Forrest B., et al., 2016, ApJ, 818, L26
- Gadotti (2009) Gadotti D. A., 2009, MNRAS, 393, 1531
- Galametz et al. (2013) Galametz A., et al., 2013, ApJS, 206, 10
- Genzel et al. (2013) Genzel R., et al., 2013, ApJ, 773, 68
- González Delgado et al. (2015) González Delgado R. M., et al., 2015, A&A, 581, A103
- González Delgado et al. (2016) González Delgado R. M., et al., 2016, A&A, 590, A44
- Grogin et al. (2011) Grogin N. A., et al., 2011, ApJS, 197, 35
- Guo et al. (2012) Guo Y., Giavalisco M., Ferguson H. C., Cassata P., Koekemoer A. M., 2012, ApJ, 757, 120
- Guo et al. (2013) Guo Y., et al., 2013, ApJS, 207, 24
- Guo et al. (2015) Guo Y., et al., 2015, ApJ, 800, 39
- Jung et al. (2017) Jung I., et al., 2017, ApJ, 834, 81
- Kassin et al. (2012) Kassin S. A., et al., 2012, ApJ, 758, 106
- Kennicutt (1992) Kennicutt R. C., 1992, ApJ, 388, 310
- Kennicutt & Evans (2012) Kennicutt R. C., Evans N. J., 2012, ARA&A, 50, 531
- Koekemoer et al. (2011) Koekemoer A. M., et al., 2011, ApJS, 197, 36
- Kriek et al. (2009) Kriek M., van Dokkum P. G., Labbé I., Franx M., Illingworth G. D., Marchesini D., Quadri R. F., 2009, ApJ, 700, 221
- Labbé et al. (2005) Labbé I., et al., 2005, ApJ, 624, L81
- Laidler et al. (2007) Laidler V. G., et al., 2007, PASP, 119, 1325
- Leethochawalit et al. (2016) Leethochawalit N., Jones T. A., Ellis R. S., Stark D. P., Richard J., Zitrin A., Auger M., 2016, ApJ, 820, 84
- Liu et al. (2013) Liu G., et al., 2013, ApJ, 778, L41
- Liu et al. (2016) Liu F. S., et al., 2016, ApJ, 822, L25
- Lotz et al. (2010) Lotz J. M., Jonsson P., Cox T. J., Primack J. R., 2010, MNRAS, 404, 590
- Meurer et al. (1995) Meurer G. R., Heckman T. M., Leitherer C., Kinney A., Robert C., Garnett D. R., 1995, AJ, 110, 2665
- Meurer et al. (1997) Meurer G. R., Heckman T. M., Lehnert M. D., Leitherer C., Lowenthal J., 1997, AJ, 114, 54
- Meurer et al. (1999) Meurer G. R., Heckman T. M., Calzetti D., 1999, ApJ, 521, 64
- Momcheva et al. (2016) Momcheva I. G., et al., 2016, ApJ, 225, L27
- Morris et al. (2015) Morris A. M., et al., 2015, ApJ, 149, 178
- Murphy et al. (2011) Murphy E. J., Chary R.-R., Dickinson M., Pope A., Frayer D. T., Lin L., 2011, ApJ, 732, 126
- Muzzin et al. (2013) Muzzin A., et al., 2013, ApJS, 206, 8
- Nelson et al. (2016a) Nelson E. J., et al., 2016a, ApJ, 817, L9
- Nelson et al. (2016b) Nelson E. J., et al., 2016b, ApJ, 828, 27
- Noeske et al. (2007) Noeske K. G., et al., 2007, ApJ, 660, L43
- Nordon et al. (2013) Nordon R., et al., 2013, ApJ, 762, 125
- Pannella et al. (2009) Pannella M., et al., 2009, ApJ, 701, 787
- Papovich et al. (2015) Papovich C., et al., 2015, ApJ, 803, 26
- Patel et al. (2011) Patel S. G., Kelson D. D., Holden B. P., Franx M., Illingworth G. D., 2011, ApJ, 735, 53
- Patel et al. (2013) Patel S. G., et al., 2013, ApJ, 766, 15
- Peng et al. (2002) Peng C. Y., Ho L. C., Impey C. D., Rix H.-W., 2002, ApJ, 124, 266
- Puech et al. (2014) Puech M., Hammer F., Rodrigues M., Fouquet S., Flores H., Disseau K., 2014, MNRAS, 443, L49
- Rachford et al. (2009) Rachford B. L., et al., 2009, ApJS, 180, 125
- Radburn-Smith et al. (2012) Radburn-Smith D. J., et al., 2012, ApJ, 753, 138
- Reddy et al. (2006) Reddy N. A., Steidel C. C., Fadda D., Yan L., Pettini M., Shapley A. E., Erb D. K., Adelberger K. L., 2006, ApJ, 644, 792
- Reddy et al. (2010) Reddy N. A., Erb D. K., Pettini M., Steidel C. C., Shapley A. E., 2010, ApJ, 712, 1070
- Reddy et al. (2012) Reddy N. A., Pettini M., Steidel C. C., Shapley A. E., Erb D. K., Law D. R., 2012, ApJ, 754, 25
- Rodríguez-Puebla et al. (2016) Rodríguez-Puebla A., Primack J. R., Behroozi P., Faber S. M., 2016, MNRAS, 455, 2592
- Roškar et al. (2008) Roškar R., Debattista V. P., Stinson G. S., Quinn T. R., Kaufmann T., Wadsley J., 2008, ApJ, 675, L65
- Salmon et al. (2016) Salmon B., et al., 2016, ApJ, 827, 20
- Sandstrom et al. (2013) Sandstrom K. M., et al., 2013, ApJ, 777, 5
- Santini et al. (2015) Santini P., et al., 2015, ApJ, 801, 97
- Shibuya et al. (2015) Shibuya T., Ouchi M., Harikane Y., 2015, ApJS, 219, 15
- Simons et al. (2016) Simons R. C., et al., 2016, ApJ, 830, 14
- Speagle et al. (2014) Speagle J. S., Steinhardt C. L., Capak P. L., Silverman J. D., 2014, ApJS, 214, 15
- Stott et al. (2014) Stott J. P., et al., 2014, MNRAS, 443, 2695
- Szomoru et al. (2010) Szomoru D., et al., 2010, ApJ, 735, L22
- Tacchella et al. (2015) Tacchella S., et al., 2015, Science, 348, 314
- Tacchella et al. (2016) Tacchella S., Dekel A., Carollo C. M., Ceverino D., DeGraf C., Lapiner S., Mandelker N., Primack J. R., 2016, MNRAS, 458, 242
- Tacchella et al. (2017) Tacchella S., et al., 2017, preprint (arXiv:1704.00733)
- Tuffs et al. (2004) Tuffs R. J., Popescu C. C., Volk H. J., Fischera J., 2004, A&A, 419, 821
- Welker et al. (2017) Welker C., Dubois Y., Devriendt J., Pichon C., Kaviraj S., Peirani S., 2017, MNRAS, 465, 1241
- Whitaker et al. (2012) Whitaker K. E., van Dokkum P. G., Brammer G., Franx M., 2012, ApJ, 754, L29
- Wild et al. (2011) Wild V., Charlot S., Brinchmann J., Heckman T., Vince O., Pacifici C., Chevallard J., 2011, MNRAS, 417, 1760
- Williams et al. (2009) Williams R. J., Quadri R. F., Franx M., van Dokkum P., Labbé I., 2009, ApJ, 691, 1879
- Wuyts et al. (2007) Wuyts S., et al., 2007, ApJ, 655, 51
- Wuyts et al. (2011) Wuyts S., et al., 2011, ApJ, 742, 96
- Wuyts et al. (2012) Wuyts S., et al., 2012, ApJ, 753, 114
- Wuyts et al. (2013) Wuyts S., et al., 2013, ApJ, 779, 135
- Wuyts et al. (2016) Wuyts E., et al., 2016, ApJ, 827, 74
- Zheng et al. (2015) Zheng Z., et al., 2015, ApJ, 800, 120
- Zolotov et al. (2015) Zolotov A., et al., 2015, MNRAS, 450, 2327
- van Dokkum et al. (2013) van Dokkum P. G., et al., 2013, ApJ, 771, L35
- van der Wel et al. (2012) van der Wel A., et al., 2012, ApJS, 203, 24
- van der Wel et al. (2014a) van der Wel A., et al., 2014a, ApJ, 788, 28
- van der Wel et al. (2014b) van der Wel A., et al., 2014b, ApJ, 792, L6
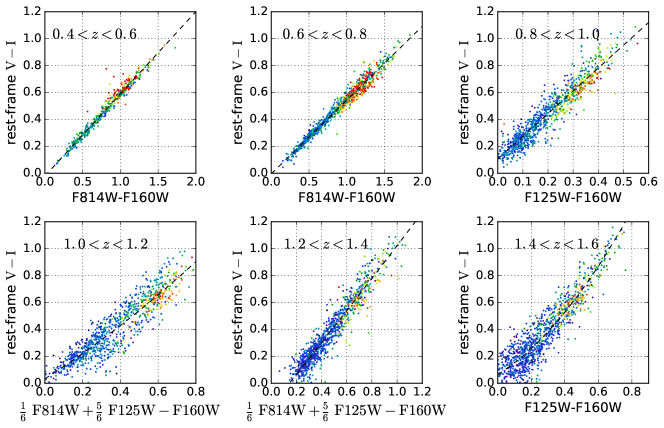
Appendix A Empirical rest-frame UVI colours
In order to derive the rest-frame colour profiles using multi-band annular photometry, we try to deduce the empirical relations between rest frame colours and observer-frame colours from the CANDELS integrated photometry catalogue (Guo et al., 2013; Galametz et al., 2013). For most galaxies in UDS, only F606W, F814W, F125W, and F160W photometry is available. Therefore in order to make the maximum use of our current data sample, we evaluate the feasibility of using these four filters to constrain rest-frame and colours.
Fig. 14 and Fig. 15 show the fitting of the relation between rest-frame colours and observer-frame colours. Each point in the plots represents the integrated colours of one individual galaxy from the CANDELS photometry catalogue, and the dashed curves are best-fitting models, either as straight lines or quadratic curves. For the rest-frame colour, the typical scatter of our fitting is 0.1–0.2 mag, and no bias about the sSFR is found. For , we find the colour scatter increases significantly at high redshift, possibly caused by random photometry uncertainty, but more likely by the increasing equivalent width (EW) of strong emission lines in the observer frame. The scatter at is smaller than 0.05 dex. However for the scatter can be as large as 0.1 dex, especially in the and bins, where the scatter reaches to around 0.2 dex. The non-unit coefficients in the -axis quantity in some panels are the result of empirical efforts to reduce this scatter. We constrain the sample to in order to obtain relatively accurate rest-frame photometry and take special caution with the samples by inspecting whether the derived UVI colour profiles follow the same evolutionary trend as other redshift bins. Finally, as shown by Wuyts et al. (2013), there are no systematic differences between the rest-frame colours derived from the four VIJH bands and those derived from the seven BVizYJH bands, for the range of rest-frame wavelength and redshifts used here. Further details are given in the figure captions. This indirectly supports the robustness of rest-frame colour deduction in our work.
Appendix B A toy model for the composite stellar population
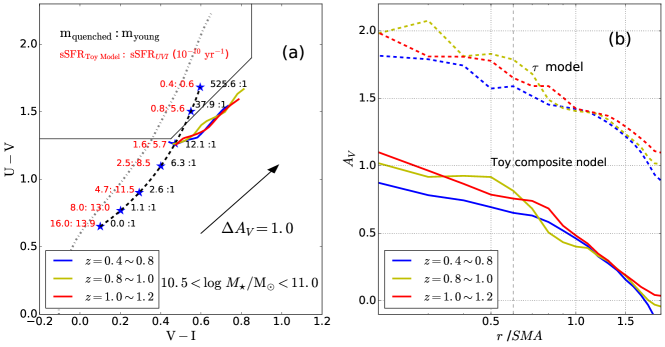
A toy model is shown in Fig. 16 to illustrate the features of highly composite stellar population. By ‘composite’, we mean strongly bimodal mixtures of old and young stars, which significantly deviate from the predictions of the exponentially declining SFH (-model). The integrated populations of galaxies may evolve in this direction as bulges quench and star formation continues in the outer parts. Less obvious, though still possible, is the compositeness at a given radius, where old and young population may co-exist. In general, the possibility of compositeness is greater at later times, when the oldest stars can be much older than the youngest stars. Hence, compositeness is likely to be more of a concern at lower redshifts.
The top and bottom points at the ends of the black dashed curve in Fig. 16 represent two typical stellar populations of quenched galaxies and blue star forming galaxies, with little dust extinction. The sSFR and of the two points are identified from the CANDELS catalogue as described in the main text. Then we mix the two populations by various mass ratios, as shown by in the figure, and locate the mixed populations on the UVI diagram by inferring their colours from the mass ratio and the mass-light ratios, as retrieved from the CANDELS rest-frame photometry catalogue. These model populations are shown as star symbols lying on the black dashed curves in the figure. For each stellar population mixture, we calculate its sSFR from the inferred total mass and SFR, indicated as . This is compared with the sSFR that would be derived from the UVI calibration method explained in Section 5, indicated as .
Finally, three observed colour gradients for the mass bin –11.0 and redshift range –1.2 are overplotted in Fig. 16, to show as an example how composite models would change our interpolation of sSFR and gradients. We infer the sSFR and profiles by assuming that the colour gradients are caused by uniform attenuation of the composite stellar population on the dashed curve. The inferred profiles, in comparison with those derived from the UVI calibration method, are shown in panel b.
The major impact of using the composite model is to greatly reduce the derived value of . This occurs because the composite model lies systematically to the right of the -laws (see the gray curve), so that deduced is lower. For the gradients shown, the composite model subtracts a full 1.0 mag from all values. Relative gradients are preserved, but the outer values are reduced to zero. This exercise shows that compositeness is one approach to reducing outer dust values, if that is deemed necessary. It also illustrates how -models tend to maximize values relative to other stellar population possibilities. Therefore gas profiles inferred from the composite model would have much larger relative radial changing rates due to the zero point shift. Comparing with values given by the composite models, the UVI values are fairly accurate near the ends of the black curves, but overestimate sSFR by about 3–4 near the top of the blue cloud and in the green valley. Compositeness thus appears to preserve the relative rankings of sSFR but compresses the range of deduced sSFR within the blue cloud. The relatively flat trend of colour gradients is not affected because that they are parallel to the Calzetti vector.
Besides this uniform dust screen model, we have also tested differential attenuation models (not shown), which mixes dust-free old stars and the dusty star forming population to match the observed colour gradients. In this case the effective mass-to-light ratio of young stars increases by an additional factor of 4 due to dust attenuation ( mag). As a result, young dusty stars must dominate over the old stars in mass to match the observed colours of galaxy centres, and the high fraction of old stars cannot be achieved as expected. The flatness of sSFR profiles and the shift of profiles are found to be similar with those from the uniform attenuation model.
In a word, our toy models of composite stellar population shift the profiles downward by the same amount, but cannot alter the relatively flat trend of sSFR profiles, indicating that the active central star-formation described in the main text is robust against the tests.