Relativistic hydrodynamic jets in the intracluster medium
Abstract
We have performed the first three-dimensional relativistic hydrodynamic simulations of extragalactic jets of pure leptonic and baryonic plasma compositions propagating into a hydrostatic intracluster medium environment. The numerical simulations use a general equation of state for a multi-component relativistic gas which closely reproduces the Synge equation of state for a relativistic perfect gas. We find that morphological and dynamical differences between leptonic and baryonic jets are much less evident than those between hot and cold jets. In all these models, the jets first propagate with essentially constant velocities within the core radius of the intracluster medium and then accelerate progressively so as to increase the jet advance velocity by a factor of between 1.2 and 1.6 at the end of simulations, depending upon the models. The temporal evolution of the average cavity pressure is not consistent with that expected by the extended theoretical model even if the average cavity pressure decreases as a function of time with a power-law. Our simulations produce synthetic radio images that are dominated by bright hot spots and appear similar to observations of the extended radio galaxies with collimated radio jets. These bright radio lobes would be visible as dark regions in X-ray images and are morphologically similar to observed X-ray cavities in the intracluster medium. This supports the expectation that the bow shock surrounding the head of the jet is important mechanism for producing X-ray cavities in the intracluster medium. Although there are quantitative differences among the models the total radio and X-ray intensity curves show qualitatively similar trends in all of them.
keywords:
galaxies: clusters: general – galaxies: jets – hydrodynamics – methods: numerical – plasmas – relativistic processes.1 Introduction
A substantial number of observational and theoretical studies show that powerful extragalactic radio sources have highly relativistic and collimated jets that emerge from a central active galactic nucleus (AGN). These relativistic jets transport away bulk kinetic energy from the AGN to the lobes; this kinetic energy is dissipated by shocks within the beam and at the terminal shocks where electrons are accelerated (Blandford & Rees, 1974). In the current paradigm, these relativistic jets could be made of a baryonic plasma containing relativistic electrons and thermal protons, a leptonic plasma of relativistic electrons and positrons, or possibly other mixtures of relativistic electrons and other species. Since the plasma compositions of extragalactic jets are directly related to their formation mechanism, stability, and energy transport, the composition of jets has been recognized as important for a long time, but it is still poorly known (e.g., De Young, 2006).
There is strong observational evidence that the intracluster medium (ICM) interacts with the radio jets (e.g., Fabian et al., 2000, 2006; Wise et al., 2007; Forman et al., 2007; Blanton et al., 2009; Randall et al., 2011; Sanders et al., 2016). This conclusion has been driven by X-ray observations, which have shown clearly that a powerful radio source affects the ICM significantly in the vicinity of the source. In particular, the propagating relativistic jets inflate large underdense cavities which displace the local intracluster hot gas and hence appear as dark holes in X-ray observations. The observed radio lobes are coincident with evacuated cavities that are bounded by shells of enhanced emission in the intracluster medium. Occasionally in the hot ICM, apparent relic extended radio structures from the central AGN are observed with no, or very faint, apparent radio connections. These various phenomena imply that outflows from AGN can inflate X-ray cavities or radio bubbles in the ICM, which then may dynamically evolve on their own (e.g., Randall et al., 2011).
An substantial effort toward modeling the interaction between radio jets and the ICM has been made using hydrodynamic simulations (e.g., Reynolds et al., 2001, 2002; Basson & Alexander, 2003; Omma et al., 2004; Vernaleo & Reynolds, 2006; Heinz et al., 2006; Cattaneo & Teyssier, 2007; Morsony et al., 2010; Gaspari et al., 2011; Hardcastle & Krause, 2013). These non-relativistic hydrodynamic simulations give us a reasonable outline of how the radio sources impact the ICM and of how they evolve. Reynolds et al. (2001, 2002) simulated, in two dimensions, AGN radio jets in a hydrostatic, spherically symmetry galaxy cluster model. Morsony et al. (2010) performed three-dimensional simulations of AGN jets in a cosmologically evolved, realistic galaxy cluster. They found that large-scale motions of cluster gas disrupt the AGN jets, which leads to the appearance of multiple disconnected X-ray bubbles from a AGN with a constant luminosity. Although the basic physical processes have been established by these numerical studies, the details of the evolution of a relativistic jet in a cluster atmosphere needs to be fully understood. In the context of relativistic hydrodynamic simulations, several numerical simulations of the interaction of the relativistic jets with the surrounding material have been reported (Komissarov & Falle, 1998; Scheck et al., 2002; Meliani et al., 2008; Rossi et al., 2008; Perucho et al., 2011, 2014). These simulations use a more general equation of state to account for transitions from non-relativistic to relativistic regimes. Scheck et al. (2002) used two-dimensional relativistic hydrodynamic simulations to investigate the influence of the composition of relativistic jets on their long-term evolution in a homogeneous external medium. Meliani et al. (2008) studied the relativistic jet deceleration through density discontinuities using two-dimensional hydrodynamic simulations. More recently, Perucho et al. (2014) performed two-dimensional hydrodynamic simulations of relativistic jets propagating into a cluster environment to attempt to understand ICM heating.
Since the relativistic flows change their state, a realistic equation of state must be adopted to handle both nonrelativistic and relativistic states. The exact form of an equation of state relating thermodynamic quantities of specific enthalpy and temperature is completely described in terms of modified Bessel function (Synge, 1957). The Synge equation of state for the relativistic perfect gas, however, is not efficient and thus unsuitable from the computational point of view since it involves the computation of Bessel functions, which entail a significant computational cost, especially in three-dimensional high-resolution simulations. To avoid the direct use of the Synge equation of state, Mignone & McKinney (2007) used, in their numerical relativistic hydrodynamic code, a simple and linear equation of state that closely approximates the Synge equation of state for a single-component relativistic gas. In the context of the relativistic hydrodynamic code, Choi & Wiita (2010) proposed a general equation of state for a multi-component relativistic gas which is consistent with the Synge equation of state for a relativistic perfect gas and is efficient and suitable for numerical relativistic hydrodynamics. This proposed general equation of state has an analytic expression and closely reproduces the Synge equation of state for a multi-component relativistic gas in all regimes.
In this paper we present the first three-dimensional relativistic hydrodynamic simulations of extragalactic jets with different plasma compositions in an inhomogeneous ICM environment, using a general equation of state. We focus not only on how the relativistic jet interaction with an ICM affects the morphology, dynamics, and emission of the jets and the ICM but also how the different plasma compositions of the jets influence their evolutions. The paper is organized as follows. In Section 2 we describe the details of the numerical simulations of our work, and in Section 3 we discuss and interpret the simulation results. A discussion and conclusion are presented in Section 4.
2 Numerical simulations
2.1 Relativistic hydrodynamic equations
The equations of special relativistic hydrodynamics with weak gravity (Hwang & Noh, 2016) can be written as conservation laws for mass, momentum and energy as
| (1) |
| (2) |
| (3) |
Here the conservative variables , M, and represent respectively the mass density, the momentum density, and the energy density in the reference frame, the primitive variables , v, and denote respectively the rest mass density, velocity, and pressure in the local rest frame, is the unit tensor, and is the gravitational potential. The speed of light is set to unity () throughout this work.
The conservative variables measured in the reference frame are related to the primitive variables in the local rest frame according to the transformations
| (4) |
| (5) |
| (6) |
where is the Lorentz factor and is the specific enthalpy. The transformation is nonlinearly coupled and reduces to a single nonlinear equation.
The system of conservation equations is closed by an equation of state that can be expressed for the specific enthalpy as a function of the rest mass density and the pressure . As mentioned earlier, the exact form of equation of state for a relativistic perfect gas was given by Synge (1957) and the Synge equation of state is entirely described in terms of the modified Bessel function. Mathews (1971) introduced a linear equation of state which closely reproduces the Synge equation of state for a single-component relativistic gas. For a multi-component relativistic gas composed of electrons, positrons, and protons, Choi & Wiita (2010) studied the linear approximation of the Synge equation of state and proposed a new general equation of state that uses an analytical expression and is suitable for numerical computations. We adopt that proposed equation of state which takes the form
| (7) |
where is a measure of inverse temperature, is the relative fraction of proton and electron number densities, and is the mass ratio of proton to electron. We note that represents an electron-positron gas while indicates an electron-proton gas.
The explicit form of the sound speed depends on the equation of state. The sound speed is written as
| (8) |
and the relativistic adiabatic index is given by
| (9) |
where . The relativistic adiabatic index is constant ( or ) if the gas remains ultrarelativistic () or subrelativistic (). For the intermediate regime the quantity varies between the two limiting cases.
The simulation results are given in arbitrary units. We can relate the dimensionless quantities to the physical quantities by fixing the relevant parameters of the ICM to values representative of a typical galaxy cluster. In this work we can use this scaling when converting our simulation results into physical quantities that can be compared directly with real systems.
2.2 Intracluster medium
The ICM can be reasonably treated as a spherical halo consisting of a hot gas and stationary dark matter and its dynamics is followed in the gravitational potential of background dark matter. The hot gas is assumed to be in hydrostatic equilibrium and energy dissipation due to radiative cooling is excluded. The radial density profile of the dark matter halo can be taken to be described by the NFW model (Navarro et al., 1997). Several other choices such as a power-law distribution are also available for modeling the mass distribution of the ICM, including dark matter.
The gas density distribution of the ICM is usually considered to be given by a -model profile
| (10) |
where is the spherical radius from the center of the ICM, is the mass density at the center of the ICM, is its core radius, and the parameter describes the rate of decrease of density at large distances. We set , , and in this work. The -model is a simple analytic fit to the mass profile of the ICM, assuming it is spherically symmetric and isothermal, rather than a fully realistic realization of the density structure in a particular cluster.
The hot gas of the ICM is in spherical hydrostatic equilibrium within the gravitational potential of the static dark matter halo
| (11) |
The dynamical equilibrium of the gas is attained by introducing an external force which compensates initial pressure gradients in all the directions and keeps the gas stationary everywhere.
In the nonrelativistic regime () applicable to the ICM, the thermodynamic variables become , , and , so these variables are assumed to be constant in the ICM. Following Reynolds et al. (2002), these assumptions give us the gravitational potential as
| (12) |
where the subscript stands for the ambient gas and the thermodynamic variables are set to , , and . Since the gravitational potential is determined by the mass distribution of the background dark matter, the self-gravity of the ICM can be taken to be negligible.
The initial distributions of gas density, gravitational potential, and gas pressure along the radial direction are shown in Figure 1. The hydrostatic equilibrium is initially maintained in all the directions under the gravity and this keeps the structure of the ICM stationary. Since we set , , and in our models, the units of all physical quantities are arbitrary and can be easily converted to any specific physical units.

2.3 Numerical models
To carry out the numerical simulations of the relativistic jets in the ICM, we used the multidimensional relativistic hydrodynamic code described in Choi & Wiita (2010). The numerical code is based on the HLL scheme (Harten et al., 1983) with the estimates of the wave speeds from Einfeldt (1988) and is fully explicit and second-order accurate in space and time. It incorporates the analytical formulation of the general equation of state for a multi-component relativistic gas, so that it is efficient and suitable for numerical relativistic hydrodynamics and gives accurate thermodynamic results for relativistic astrophysical flows. The code was extensively tested and its ability was demonstrated in a variety of relativistic test problems including highly relativistic shock tubes with tangential velocities.
The jet models considered here include a hot leptonic jet, a hot baryonic jet, a cold leptonic jet, and a cold baryonic jet defined according to the beam internal energy and the plasma composition of the jet. The models have beam density for the hot models and for the cold models, beam velocity , and beam pressure for the hot models and for the cold models, where is the pressure at the center of the ICM. The model parameters correspond to a density contrast for the hot models and for the cold models, beam Lorentz factor , and pressure ratio for the hot models and for the cold models. This gives the beam Mach number and for the hot models, where is the beam sound speed and and for the cold models. We set (electron-positron gas) for the leptonic models and (electron-proton gas) for the baryonic models. Since our code holds in the limit where the composition of the plasma is fixed in space and time, the composition is evolved by a constant value in our simulations. In reality, however, the plasma composition may change due to fluid mixing or the creation or annihilation of electron-positron pairs. Nonetheless, this assumption of constant is a useful first order approximation in these simulations. The computational domain is a three-dimensional box spanning a size of , , and in Cartesian geometry with an uniform grid of cells. The jet has an initial beam radius (corresponding to cells), and is launched from an injection region at the origin where an inflow boundary condition is imposed, and propagates through the ambient medium along the -direction. Outflow boundary conditions are used at all boundaries except along the symmetry axis where reflecting boundary conditions are taken for the jet axis.
The kinetic luminosity of the beam obtained by integrating the energy flux over the beam cross section (Scheck et al., 2002) is given by
| (13) |
We have computed the kinetic luminosity of the beam by fixing the parameters of the background medium. We set cm-3 and kpc which are general values representative of galaxy clusters. The kinetic luminosity of the beam is then erg s-1 in all the models, which is a typical value for a powerful AGN jet in a cluster.
The physical parameters of each model are summarized in Table 1. In our simulations we considered four models of relativistic jets in the ICM as well as one model of the ICM with no injected jet to check that the background medium remains in hydrostatic equilibrium over the simulation time.
| Model | IC | HL | HB | CL | CB |
|---|---|---|---|---|---|
| – | |||||
| – | 2.29 | 2.29 | 2.29 | 2.29 | |
| – | 2.13 | 2.09 | 1.00 | 0.80 | |
| – | 1.57 | 1.58 | 2.55 | 2.97 | |
| – | 1.34 | 1.35 | 1.58 | 1.43 | |
| EOS | |||||
| 1.0 | 0.0 | 1.0 | 0.0 | 1.0 | |
| – | 1/16 | 1/16 | 1/16 | 1/16 | |
| 10 | 45 | 50 | 35 | 30 | |
| [ erg s-1] | – | 2.0 | 2.0 | 2.0 | 2.0 |
Note - The model designation indicates a hot (H) or cold (C) jet followed by a leptonic (L) or baryonic (B) plasma; the model of the ICM only (no jet injected) is designated by IC. The rows give from top to bottom the density contrast , the beam Lorentz factor , the pressure ratio , the beam Mach number , the relativistic adiabatic index of the beam , the type of the equation of state EOS, the relative fraction of proton and electron number densities , the beam radius , the simulation time , and the kinetic luminosity of the beam in units of erg s-1.
Figure 2 shows the relativistic adiabatic index of the beam, , as a function of the beam Mach number, , for the leptonic and baryonic models with different beam velocities. Discrepancies between the leptonic and baryonic models increase at high beam Mach numbers and reduce at low beam Mach numbers, where the value of asymptotically approaches . In our models the hot leptonic and baryonic models correspond to and and the cold leptonic and baryonic models correspond to and , respectively.

In order to track the evolution of the jet material we employed a passive mass fraction tracer which is evolved by means of an additional conservation equation . The mass fraction tracer is assigned to for material originating inside the beam injection region and to for ambient material elsewhere. We defined the beam density as the region where and the cavity density as the region where . When the numerical code integrates the conservation equation , where q is the state vector for the conservative variables, is the flux tensor, and S is the source vector introduced by gravity, the contribution of the source terms is included through a separate advection step in the code. That is, the state vector q is first updated by solving , via operator splitting and then the source vector S is added by solving , during the advection step.
3 Numerical results
We have run a total of five model simulations whose global parameters are summarized in Table 1. The first one, model IC, is a purely hydrostatic simulation, where we have verified that the density distribution of the ICM remains constant for the duration of the run. As the first simulation is just a check on the accuracy of our hydrostatic equilibrium, we will only discuss the other four simulations. The four simulations are of the evolution of relativistic jets with different compositions propagating through a decreasing density atmosphere of the ICM. The numerical resolution adopted in all the three-dimensional simulations does not allow for very detailed study of the complex fluctuations generated by the outflows. However, this resolution is comparable enough to resolve the jet dynamics and cavity evolution and appropriate for investigating the global properties of the outflows such as the averaged pressure profiles and total radio and X-ray intensity curves, which we discuss in the following subsections.
3.1 Dynamic evolutions
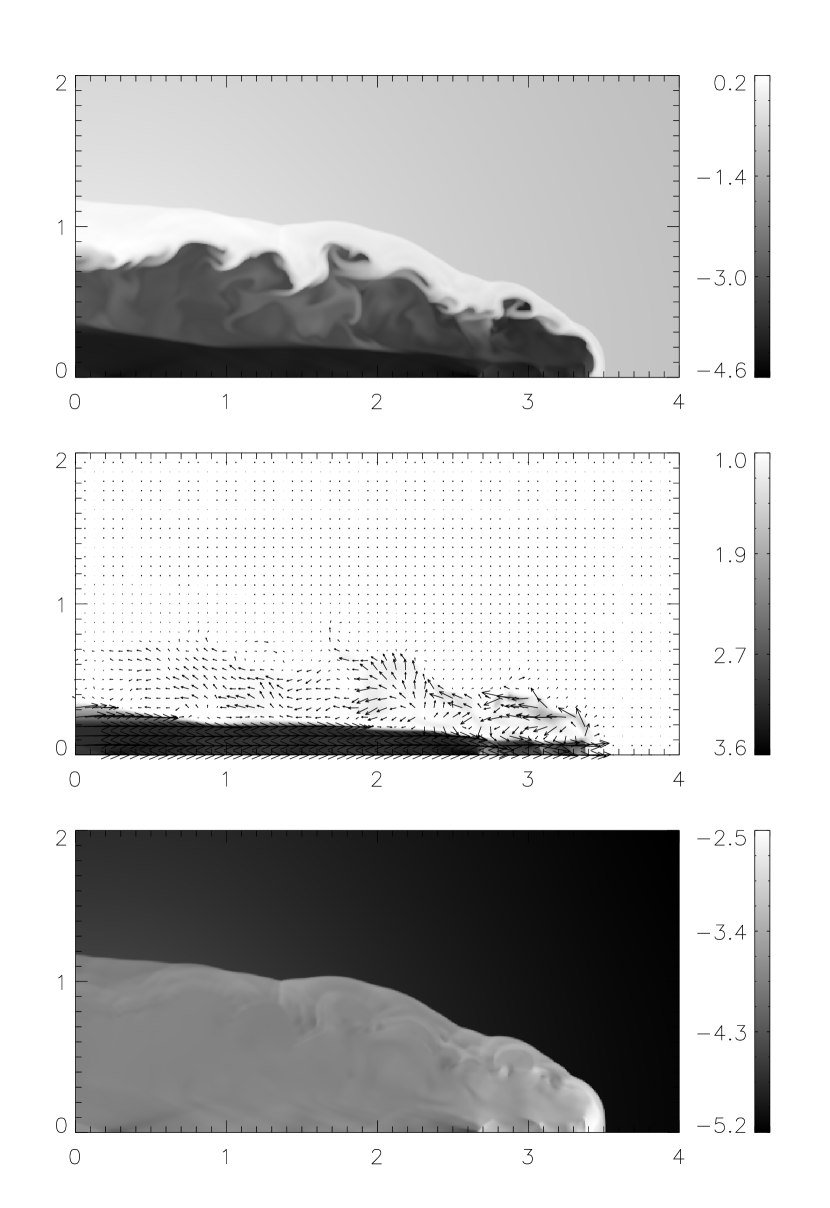
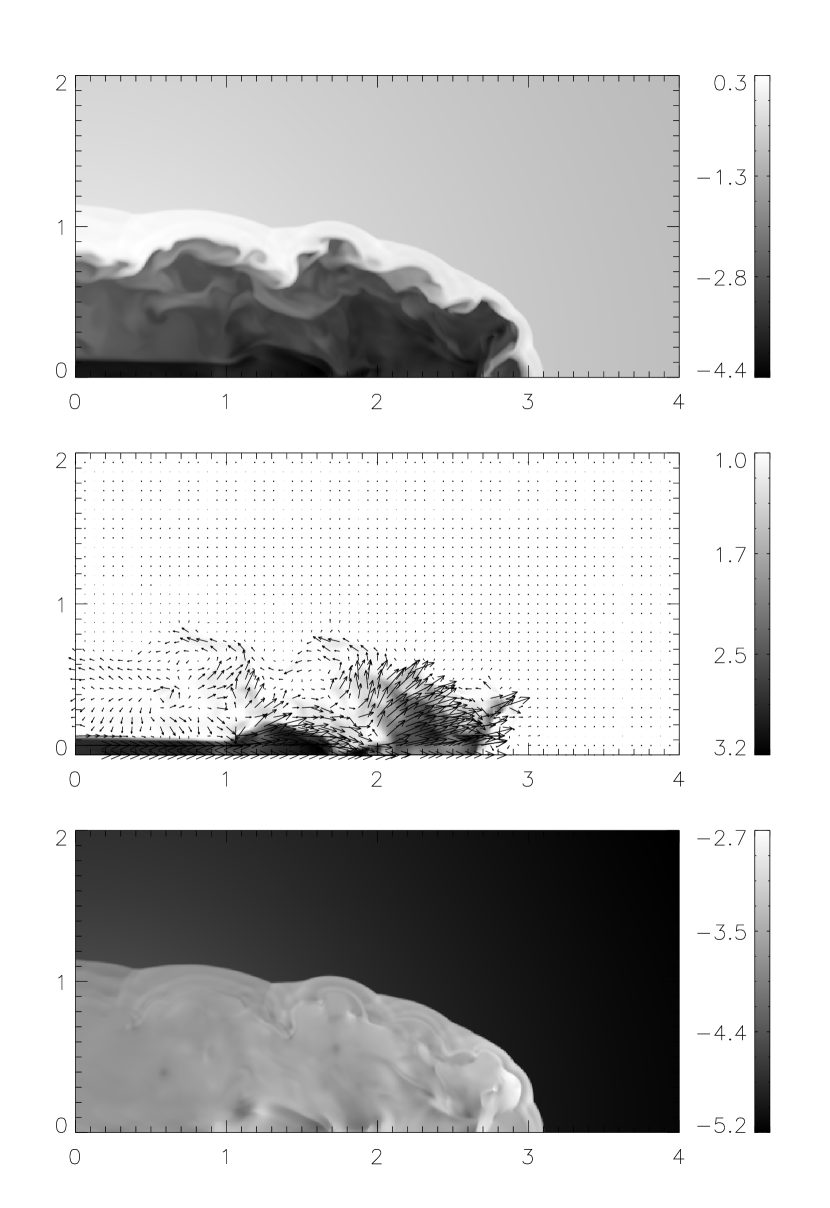
The images in Figure 3 display the logarithm of the rest mass density, the Lorentz factor overlaid with the velocity field, and the logarithm of the pressure on the plane in the three-dimensional computation domain at time for the hot leptonic jet of model HL and the hot baryonic jet of model HB. For each model, a bow shock that separates the shocked jet material from the shocked ambient medium is driven into the ambient medium. The beam itself is terminated by a Mach disk where much of the beam kinetic energy is converted into internal energy. The shocked jet material flows backward along the working surface into a cocoon, resulting in the development of turbulent vortices in the cocoon. The interaction of these vortices with the beam form oblique internal shocks inside the beam close to the terminal Mach disk, which causes the deceleration of the jet. These overall morphological features of hot leptonic and baryonic jets are similar to those of the hot relativistic jets with a constant adiabatic index studied by Choi et al. (2007). The models HL and HB, however, show some features that differentiate them in morphological and dynamical aspects. The hot leptonic jet propagates relatively faster, with the average velocity of jet head while the hot baryonic jet has . The hot leptonic jet model features a relatively narrower conical shape for the bow shock, while the hot baryonic jet model has a bow shock with a broader conical shape. The shapes of the cocoons and the internal structures of the beams are similar between the models HL and HB, even though they have different plasma compositions.
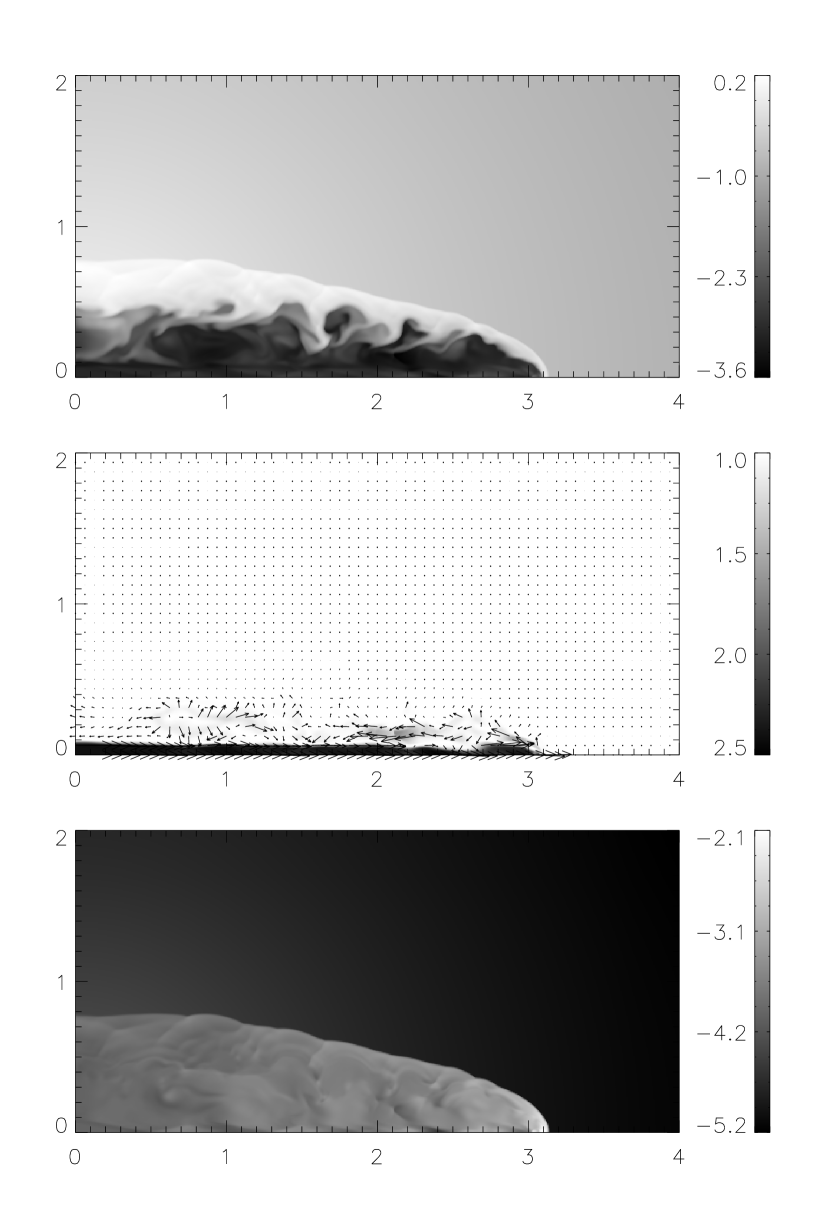
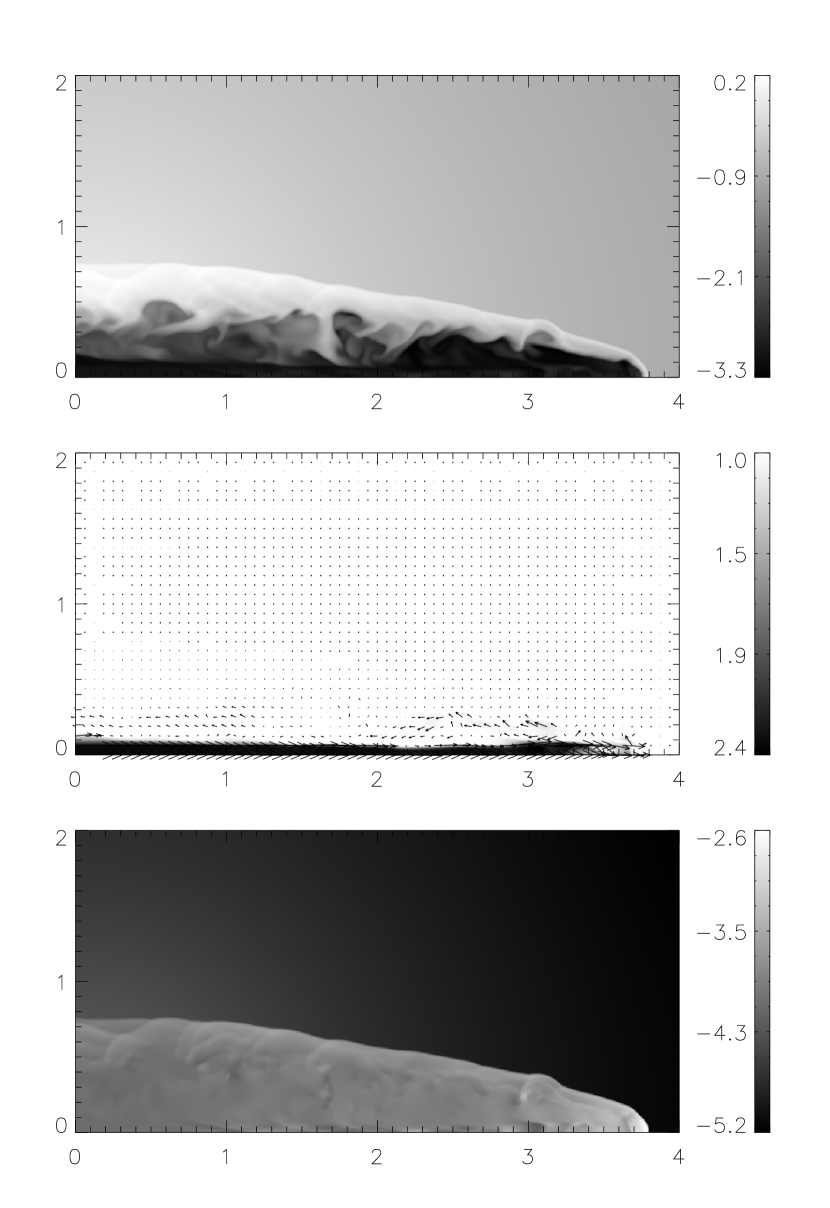
The images in Figure 4 show the logarithm of the rest mass density, the Lorentz factor with velocity field overlaid, and the logarithm of the pressure on the plane in the three-dimensional computation domain at time for the cold leptonic jet of model CL and the cold baryonic jet of model CB. The models CL and CB show specific differences in morphology and dynamics, which are dissimilar from the differences between the models HL and HB. The cold leptonic jet of model CL advances at the relatively slower velocity than does the cold baryonic jet of model CB with . The cold leptonic jet generates a slightly broader conical shape to a bow shock, and the cold baryonic jet makes a bow shock with a narrower conical shape. Although the morphological and dynamical differences in the jet head are distinguishable, the shapes of the cocoons and the internal structures of the beams are similar between the models CL and CB with different plasma compositions. In spite of their very different plasma compositions, the differences in morphology and dynamics are not significant between the leptonic and baryonic jets. In this investigation, the morphological and dynamical differences between the hot and cold jets are much more evident than those between the leptonic and baryonic jets. The cold jets propagate at faster speeds and produce narrower bow shocks and thin cocoons; on the contrary, the hot jets are characterized by slower advance velocities and broader bow shocks and thicker cocoons. The terminal Mach disk stands off farther behind the bow shock in the hot jet models while it is located quite close to the bow shock in the cold jet models. There are some differences in the evolution of the pressure between these simulations and those done by Scheck et al. (2002) and Perucho et al. (2014). The discrepancies are presumably caused by the use of different simulation parameters for the jets and ICM models and also by the adoption of different equation of state, but it is not possible to establish the dominant effect without conducting a substantial number of additional simulations.
We introduced several quantities to characterize some dynamical and morphological aspects of the different models. The axial length of the cavity is the head position of the jet, the -coordinate of the leading bow shock , in which and . The radial size of the cavity is the radial dimension of a cylinder that has the same volume and length as the cavity. The aspect ratio of the cavity is then defined by . A simple theoretical model for the evolution of the cocoon or cavity of AGN jets was described in Begelman & Cioffi (1989) and it was extended by Scheck et al. (2002) and Perucho et al. (2011). In this extended model, if the ambient density follows the power law , then the radial dimension of the cavity and the average cavity pressure follow
| (14) |
Thus the aspect ratio of the cavity is . The only free parameter of the extended model is the value of , and a power-law fit of the ambient density gives a value of for .
Figure 5 shows the evolution of the aspect ratio of the cavity as a function of time for all models. The axial length of the cavity increases with time monotonically until nearly reaches the core radius of the ICM (). During this phase the jets propagate with constant velocities of for hot models and for cold models. The next phase starts when is greater than the core radius of the ICM (), which corresponds to for the hot models and for the cold models. In this phase the jets accelerate progressively and the advance velocity increases by factors of up to for the hot models and up to for the cold models by the ends of the simulations. The evolutionary phases can be distinguished in the time evolution of the aspect ratio of the cavity . During the first phase increases with the predicted evolution until for the hot models and for the cold models. After that, neither the hot models nor the cold models follow the predicted evolution, mostly because of dynamical processes such as vortex shedding and mixing that affect . In particular, there are no significant evolutionary differences in between the leptonic and baryonic models although they have very different plasma compositions.

Figure 6 displays the temporal evolutions of the average cavity pressure of all models together with power-law evolution. The average cavity pressure decreases as a function of time with a power-law. The temporal evolution of is not consistent with that predicted by the extended model, and the average cavity pressure becomes nearly constant at the end of these simulations. Despite the continuous decreases in the cavity pressure, the cavity is still overpressured with respect to the surrounding medium at the end of simulations. Differing jet compositions do not lead to significant differences between the leptonic and baryonic models in the time evolutions of the average pressure of the cavity.

3.2 Radio and X-ray emissions
Under the assumptions that the AGN jet is optically thin and only the jet material produces nonthermal radio emission, we can compute the synchrotron emission in extragalactic jets (e.g., Mioduszewski et al., 1997). The synchrotron emissivity at frequency is approximately described in terms of the local thermal pressure
| (15) |
where is the spectral index. Since a power-law fit with is very close to steep spectrum observed in many radio galaxies over large ranges of frequency, we have used in this work (Wilson et al., 2013). By integrating the synchrotron emissivity in the volume element , the total synchrotron intensity is computed as , where is the Doppler boosting factor for a viewing angle .
The X-ray emission is entirely dominated by the hot ICM (e.g., Mendygral et al., 2011). Thermal bremsstrahlung or free-free emissivity is approximated as
| (16) |
where is the average temperature of the gas. The total X-ray intensity is then calculated as by numerically integrating the free-free emissivity in the volume element.
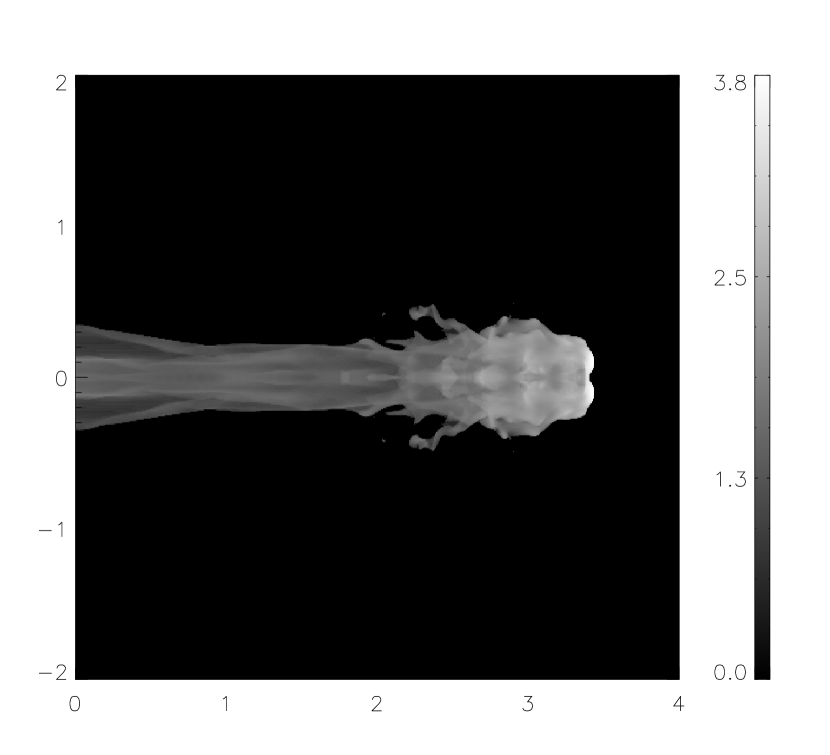
Figure 7 shows the synthetic radio image of the hot leptonic jet for a viewing angle of at . Doppler boosting has a little effect on the emission of the jet at the viewing angle of , so that the synthetic image is closely related to the intrinsic emissivity in the jet. Reducing the viewing angle, excessive Doppler boosting of the beam would outshine completely the diffuse emission from the cocoon. The synchrotron emission is dominated by the bright hot spot, where the pressure is maximum, while the beam and the cocoon show relatively weak emission features. The jet itself inflates a radio lobe aligned with the jet axis since most jet material is around the jet axis. In all the models, the radio image appears morphologically similar to observations of the extended radio emission from sources with collimated radio jets.
The total intensity curves of the radio emissions for all models are shown in Figure 8. Although there are quantitative differences among the models, the total intensity curves show qualitatively similar trends. The total radio intensity steeply increases as the jets emerge and build up the lobes in the nearly constant density medium and then gradually increases as the jets propagates through the ambient medium with declining density. Low-amplitude fluctuations of total radio intensity curves are seen in late epochs as a result of the onset of shocks. In our models, the effect of the composition of the jets does not lead to significant differences in the total intensity curves of the radio emissions even if the jets have different plasma compositions.
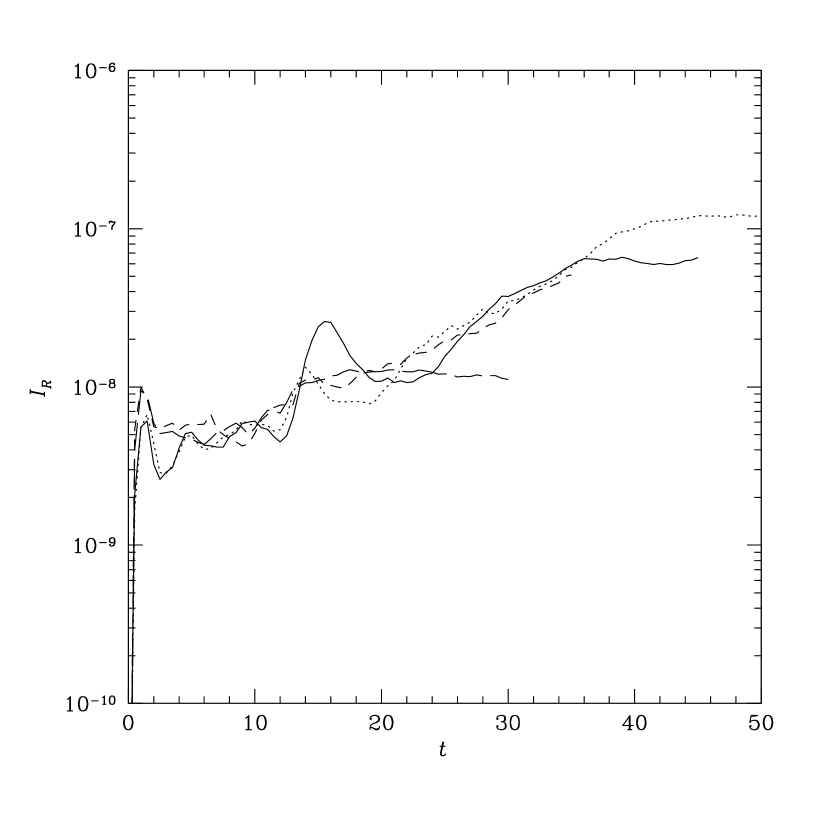
The bright radio lobe in the radio image is visible as dark region in the X-ray image, which appears morphologically similar to observations of X-ray cavities (e.g., Randall et al., 2011). This supports the hypothesis that the bow shock surrounding the head of the jet is the important mechanism for producing X-ray cavities in the ICM. The dominance of the X-ray emission from the bow shock is evident from the X-ray emission map as the bow shock outshines the cavity (Sanders et al., 2016). The X-ray emission of the bow shock decreases as the bow shock decreases in strength. Figure 9 shows the total intensity curves of the X-ray emissions for each of the models. The X-ray intensity curves do not fall off for any of the models although the jets produce the X-ray cavity in the external medium. This implies that the total X-ray emissions may subside only very gradually after the jets interact with the ICM.

4 Discussion and conclusion
We have performed the first three-dimensional relativistic hydrodynamic simulations of extragalactic jets with different plasma compositions in a hydrostatic ICM environment. The numerical simulations use a general equation of state for a milti-component relativistic gas that closely approximates the Synge equation of state for a relativistic perfect gas. We have considered four models of hot and cold jets made of pure leptonic and baryonic plasma compositions, propagating in a hydrostatic intracluster atmosphere with decreasing density and pressure profiles.
In our investigation, morphological and dynamical differences between the hot and cold jets are much more evident than those between the leptonic and baryonic jets. The cold jets propagate at faster velocities than do the hot ones, producing narrower bow shocks and thiner cocoons. The hot jets with slower advance velocities are dominated by broader bow shocks and thicker cocoons. Between the hot models, the leptonic jets advance slightly faster and generate bow shocks with relatively narrower conical shapes than do the baryonic jets, but these features are reversed in the cold models. In spite of very different plasma compositions, the differences in morphology and dynamics are not significant between the leptonic and baryonic jets. In all these models the jets propagate with constant velocities until the axial length of the cavity nearly reaches the core radius of the ICM and then the jets accelerate until the jet advance velocities increase by factors of about to by the end of simulations. The temporal evolutions of the average cavity pressure does not agree very well with the power-law prediction of the extended theoretical model of Scheck et al. (2002) and Perucho et al. (2011). Differences in the composition of the jet do not lead to significant differences in the time evolutions of the average pressure of the cavity.
The radio image appears morphologically similar to observations of the extended radio emission with collimated radio lobes. The bright radio lobe should appear as a dark region in the X-ray image, which indicates that the bow shock surrounding the head of the jet is the important mechanism for the production of X-ray cavities in the ICM. Although there are quantitative differences among the models the total radio and X-ray intensity curves show qualitatively similar trends for all the models we considered. The total radio intensity steeply increases at early times in the evolution of the jets as the jets emerge through the ambient medium, but it then gradually increases with overlaid low-amplitude fluctuations as the jets propagates through the ICM. The X-ray intensity curves do not fall off, which implies that the X-ray emissions may decline only very gradually after the jets produce the X-ray cavity in the ICM, as compression and heating of the remaining ICM can compensate for the loss of flux from the lobe region.
We only use one, albeit typical, hydrostatic cluster setup for our simulations; however, we recognize that the evolution of AGN jets can be quite different in a dynamic ICM, such as that produced during and following the merger of clusters (Roettiger et al., 1997) or a cosmologically evolved galaxy cluster (Morsony et al., 2010). Furthermore, the simulations presented here do not include magnetic fields. Even if the jet evolution is not dominated by magnetic fields, the presence of weak magnetic fields should affect the interaction of jet and cluster material and can change their evolution (e.g., McKinney & Blandford, 2009). The full three-dimensional relativistic magnetohydrodynamic simulations of jets in realistic clusters should be performed in order to understand the effect of magnetic fields on jet and cluster evolutions as well as the role of irregular ambient media in the structure and dynamics of the jets. Such simulations could be crucial for more complete picture of the evolution of AGN jets in the ICM and their impact on the galaxy cluster.
Acknowledgments
We thank Paul Wiita for useful comments that improved the presentation of the paper. This work was supported by the National Research Foundation of Korea grant funded by the Korean Government (NRF-2009-351-C00029).
References
- Basson & Alexander (2003) Basson J. F., Alexander P., 2003, MNRAS, 339, 353
- Begelman & Cioffi (1989) Begelman M. C., Cioffi D. F., 1989, ApJ, 345, L21
- Blandford & Rees (1974) Blandford R. D., Rees M. J., 1974, MNRAS, 169, 395
- Blanton et al. (2009) Blanton E. L., Randall S. W., Douglass E. M., Sarazin C. L., Clarke T. E., McNamara B. R., 2009, ApJ, 697, L95
- Cattaneo & Teyssier (2007) Cattaneo A., Teyssier R., 2007, MNRAS, 376, 1547
- Choi & Wiita (2010) Choi E., Wiita P. J., 2010, ApJS, 191, 113
- Choi et al. (2007) Choi E., Wiita P. J., Ryu D., 2007, ApJ, 655, 769
- De Young (2006) De Young D. S., 2006, ApJ, 648, 200
- Einfeldt (1988) Einfeldt B., 1988, SIAM J. Numer. Anal., 25, 294
- Fabian et al. (2000) Fabian A. C. et al., 2000, MNRAS, 318, L65
- Fabian et al. (2006) Fabian A. C., Sanders J. S., Taylor G. B., Allen S. W., Crawford C. S., Johnstone R. M., Iwasawa K., 2006, MNRAS, 366, 417
- Forman et al. (2007) Forman W. et al., 2007, ApJ, 665, 1057
- Gaspari et al. (2011) Gaspari M., Melioli C., Brighenti F., D’Ercole A., 2011, MNRAS, 411, 349
- Hardcastle & Krause (2013) Hardcastle M. J., Krause M. G. H., 2013, MNRAS, 430, 174
- Harten et al. (1983) Harten A., Lax P. D., van Leer B., 1983, SIAM Rev., 25, 35
- Heinz et al. (2006) Heinz S., Brüggen M., Young A., Levesque E., 2006, MNRAS, 373, L65
- Hwang & Noh (2016) Hwang J., Noh H., 2016, ApJ, 833, 180
- Komissarov & Falle (1998) Komissarov S. S., Falle S. A. E. G., 1998, MNRAS, 297, 1087
- Mathews (1971) Mathews W. G., 1971, ApJ, 165, 147
- McKinney & Blandford (2009) McKinney J. C., Blandford R. D., 2009, MNRAS, 394, L126
- Meliani et al. (2008) Meliani Z., Keppens R., Giacomazzo B., 2008, A&A, 491, 321
- Mendygral et al. (2011) Mendygral P. J., O’Neill S. M., Jones T. W., 2011, ApJ, 730, 100
- Mignone & McKinney (2007) Mignone A., McKinney J. C., 2007, MNRAS, 378, 1118
- Mioduszewski et al. (1997) Mioduszewski A. J., Hughes P. A., Duncan G. C., 1997, ApJ, 476, 649
- Morsony et al. (2010) Morsony B. J., Heinz S., Brüggen M., Ruszkowski M., 2010, MNRAS, 407, 1277
- Navarro et al. (1997) Navarro J. F., Frenk C. S., White S. D. M., 1997, ApJ, 490, 493
- Omma et al. (2004) Omma H., Binney J., Bryan G., Slyz A., 2004, MNRAS, 348, 1105
- Perucho et al. (2014) Perucho M., Martí J. M., Quilis V., Ricciardelli E., 2014, MNRAS, 445, 1462
- Perucho et al. (2011) Perucho M., Quilis V., Martí J. M., 2011, ApJ, 743, 42
- Randall et al. (2011) Randall S. W. et al., 2011, ApJ, 726, 86
- Reynolds et al. (2001) Reynolds C. S., Heinz S., Begelman M. C., 2001, ApJ, 549, L179
- Reynolds et al. (2002) Reynolds C. S., Heinz S., Begelman M. C., 2002, MNRAS, 332, 271
- Roettiger et al. (1997) Roettiger K., Loken C., Burns J. O., 1997, ApJS, 109, 307
- Rossi et al. (2008) Rossi P., Mignone A., Bodo G., Massaglia S., Ferrari A., 2008, A&A, 488, 795
- Sanders et al. (2016) Sanders J. S., Fabian A. C., Russel H. R., Walker S. A., Blundell K. M., 2016, MNRAS, 460, 1898
- Scheck et al. (2002) Scheck L., Aloy M. A., Martí J. M., Gómez J. L., Müller E., 2002, MNRAS, 331, 615
- Synge (1957) Synge J. L., 1957, The Relativistic Gas. Amsterdam, North-Holland
- Vernaleo & Reynolds (2006) Vernaleo J. C., Reynolds C. S., 2006, ApJ, 645, 83
- Wilson et al. (2013) Wilson T. L., Rohlfs K., Hüttemeister S., 2013, Tools of Radio Astronomy, 6th ed. Springer
- Wise et al. (2007) Wise M. W., McNamara B. R., Nulsen P. E. J., Houck J. C., David L. P., 2007, ApJ, 659, 1153