Multiple kinematical populations in Vela OB2 from Gaia DR1 data
Abstract
Context. Recent results using radial-velocity measurements from the Gaia-ESO Survey have led to the discovery of multiple kinematic populations across the Vela OB2 association. We present here a proper-motion study of the same region.
Aims. Our aim is to test whether the radial-velocity populations have a counterpart in proper-motion space, and if so, how the two sets of kinematical data complement each other.
Methods. This work is based on parallaxes and proper motions from the TGAS catalog, as part of Gaia DR1.
Results. Two distinct proper-motion populations are found dispersed across degrees (or pc at their likely distances). Their detailed correspondence to the radial-velocity populations could not be tested, because of the paucity of common objects. However, compelling indications are found that one of the new proper-motion populations consists mostly of members of the young cluster NGC 2547, and the other is related to the Vel cluster. Constraints on the age of the two populations, both of which appear to be only 10-35 Myr old, and their possible mutual interactions within the last 1.5 Myrs, are discussed.
Key Words.:
Open clusters and associations: individual (Vela OB2)1 Introduction
The Vela OB2 association spans a wide sky region, inside the Gum nebula (Pettersson 2008), and has been subject to an increasing number of studies in recent years. Its visually brightest member, the O8 III+Wolf-Rayet binary star Vel, was found to be surrounded by a cluster of lower-mass stars through X-ray observations (Pozzo et al. 2000). The Vel cluster was then studied, among others, by Jeffries et al. (2009), and more recently by Jeffries et al. (2014, 2017), as part of the Gaia-ESO Survey (Randich et al. 2013, Gilmore et al. 2012). This Survey provided precise radial-velocity data for hundreds of candidate members of the Vel cluster, enabling Jeffries et al. (2014) to find clear evidence of a double kinematical population, separated by km/s in radial velocity (termed Populations A and B) among the young (somewhere between 10-20 Myr – Jeffries et al. 2017), pre-main-sequence low-mass stars in the cluster. Population A was more spatially concentrated around Vel and had a significantly lower radial velocity dispersion than the more uniformly located population B. The sky region covered in this study had a size of approximately one square degree, thus much smaller than the size of the entire Vela OB2 association, as found e.g. by the Hipparcos-based study of de Zeeuw et al. (1999). Slightly later, still using data from the Gaia-ESO Survey, Sacco et al. (2015) found a similar duplicity in the kinematics of members of the young cluster NGC 2547 (age Myr, Jeffries and Oliveira 2005; distance pc, Naylor and Jeffries 2006), lying only 2 degrees south of Vel (distance pc, Jeffries et al. 2009). Two kinematic populations were found within 30 arcminutes of NGC 2547; the dominant one was associated with the cluster, but the second sparser group, separated in radial velocity by km/s, appears to be similar in age and kinematics to group B of the younger Vel cluster. Unfortunately, no additional Gaia-ESO Survey observations exist towards Vela OB2, most of which remains unexplored spectroscopically because of its large size.
The richness of kinematical signatures found in these studies motivated us to search for similar evidence among the newly released Gaia DR1 data (Gaia Collaboration 2016a,b), the so-called TGAS catalogue. Since the Tycho catalogue on which the Gaia DR1 is based only reaches down to , we do not expect to find the majority of the individual stars in the kinematical populations from Jeffries et al. (2014) and Sacco et al. (2015), since they are mostly fainter than this (). However, as we describe below, the Gaia proper-motion data show clear evidence of a double population in Vela OB2, with intriguing analogies with those from the Gaia-ESO Survey data.
2 The Gaia data
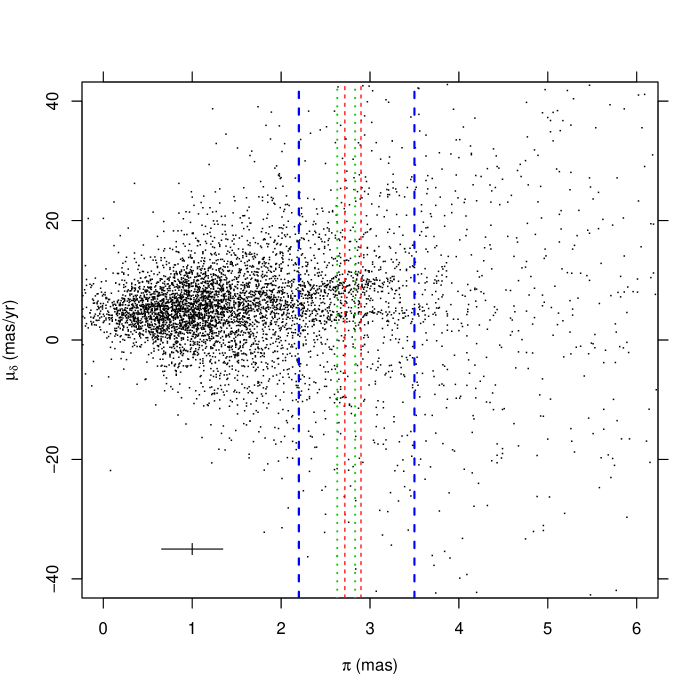
From the TGAS catalogue, we retrieved all entries within a radius of 4 degrees from the midpoint between Vel and NGC 2547 center, i.e. a center of coordinates . This sample comprises of 5785 TGAS objects. A diagram showing proper motion along Declination () vs. parallax () is shown in Figure 1. Close to the literature distances of Vel and NGC 2547 a characteristic pattern is found, with stars tending to regroup in two horizontal, narrow bands in the diagram. Therefore, we selected the subset of data within parallax limits mas (1084 stars), as suggested by the horizontal spread of the bands in the Figure. These rather generous limits are justified since the TGAS precision on parallax is much lower than that anticipated for the final Gaia data releases. The mean uncertainty on for the parallax-selected sample is 0.34 mas. However, the TGAS parallaxes are likely to have an additional systematic uncertainty of 0.3 mas (Gaia collaboration 2016b; Lindegren et al. 2016), and if we add this in quadrature our chosen parallax interval corresponds to a range, that would contain about 85 per cent of stars that are actually at the distance of Vel and NGC 2547, if the uncertainties are normally distributed.
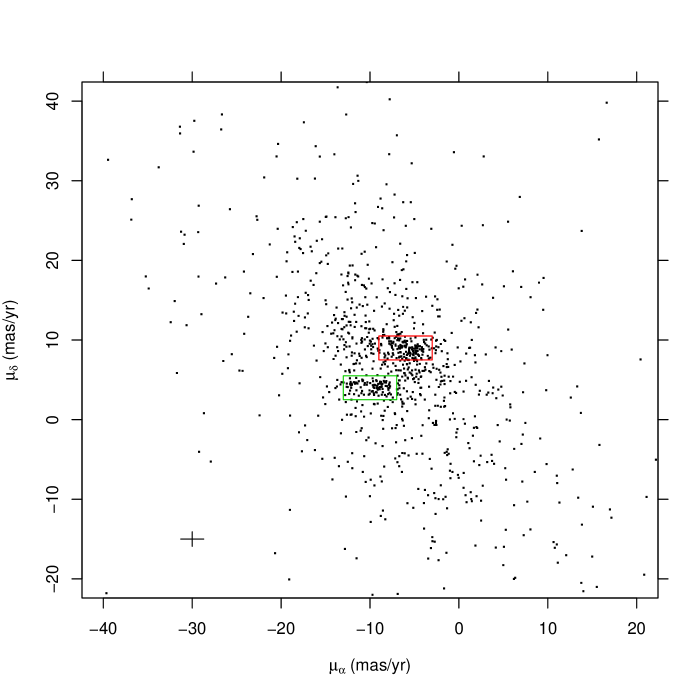
A proper-motion diagram (, ) for this parallax-selected subset is shown in Figure 2. This shows clearly the existence of two localized overdensities of datapoints against a much broader distribution of points (field stars). We therefore define from this diagram (and from the previous parallax limits) two populations, termed here C ( mas/yr and mas/yr), and D ( mas/yr and mas/yr). We use C and D to avoid confusion with the two populations (A and B) defined by Jeffries et al. (2014); we discuss below the possible connection between these pairs. Population C (D) comprises 148 (101) stars. We have tried to estimate the field-star contamination in these samples by considering TGAS stars, within the same parallax limits, falling in a rectangular region of the (, ) diagram intermediate between those enclosing populations C and D, that is mas/yr and mas/yr: 53 stars are found. This region has the same area in the (, ) plane as those enclosing populations C and D, so no area corrections are required. Therefore, the expected level of contamination is % for population C, and % for population D.
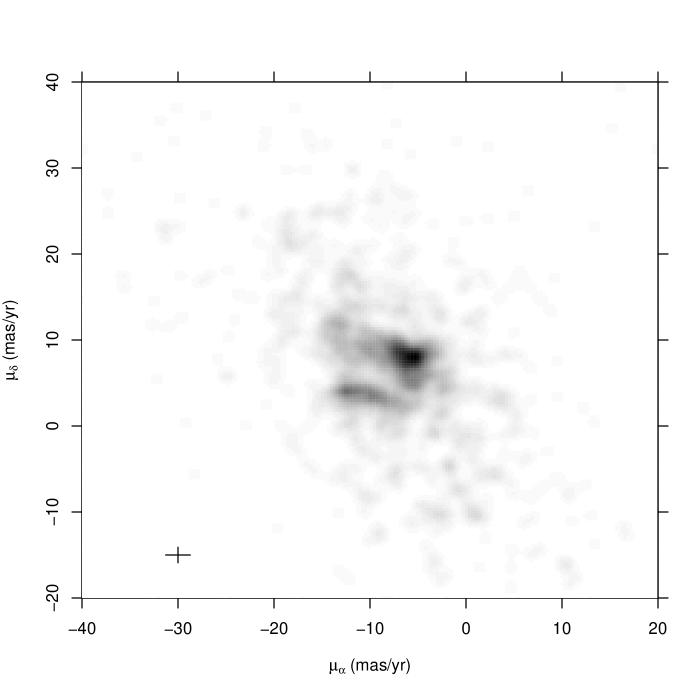
To help understand the spatial region where Populations C and D exist, we have repeated the same selection of TGAS stars, but now from an annulus surrounding the previous region, of () inner (outer) radius, which yielded the proper-motion diagram (, ) shown in Figure 3. Here, the two density peaks are no longer clearly recognizable: the two populations C and D are therefore mostly confined within the -radius circle (nearly 50 pc in diameter at the distance of Vel).

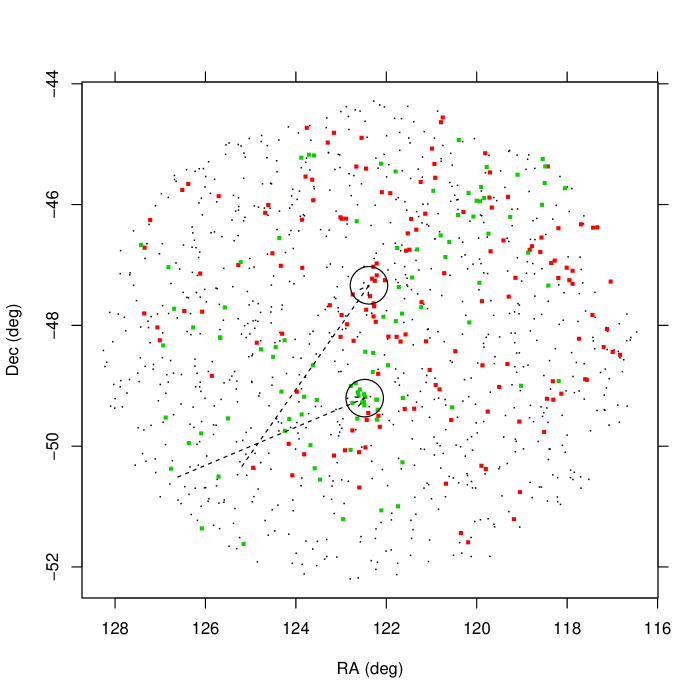
Inside this radius, however, the selected stars from populations C and D are distributed very inhomogeneously, as shown in Figure 4: the strongest clustering is found for a subset of population D stars (green dots), spatially coincident with the location of the NGC 2547 cluster (southern black circle in Fig. 4). This fact suggests that our population D is physically the same as the main kinematical population of this cluster, found by Sacco et al. (2015). Population C is instead not particularly clustered in or around the field studied by Jeffries et al. (2014); however, its proper motion is very similar to that of both populations A and B, from UCAC4 data (Jeffries et al. 2014), which have themselves indistinguishable proper motions within the UCAC4 errors (mean (,) equal to (-5.9 0.8, +8.5 1.0) and (-4.6 1.0, +8.7 0.9) mas/yr for populations A and B, respectively). We therefore tentatively associate population C with the Vel populations A and B cumulatively, and population D with NGC 2547. Figure 4 also shows that NGC 2547 is not the geometrical centroid of either population C or D, which are spread more towards the northern half of the surveyed region than south of NGC 2547. Such non-spherical geometry might suggest that radial expansion from a small region was not the origin of the large spatial extent of these populations.
There is only a very small number of common objects between populations C and D and stars in Jeffries et al. (2014: two matches), or Sacco et al. (2015: no matches), because of the small overlap between the TGAS and Gaia-ESO magnitude ranges. There are no additional matches even considering the Gaia-ESO targets in the NGC 2547 field not published in Sacco et al. (2015). The two matches with Jeffries et al. (2014) are stars TYC 8140-2731-1 and TYC 8140-6234-1 (2MASS J08094701-4744297 and J08092627-4731001, respectively), both belonging to population C. Jeffries et al. assign the second star to their population B (5% probability of belonging to population A), while the population of the first one is undetermined.
The contrast between the centrally-condensed distributions of members of Vel and NGC 2547 clusters, and the sparseness of both populations C and D renders questionable a one-to-one correspondence between the former and the latter. One possibility is then that each of populations C and D is actually composed of a concentrated and a more sparse component. To this aim we have considered separately, for each of populations C and D, stars within and outside a -radius circle around their respective centers (assumed to be the centers of Vel and NGC 2547 clusters). In doing so, the number statistics is reduced, and the relative level of field-star contamination becomes more important. The just-defined concentrated (sparse) population C contains 24 (124) stars, which likely contain 4 (49) contaminants. For population D we obtain 27 (74) concentrated (sparse) stars, of which 2 (51) are likely to be contaminants. It can therefore be seen that, although the sparse sub-populations contain in both cases the majority of members, their contamination level is far above those of the concentrated sub-populations. The number of field contaminants for each of the sparse sub-populations can be modeled as a random distribution with mean and std.dev. stars. The contamination-corrected numbers of stars in sparse sub-populations C and D (74 and 24 stars, respectively) would be significant at the 10.6 and 3.4 level, respectively. Although the existence of the sparse population D is only slightly above a safe confidence threshold, the distribution of datapoints in the (, ) plane after subtraction of the concentrated C and D sub-populations (Figure 5), still provides evidence for both C and D sparse sub-populations. Therefore, even if the properties of the sparse population D are ill-defined because of strong contamination, its existence is not greatly in doubt.
It may also be of some importance to consider the subsets of TGAS stars in our populations with Hipparcos data, and characterized by proper-motion measurements that are more precise by an order of magnitude than the other TGAS stars. These are 1 star (out of 24) for concentrated population C, 9 stars (out of 124) for sparse population C, 6 (out of 27) for concentrated population D, and finally 5 (out of 74) for sparse population D. The sparse population D is thus characterized by both a low number and small percentage of higher-quality proper-motion measurements, which adds to the difficulties in assessing its properties. For example, a comparison between the proper-motion distributions of sparse vs. concentrated D sub-populations would be vitiated by their different error distributions.
We have examined if any indications of expansion or contraction can be found from the TGAS data. Rather surprisingly, a contraction pattern for population C (only) is seen in ( negatively correlated with from Vel center), but not in , significantly above the quoted proper-motion random errors. However, the TGAS data in the region are affected by a known systematic correlation between exactly the same parameters, which might be entirely responsible for the observed effect.
3 Discussion
3.1 Age of kinematical populations
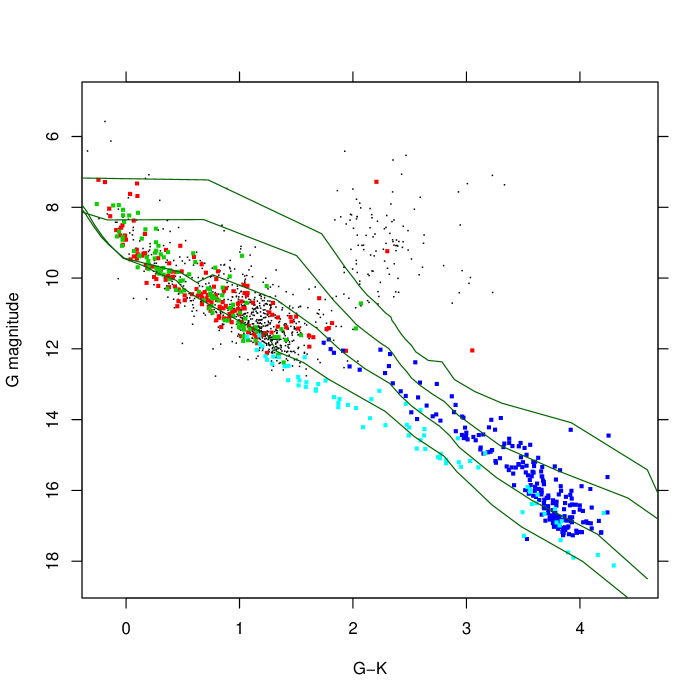
We have studied the placement of populations C and D on a color-magnitude diagram (CMD). We use the Gaia and the 2MASS band magnitudes to build the CMD shown in Figure 6. In the same Figure we also show the Vel and NGC 2547 cluster members from Jeffries et al. (2014) and Sacco et al. (2015), respectively.
Very few of our population-C or -D stars may be giants; on the other hand, these populations are rich in upper main-sequence stars. These features are consistent with a young age, like that of Vel and NGC 2547 clusters. A match with the SIMBAD database finds several tens matches for both population-C and -D stars, mostly of spectral type A or B. Therefore, we have overlaid the CMD in Figure 6 with pre-main-sequence evolutionary tracks from Siess et al. (2000), converted to the Gaia band following Jordi et al. (2010). These isochrones suggest that the ages of populations C and D are consistent with those of the Vel and NGC 2547 clusters. Some indication is also found of a slightly older age for population-D stars (again, best consistent with the NGC 2547 age) with respect to population-C stars (more similar to Vel cluster stars). To check this, we have performed a Kolmogorov-Smirnov test comparing the respective magnitude differences above the 30 Myr isochrone, in the range [1.0-2.0] which is most sensitive to ages in the 10-30 Myr range. The probability that the two samples come from the same parent population is found to be %. The same test applied to the range [1.0-1.7] gives %. Contamination of course acts in the sense of diluting actual differences, so we may conclude that there is a real age difference between populations C and D.
3.2 The recent past of populations C and D
Using their well-defined mean proper motions, we may trace back in time the apparent average positions of populations C and D over a few Myrs. The arrows in Figure 4 show the positions of Vel and NGC 2547 extrapolated back 1.1 Myr, using the (error-weighted) mean proper motions of concentrated populations C and D, having values (, ) = (-6.12, 9.80) and (-9.00, 4.27) mas/yr, respectively. This shows that their (sky-projected) distance is now slowly increasing, while it reached a minimum value of 0.65 degrees (4.04 pc) 1.1 Myr ago. This is a small enough value, compared to the apparent sizes of both Vel and NGC 2547 clusters, to expect a significant dynamical interaction between them, provided that also their distances from the Sun are (or were at that time) coincident within a few pc. An intriguing possibility is therefore that population B in the Vel cluster was originated from a tidal stripping event during a close encounter with the (denser) cluster NGC 2547. A difficulty with this hypothesis lies in the offset of the RV distribution of population B with respect to that of population A, whereas tidal stripping may be expected to create two symmetric (leading and trailing) tails.
To summarize, the Gaia DR1 data indicate that populations C and D had the highest probability of a mutual interaction in the past 1-1.5 Myr. Determining if this has actually taken place depends on a more accurate determination of the populations’ respective parallaxes, which are expected from future Gaia data releases.
The existence of the sparse population D appears sufficiently certain from the TGAS data; however, its properties could not be studied in any detail, because of the small number statistics and large field-star contamination. Future Gaia data releases will permit to determine its properties more accurately.
Acknowledgements.
We acknowledge useful suggestions from an anonymous referee. This work has made use of data from the European Space Agency (ESA) mission Gaia (http://www.cosmos.esa.int/gaia), processed by the Gaia Data Processing and Analysis Consortium (DPAC, http://www.cosmos.esa.int/web/gaia/dpac/consortium). Funding for the DPAC has been provided by national institutions, in particular the institutions participating in the Gaia Multilateral Agreement. This research has made use of the VizieR catalogue access tool, and of the cross-match service provided by CDS, Strasbourg, France.References
- de Zeeuw et al. (1999) de Zeeuw, P. T., Hoogerwerf, R., de Bruijne, J. H. J., Brown, A. G. A., & Blaauw, A. 1999, AJ, 117, 354
- Gaia Collaboration et al. (2016) Gaia Collaboration, Prusti, T., de Bruijne, J. H. J., et al. 2016a, A&A, 595, A1
- Gaia Collaboration et al. (2016) Gaia Collaboration, Brown, A. G. A., Vallenari, A., et al. 2016b, A&A, 595, A2
- Gilmore et al. (2012) Gilmore, G., Randich, S., Asplund, M., et al. 2012, The Messenger, 147, 25
- Jeffries & Oliveira (2005) Jeffries, R. D., & Oliveira, J. M. 2005, MNRAS, 358, 13
- Jeffries et al. (2009) Jeffries, R. D., Naylor, T., Walter, F. M., Pozzo, M. P., & Devey, C. R. 2009, MNRAS, 393, 538
- Jeffries et al. (2014) Jeffries, R. D., Jackson, R. J., Cottaar, M., et al. 2014, A&A, 563, A94
- Jeffries et al. (2017) Jeffries, R. D., Jackson, R. J., Franciosini, E., et al. 2017, MNRAS, 464, 1456
- Jordi et al. (2010) Jordi, C., Gebran, M., Carrasco, J. M., et al. 2010, A&A, 523, A48
- Lindegren et al. (2016) Lindegren, L., Lammers, U., Bastian, U., et al. 2016, A&A, 595, A4
- Naylor & Jeffries (2006) Naylor, T., & Jeffries, R. D. 2006, MNRAS, 373, 1251
- Pettersson (2008) Pettersson, B. 2008, Handbook of Star Forming Regions, Volume II, 5, 43
- Pozzo et al. (2000) Pozzo, M., Jeffries, R. D., Naylor, T., et al. 2000, MNRAS, 313, L23
- Randich et al. (2013) Randich, S., Gilmore, G., & Gaia-ESO Consortium 2013, The Messenger, 154, 47
- Sacco et al. (2015) Sacco, G. G., Jeffries, R. D., Randich, S., et al. 2015, A&A, 574, L7
- Siess et al. (2000) Siess, L., Dufour, E., & Forestini, M. 2000, A&A, 358, 593