epj \woctitleSeismology of the Sun and the Distant Stars 2016
What CoRoT tells us about Scuti stars
Abstract
Inspired by the so appealing example of red giants, where going from a handful of stars to thousands revealed the structure of the eigenspectrum, we inspected a large homogeneous set of around 1860 stars observed with CoRoT. This unique data set reveals a common regular pattern which appears to be in agreement with island modes featured by theoretical non-perturbative treatments of fast rotation. The comparison of these data with models and linear stability calculations suggests that spectra can be fruitfully characterized to first order by a few parameters which might play the role of seismic indices for stars, as and do for red giants. The existence of this pattern offers an observational support for guiding further theoretical works on fast rotation. It also provides a framework for further investigation of the observational material collected by CoRoT (Baglin2006 ) and Kepler (Borucki2010 ). Finally, it sketches out the perspective of using stars pulsations for ensemble asteroseismology.
1 Introduction
stars constitute a large class of pulsating stars representative of chemically normal intermediate mass stars on and near the main sequence (see eg Breger2000 , Rodriguez2001 ). Their seismic exploitation however meets major difficulties often refered to as ’the mode identification problem’, ’the fast rotation treatment’, and ’the selection effects’. These various expressions refer to two main difficulties. First, stars, as chemically normal A and early F stars are characterized by a large rotation rate (Royer2014 ) and the theoretical modelling of their pulsation spectra cannot rely on classical perturbative approaches (Lignieres2006 ,Reese2006 ). Then, although we understand the process responsible for their pulsational instability, we have very little insight about the process responsible for the amplitude limitation (see however recent studies by Barcelo2015 and Bowman2016 )and thus no clue about how amplitudes are distributed between modes and for different stars.
However, we do know a couple of things about these stars. First, there is increasing evidence that periodicities or regular spacings can be found in spectra (GarciaH2013 , Paparo2016 , Breger2011 ) and recently, GarciaH2015 demonstrated that this spacing is a good proxy of the mean density just as the large separation is for solar-like pulsators.
Then, linear stability calculations provide reliable results (Dupret2004 ) and it is appealing to use them to characterize stars in terms of mass range or evolution stage (see e.g. Michel1999 for stars in clusters and Zwintz2014 in the case of pre-main sequence stars).
In the present paper, we use a large set of homogeneous spectra observed with CoRoT (Baglin2016 ) to revisit these questions and see what CoRoT data tell us about stars.
2 The observational sample and the determination of , and .
The automated supervised classification of variable stars in the CoRoT programme (ASCVC hereafter, Debosscher2009 ) brings about 1860 objects classified as stars with a probability higher than 80. In comparison, catalogues before the space-photometry era gathered about 700 objects (Rodriguez2000 ), among which a large fraction had been discovered by large surveys like the Hipparcos (Perryman1997 ), OGLE (Udalski1997 ) and MACHO (Alcock2000 ) projects. The present CoRoT sample is thus very valuable in terms of number of objects and also in terms of homogeneity.
We computed the Fourier spectrum for each of these light-curves and we set to zero-amplitude the parts of the spectra possibly hampered by intrumental/environmental artefacts induced by the orbital period (see Auvergne2009 ). It consists in narrow intervals around the frequency of the orbital period plus its harmonics, each of them associated with a few daily aliases as it can be seen in figure 6. For each spectrum, we also exclude from our study the part below (also set to zero-amplitude) in order to avoid the influence on our analysis of possible power of instrumental or environmental origin at low frequency.
We define a limit amplitude criterion for peaks to be considered. Here we take the maximum between 10 times the mean amplitude level and the amplitude of the highest peak divided by 8. This last constraint aims at avoiding artefacts of large amplitude peaks convolved by the observational window.
Then, we determine for each spectrum the range of detected signal, noted , as the frequency range encompassing all peaks satisfying the previous amplitude criterion.
We also use these spectra to produce an index characterizing the amplitude of the oscillations. We considered two versions of this index. One is simply the amplitude of the highest peak. The second is the square root of the quadratic sum of amplitudes of all peaks satisfying our amplitude criterion. Interestingly, the results were found to vary at most by a factor two from one version to the other. In the present work, all results for refer to the square root of the quadratic sum, which we expect to be more stable a measurement and more representative of the energy involved in pulsation.
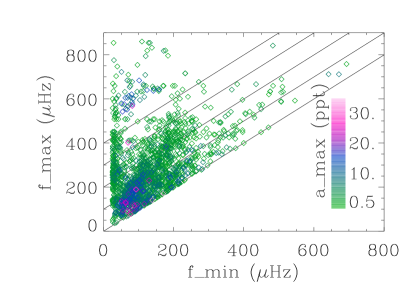
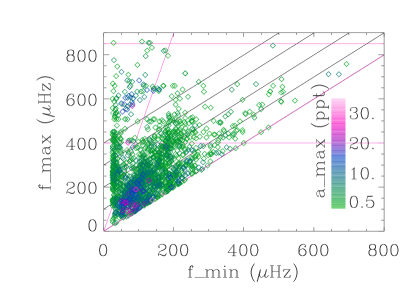
The results are presented in figure 1 and their interpretation in the light of theoretical models is discussed in Sect. 4.
3 Theoretical estimates of and
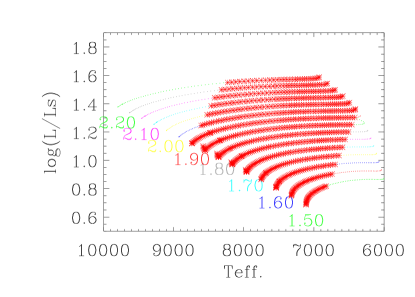
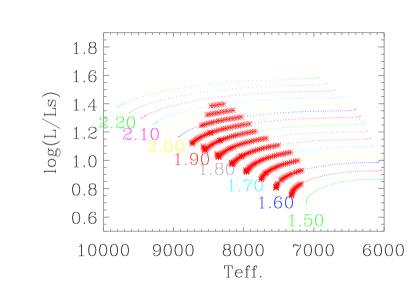
We used a grid of theoretical models representative of the whole stars instability strip for the main sequence evolution stage (see figure 2). This grid is the one used and described in Dupret2004 . The models have been computed with the code CLES (Scuflaire2008 ) The physics of the models is standard and the only specific aspects of interest at the level of the present study are: the use of overshooting with and the mixing length parameter which has been set to the solar calibrated value 1.8. The metallicity (Z=0.02) had been chosen as representative of the solar one in Dupret2004 . Here again, the change for a more up-to-date value would not change significantly our results. The linear stability of the modes has been obtained following (Dupret2004 , Grigahcene2005 ).
These linear stability calculations are used to derive theoretical counterparts of the and values obtained for observed stars in Sect. 2. They have been determined on modes of degree and are illustrated in figure 3.
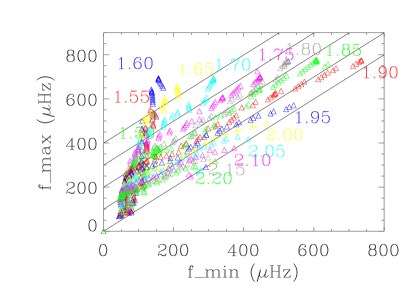
When looking at figure 3, it is clear that, for sequence of models of given mass, the position in the diagram changes under two effects. One is the decrease of mean density (or the decrease of ) with evolution. The second is associated with the gradual decrease of the radial orders of unstable modes, as the star crosses the instability strip from the blue to the red border, as described in Ref Dupret 2004. Both effects globally induce a decrease of and with age on the main sequence.
It is also worth noticing that, evolution sequences entering the instability strip through the so-called blue border (i.e. masses higher than ) correspond, in the diagram, to sequences starting on the central axis, i.e. with a very narrow frequency range of unstable modes.
On the contrary, evolution sequences starting on the ZAMS in the instability strip (i.e. masses between 1.5 and 1.9) correspond, in the diagram, to sequences starting at high values, i.e. with a larger frequency range of unstable modes and thus farther from the central axis.
Finally, we can also notice that, with the evolution, all sequences tend to converge at low and in the diagram, those going out of the instability strip through the red border corresponding to sequences terminating on the central axis.
We take as a work hypothesis that the rotation will not impact drastically these theoretical estimates of and values. Rotational splitting is expected to extend the observed range of observed peaks by an amount which is difficult to estimate precisely in the present state of our knowledge, but should be, in the worst case, of the order of a few times the rotation frequency, i.e. a few times 10 to 20 for the fastest rotating objects. This is not negligible, but if this extension remains below 50 for most of the stars, the diagram remains discriminent in terms of evolution stage and mass range, as can be seen in figure 3.
4 Comparison of observational and theoretical diagrams
When comparing figure 1 and figure 3 in the light of previous remarks, we notice a few differences and similarities. The set of observed stars shows components in the diagram which are not present for the models. The main difference consists in a vertival ridge observed at low (below 50) in figure 1. This accumulation ridge could be due to an edge effect induced by the processing of spectra described in Sect. 2, when we fix the value to prevent our analysis from the influence of possible low frequency noise. However, we should keep in mind that this ridge is also the place where we should expect hybrid - stars. In addition to the modes characterizing stars, these objects present low-frequency pulsation modes not considered unstable in our models. A closer inspection of these spectra will be necessary to explore this possibility.
The second component presented by the observed set of stars and not by the models is much less important in numbers. It appears as a cloud of points around the upper left corner of figure 1, i.e. stars with values bellow 200 and values between 500 and 900. As it reads from the oblique lines in figure 1, this corresponds to extremely large estimates of frequency range value (). The inspection of several spectra suggests that, to a large extent, these values could be due to the poor handling of particularly severe window-artefacts by the data processing presented in Sect. 2. This is supported by the presence of a significant fraction of spectra with high values among those points.
Beside this, the diagram for observed stars and the one for models look in reasonably good agreement, with a scarce distribution of points at high and values, where evolution sequences are highly spread in mass and age in figure 3, and a denser concentration of points at low values, where the evolution sequences tend to converge.
4.1 Amplitude of the oscillations versus evolution.
It is worth noticing that the distribution of shows a clear gradient (from 0.1 to 40 part-per-thousand, ppt hereafter) with increasing amplitude values toward low values of and . As we already commented, according to the theoretical diagram, this domain of the diagram is expected to host rather evolved stars.
The fact that evolved stars tend to show higher amplitudes than main sequence ones has been observed for long (see e.g. Rodriguez2001 ), but to our knowledge, this trend has never been observed with such a resolution in amplitude and on such a large sample of objects. In the case of Kepler data, Balona2011 considered about 1570 objects, but a large fraction of them (1150) were observed in the so-called long cadence mode, i.e. with a 30 minutes sampling time which is not suited to address frequencies higher than 270. These data will thus be very helpful to study stars, but mostly evolved ones.
4.2 Evidence of a regular frequency pattern in early main sequence stars.
Models off the main sequence are not produced here, but we have inspected several such sequences, and they are always found in the domain of low and . Even with (no overshooting), which corresponds to the shortest extension of the main sequence, post-main sequence models seem to remain below the limit.
We now consider stars with , i.e. for which, according to models, and values correspond unambiguously to main sequence models, whatever the amount of overshooting considered. As illustrated in figure 4 , we also avoid spectra with dubious values as discussed in Sect. 2. The domain of the HR diagram corresponding to this selection in the case of models presented here is illustrated in figure 5.
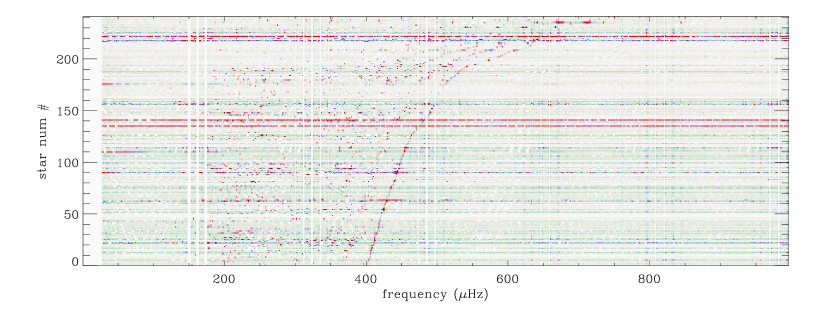
For this set of about 200 stars, we build an image presented in figure 6, where each amplitude spectrum is a line where amplitude is limited to an arbitrary value (here ) and coded in grey scale. The full image thus presents more than 200 spectra, sorted by increasing value from the bottom to the top.
In figure 6, we distinguish a few ridges approximately parallel to the ridge drawn by peaks associated with values. These ridges separated by a few tens of immediately recall the quasiregular pattern of axisymmetric island modes as described by nonperturbative calculation of fast rotators (Reese2008 and Ouazzani2015 ). They also recall the various detection of spacings of the order of the large separation in stars (GarciaH2015 ,Paparo2016 )
The pattern associated with these ridges has to be common to a sufficient fraction of our stellar sample to show up in figure 6. This suggests that this quasiregular pattern of peaks has to be, to some extent, independent of rotation, which necessarily varies from one star to another.
Axisymmetric modes are good candidates to explain this pattern as we will show hereafter.
An appealing idea is that the eigenspectra of axisymmetric modes of the different stars could be, at first order, homologous and thus distributed according to a common pattern of peaks, just multiplied by a different value of the large separation (or mean density).
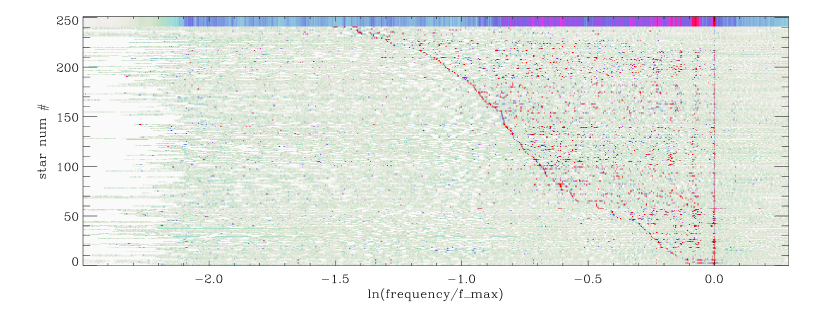
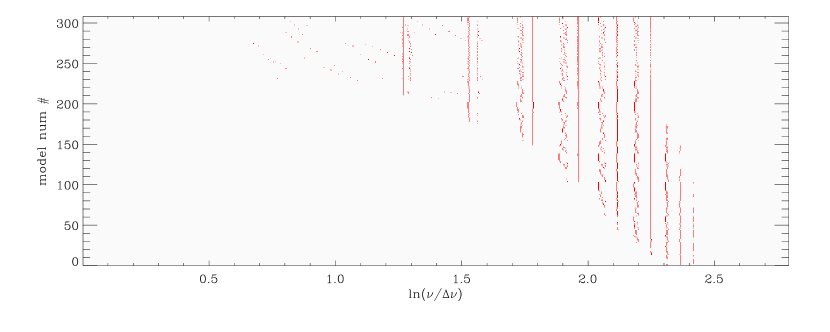
In order to test a bit further this idea, we rescaled the (observational) spectra, taking in abscissae the logarithm of frequency instead of the frequency itself. If our hypothesis is correct, the rescaled eigenspectra should show a similar pattern, just shifted by an amount depending on (the logarithm of) the individual large separation value. These rescaled spectra are presented in figure 7 where they have been shifted according to their individual value. Here the sequence of ridges is more visible even if the pattern remains blured at low abscissae.
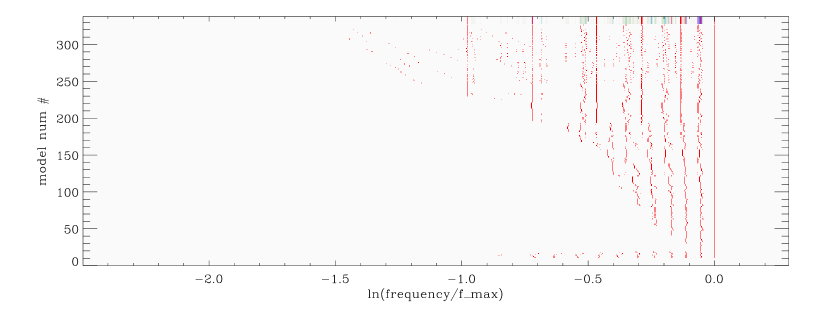
We treated the same way the theoretical spectra associated with the set of models shown in figure 5 (models satisfying the same criterion than our subsample of stars). Here again, we considered only unstable axisymmetric (m=0) l=0,1,2 modes. The result is presented in figure 8.
The figure 7 and figure 8 show great similarities with a few clear ridges near zero in abscissae followed by a less clear pattern. In fact, we have to pay attention to the fact that all these stars do not have the same range of unstable radial orders and this makes the superposition of the spectra less clear. This is demonstrated in figure 9, where the theoretical spectra this time are normalized by instead of . The ridges are much clearer now. This shows that (for models without rotation) a common pattern exists and is not too much distorted by the structural changes of models in the early main sequence.
In order to illustrate the anticipate impact of rotation on this comparison, we added at the bottom of figure 8 (between line 10 and 18), the pattern obtained for axisymmetric (l̃=0) island modes (see Lignieres2009 ) in 9 models based on the Self-Consistent Field (SCF) method (MacGregor2007 ). These models are ZAMS 2, ranging from 0 to 80% of the break-up rotation rate. These eigenfrequencies are shown to illustrate the effect of rotation on the pattern, but these modes are not necessary unstable.
We see that the regular pattern is preserved to a good extent over this large range of rotation. In fact, at low radial order, the distribution of the modes appears even more regular than the one of models without rotation.
To conclude with this point, it seems important to stress that the spectra considered in this study obviously show numerous peaks outside of the common quasiregular pattern revealed by figure 6 or figure 7. On the other hand, these figures do not suggest either that the modes associated to this pattern are systematically expressed (with detectable amplitude). However these results suggests that this pattern is characteristic of the eigenspectra of chemically normal early main sequence stars.
5 Conclusions
We used a homogeneous set of about 1860 stellar light curves collected with CoRoT for stars classified as stars with a probability higher than 80 by the automated supervised classification of variable stars in the CoRoT archive.
We have characterized these spectra in terms of range of observed frequencies, defining two parameters, and . The distribution of our sample of stars in a diagram appears to be consistent with the one obtained from a grid of theoretical models and linear stability calculations. This suggests that values could be used to characterize a specific mass range or evolution stage.
Based on this criterion, we have selected stars that we consider to be on the early main sequence. We have shown that their spectra reveal a common pattern modulated by individual large separation values. The existence of regularities in the spectra of stars has already been demonstrated by several studies. It has even been demonstrated that this spacing is compatible with the classical large separation index used for solar-type pulsators and that rotation does not hamper the use of this index. Here the ridges we find for a large sample of stars confirm these results, but in addition, we show on a large set of objects that these regularties are due to a regular pattern of consecutive peaks which is compatible with patterns expected for axisymmetric island modes as suggested by recent non-perturbative modelling of fast rotating stars (Reese2009 ).
We still need to improve our knowledge and parametrisation of this pattern in synergy with further theoretical work on fast rotation. This study obviously would benefit from being extended to an even larger set of stars. The extension of this work to data is not expected to change considerably the case of the early main sequence stage since the high frequencies characterizing this domain are not accessible with the sampling time of long cadence data which constitute the essential of data. However, in the difficult part of the diagram corresponding to evolved stars, the data might be of great help.
This suggests that and as well as large separation values might be used as seismic indices to characterize stars and this open the perspective for ensemble seismology using stars.
The CoRoT space mission, launched on December 27th 2006, has been developed and is operated by the Centre National dâEtudes Spatiales (CNES), with contributions from Austria, Belgium, Brazil, the European Space Agency (RSSD and Science Programme), Germany and Spain. We acknowledge the support from the EC Project SpaceInn (FP7-SPACE-2012-312844). EM, KB, RS and DR acknowledge the support from the Programme de Physique Stellaire (PNPS). AGH acknowledges support from FundaÃão para a CiÃncia e a Tecnologia (FCT, Portugal) through the fellowship SFRH/BPD/80619/2011. JCS acknowledges funding support from Spanish public funds for research under project ESP2015-65712-C5-5-R (MINECO/FEDER), and under Research Fellowship program âRamÃn y Cajalâ (MINECO/FEDER).
References
- (1) A. Baglin, M. Auvergne, P. Barge, M. Deleuil, C. Catala, E. Michel, W. Weiss, COROT Team, Scientific Objectives for a Minisat: CoRoT, in The CoRoT Mission Pre-Launch Status - Stellar Seismology and Planet Finding, edited by M. Fridlund, A. Baglin, J. Lochard, L. Conroy (2006), Vol. 1306 of ESA Special Publication, p. 33
- (2) W.J. Borucki, D. Koch, G. Basri, N. Batalha, T. Brown, D. Caldwell, J. Caldwell, J. Christensen-Dalsgaard, W.D. Cochran, E. DeVore et al., Science 327, 977 (2010)
- (3) M. Breger, Scuti stars (Review), in Delta Scuti and Related Stars, edited by M. Breger, M. Montgomery (2000), Vol. 210 of Astronomical Society of the Pacific Conference Series, p. 3
- (4) E. Rodríguez, M. Breger, A&A366, 178 (2001)
- (5) F. Royer, M. Gebran, R. Monier, S. Adelman, B. Smalley, O. Pintado, A. Reiners, G. Hill, A. Gulliver, A&A562, A84 (2014), 1401.2372
- (6) F. Lignières, M. Rieutord, D. Reese, A&A455, 607 (2006), astro-ph/0604312
- (7) D. Reese, F. Lignières, M. Rieutord, A&A455, 621 (2006), astro-ph/0605503
- (8) S. Barceló Forteza, E. Michel, T. Roca Cortés, R.A. García, A&A579, A133 (2015), 1506.00543
- (9) D.M. Bowman, D.W. Kurtz, M. Breger, S.J. Murphy, D.L. Holdsworth, MNRAS460, 1970 (2016), 1605.03955
- (10) A. García Hernández, A. Moya, E. Michel, J.C. Suárez, E. Poretti, S. Martín-Ruíz, P.J. Amado, R. Garrido, E. Rodríguez, M. Rainer et al., A&A559, A63 (2013), 1307.2739
- (11) M. Paparó, J.M. Benkő, M. Hareter, J.A. Guzik, ApJS224, 41 (2016), 1603.09161
- (12) M. Breger, L. Balona, P. Lenz, J.K. Hollek, D.W. Kurtz, G. Catanzaro, M. Marconi, A.A. Pamyatnykh, B. Smalley, J.C. Suárez et al., MNRAS414, 1721 (2011), 1012.4373
- (13) A. García Hernández, S. Martín-Ruiz, M.J.P.F.G. Monteiro, J.C. Suárez, D.R. Reese, J. Pascual-Granado, R. Garrido, ApJ811, L29 (2015), 1509.01111
- (14) M.A. Dupret, A. Grigahcène, R. Garrido, M. Gabriel, R. Scuflaire, A&A414, L17 (2004)
- (15) E. Michel, M.M. Hernández, G. Houdek, M.J. Goupil, Y. Lebreton, F. Pérez Hernández, A. Baglin, J.A. Belmonte, F. Soufi, A&A342, 153 (1999)
- (16) K. Zwintz, L. Fossati, T. Ryabchikova, D. Guenther, C. Aerts, T.G. Barnes, N. Themeßl, D. Lorenz, C. Cameron, R. Kuschnig et al., Science 345, 550 (2014), 1407.4928
- (17) A. Baglin, I.1 The general framework (2016), p. 5
- (18) J. Debosscher, L.M. Sarro, M. López, M. Deleuil, C. Aerts, M. Auvergne, A. Baglin, F. Baudin, M. Chadid, S. Charpinet et al., A&A506, 519 (2009)
- (19) E. Rodríguez, M.J. López-González, P. López de Coca, A&AS144, 469 (2000)
- (20) M.A.C. Perryman, The HIPPARCOS Catalogue Contents, in Hipparcos - Venice ’97, edited by R.M. Bonnet, E. Høg, P.L. Bernacca, L. Emiliani, A. Blaauw, C. Turon, J. Kovalevsky, L. Lindegren, H. Hassan, M. Bouffard et al. (1997), Vol. 402 of ESA Special Publication, pp. 1–4
- (21) A. Udalski, A. Olech, M. Szymanski, J. Kaluzny, M. Kubiak, M. Mateo, W. Krzeminski, K.Z. Stanek, Acta Astron.47, 1 (1997), astro-ph/9704228
- (22) C. Alcock, R.A. Allsman, D.R. Alves, T.S. Axelrod, A.C. Becker, D.P. Bennett, K.H. Cook, K.C. Freeman, M. Geha, K. Griest et al., ApJ536, 798 (2000)
- (23) M. Auvergne, P. Bodin, L. Boisnard, J.T. Buey, S. Chaintreuil, G. Epstein, M. Jouret, T. Lam-Trong, P. Levacher, A. Magnan et al., A&A506, 411 (2009), 0901.2206
- (24) R. Scuflaire, S. Théado, J. Montalbán, A. Miglio, P.O. Bourge, M. Godart, A. Thoul, A. Noels, Ap&SS316, 83 (2008), 0712.3471
- (25) A. Grigahcène, M.A. Dupret, M. Gabriel, R. Garrido, R. Scuflaire, A&A434, 1055 (2005)
- (26) L.A. Balona, W.A. Dziembowski, MNRAS417, 591 (2011)
- (27) D. Reese, F. Lignières, M. Rieutord, A&A481, 449 (2008), 0801.4630
- (28) R.M. Ouazzani, I.W. Roxburgh, M.A. Dupret, A&A579, A116 (2015), 1505.01088
- (29) F. Lignières, B. Georgeot, A&A500, 1173 (2009), 0903.1768
- (30) K.B. MacGregor, S. Jackson, A. Skumanich, T.S. Metcalfe, ApJ663, 560 (2007), 0704.1275
- (31) D.R. Reese, K.B. MacGregor, S. Jackson, A. Skumanich, T.S. Metcalfe, A&A506, 189 (2009), 0903.4854