Quantitative vectorial magnetic imaging of multi domain rock forming minerals using nitrogen-vacancy centers in diamond
Abstract
Magnetization in rock samples is crucial for paleomagnetometry research, as it harbors valuable geological information on long term processes, such as tectonic movements and the formation of oceans and continents. Nevertheless, current techniques are limited in their ability to measure high spatial resolution and high-sensitivity quantitative vectorial magnetic signatures from individual minerals and micrometer scale samples. As a result, our understanding of bulk rock magnetization is limited, specifically for the case of multi-domain minerals. In this work we use a newly developed nitrogen-vacancy magnetic microscope, capable of quantitative vectorial magnetic imaging with optical resolution. We demonstrate direct imaging of the vectorial magnetic field of a single, multi-domain dendritic magnetite, as well as the measurement and calculation of the weak magnetic moments of an individual grain on the micron scale. These results pave the way for future applications in paleomagnetometry, and for the fundamental understanding of magnetization in multi-domain samples.
When igneous rocks in Earth’s crust are formed by cooling of hot magma they acquire thermoremanent magnetization (TRM) parallel and proportional to the ambient field at the time of cooling. TRM can remain stable for millions of years preserving valuable geological magnetic information on complex long term processes, such as plate tectonic movements and formations of oceans and continents Tauxe (2010). Despite its importance, little is known on the details of how thermoremanent magnetic information is acquired and retained in rocks Dunlop and Özdemir (1997). Paleomagnetism, the science of studying natural magnetic information, heavily relies on Néel theory Néel (1955) of single-domain (SD) minerals. Yet, the dimensions of rock-forming minerals typically exceed the sub-micrometric threshold size for SD. As such, TRM is mostly held by multi-domain (MD) particles rather than by SD. In the absence of a general analytical formulation for TRM in MD, there is a growing need for direct observations of natural MD magnetization. Particularly, vectorial imaging of magnetic fields generated by MD particles with sub-micron spatial resolution and micrometer scale sample-detector distance, along with high sensitivity (), is critical for understanding the mechanism controlling the geometry and size of MD arrangements, the total moment exerted by individual natural crystals, and the stability of MD magnetic information over geological times.
There are a number of magnetic imaging techniques that have been used in paleomagnetic research in a complementary fashion: Kerr effect Hoffmann et al. (1987) , Magnetic Force Microscopy (MFM) Pokhil and Moskowitz (1996), electron holography Harrison et al. (2002), and SQUID microscopy Weiss et al. (2007). Recently, a newly developed method based on nitrogen-vacancy (NV) magnetic microscopy Simpson (2016); Pelliccione (2016); Tetienne (2014), has been demonstrated by Fu et al. (2014, 2017) in the context of paleomagnetometry. NV magnetic microscopy enables direct measurements of the three components of the magnetic field vector at a constant height above the sample in a room temperature environment. It features sub-micrometer spatial resolution of quantitative data with relatively high sensitivity and simple operation.
The nitrogen-vacancy (NV) center is a point defect in the diamond’s lattice with C3V symmetry. It consists of a substitutional nitrogen atom (N) adjacent to a carbon vacancy (V) that is oriented along one of the four crystalline directions ( and ) (Fig. 1 (b)). The electronic structure of the negatively charged NV center has a spin-triplet ground state, where the sublevels experience a zero-field splitting ( ) from the sublevel due to spin-spin interactions. When an external static magnetic field is applied along the NV symmetry axis, the degeneracy of the energy levels is lifted linearly via Zeeman splitting (Fig. 1 (c)) Doherty (2013). The NV spin state can be initialized in the state with off-resonant laser excitation, coherently manipulated with resonant microwave (MW) pulses, and read out optically via spin-state-dependent fluorescence intensity of the phonon sideband Taylor et al. (2008).
Here, we explore the potential of NV magnetic microscopy in observing magnetic domains and measuring the effective dipole moment of large multi-domain arrays. We present two case studies, depicting direct quantitative, vectorial magnetic imaging of a single dendrite in the multi-domain regime, and of a pair of magnetite dendrites in the dipole regime. We finally outline the technical challenges for future use of NV-based magnetic microscopy in paleomagnetic research.
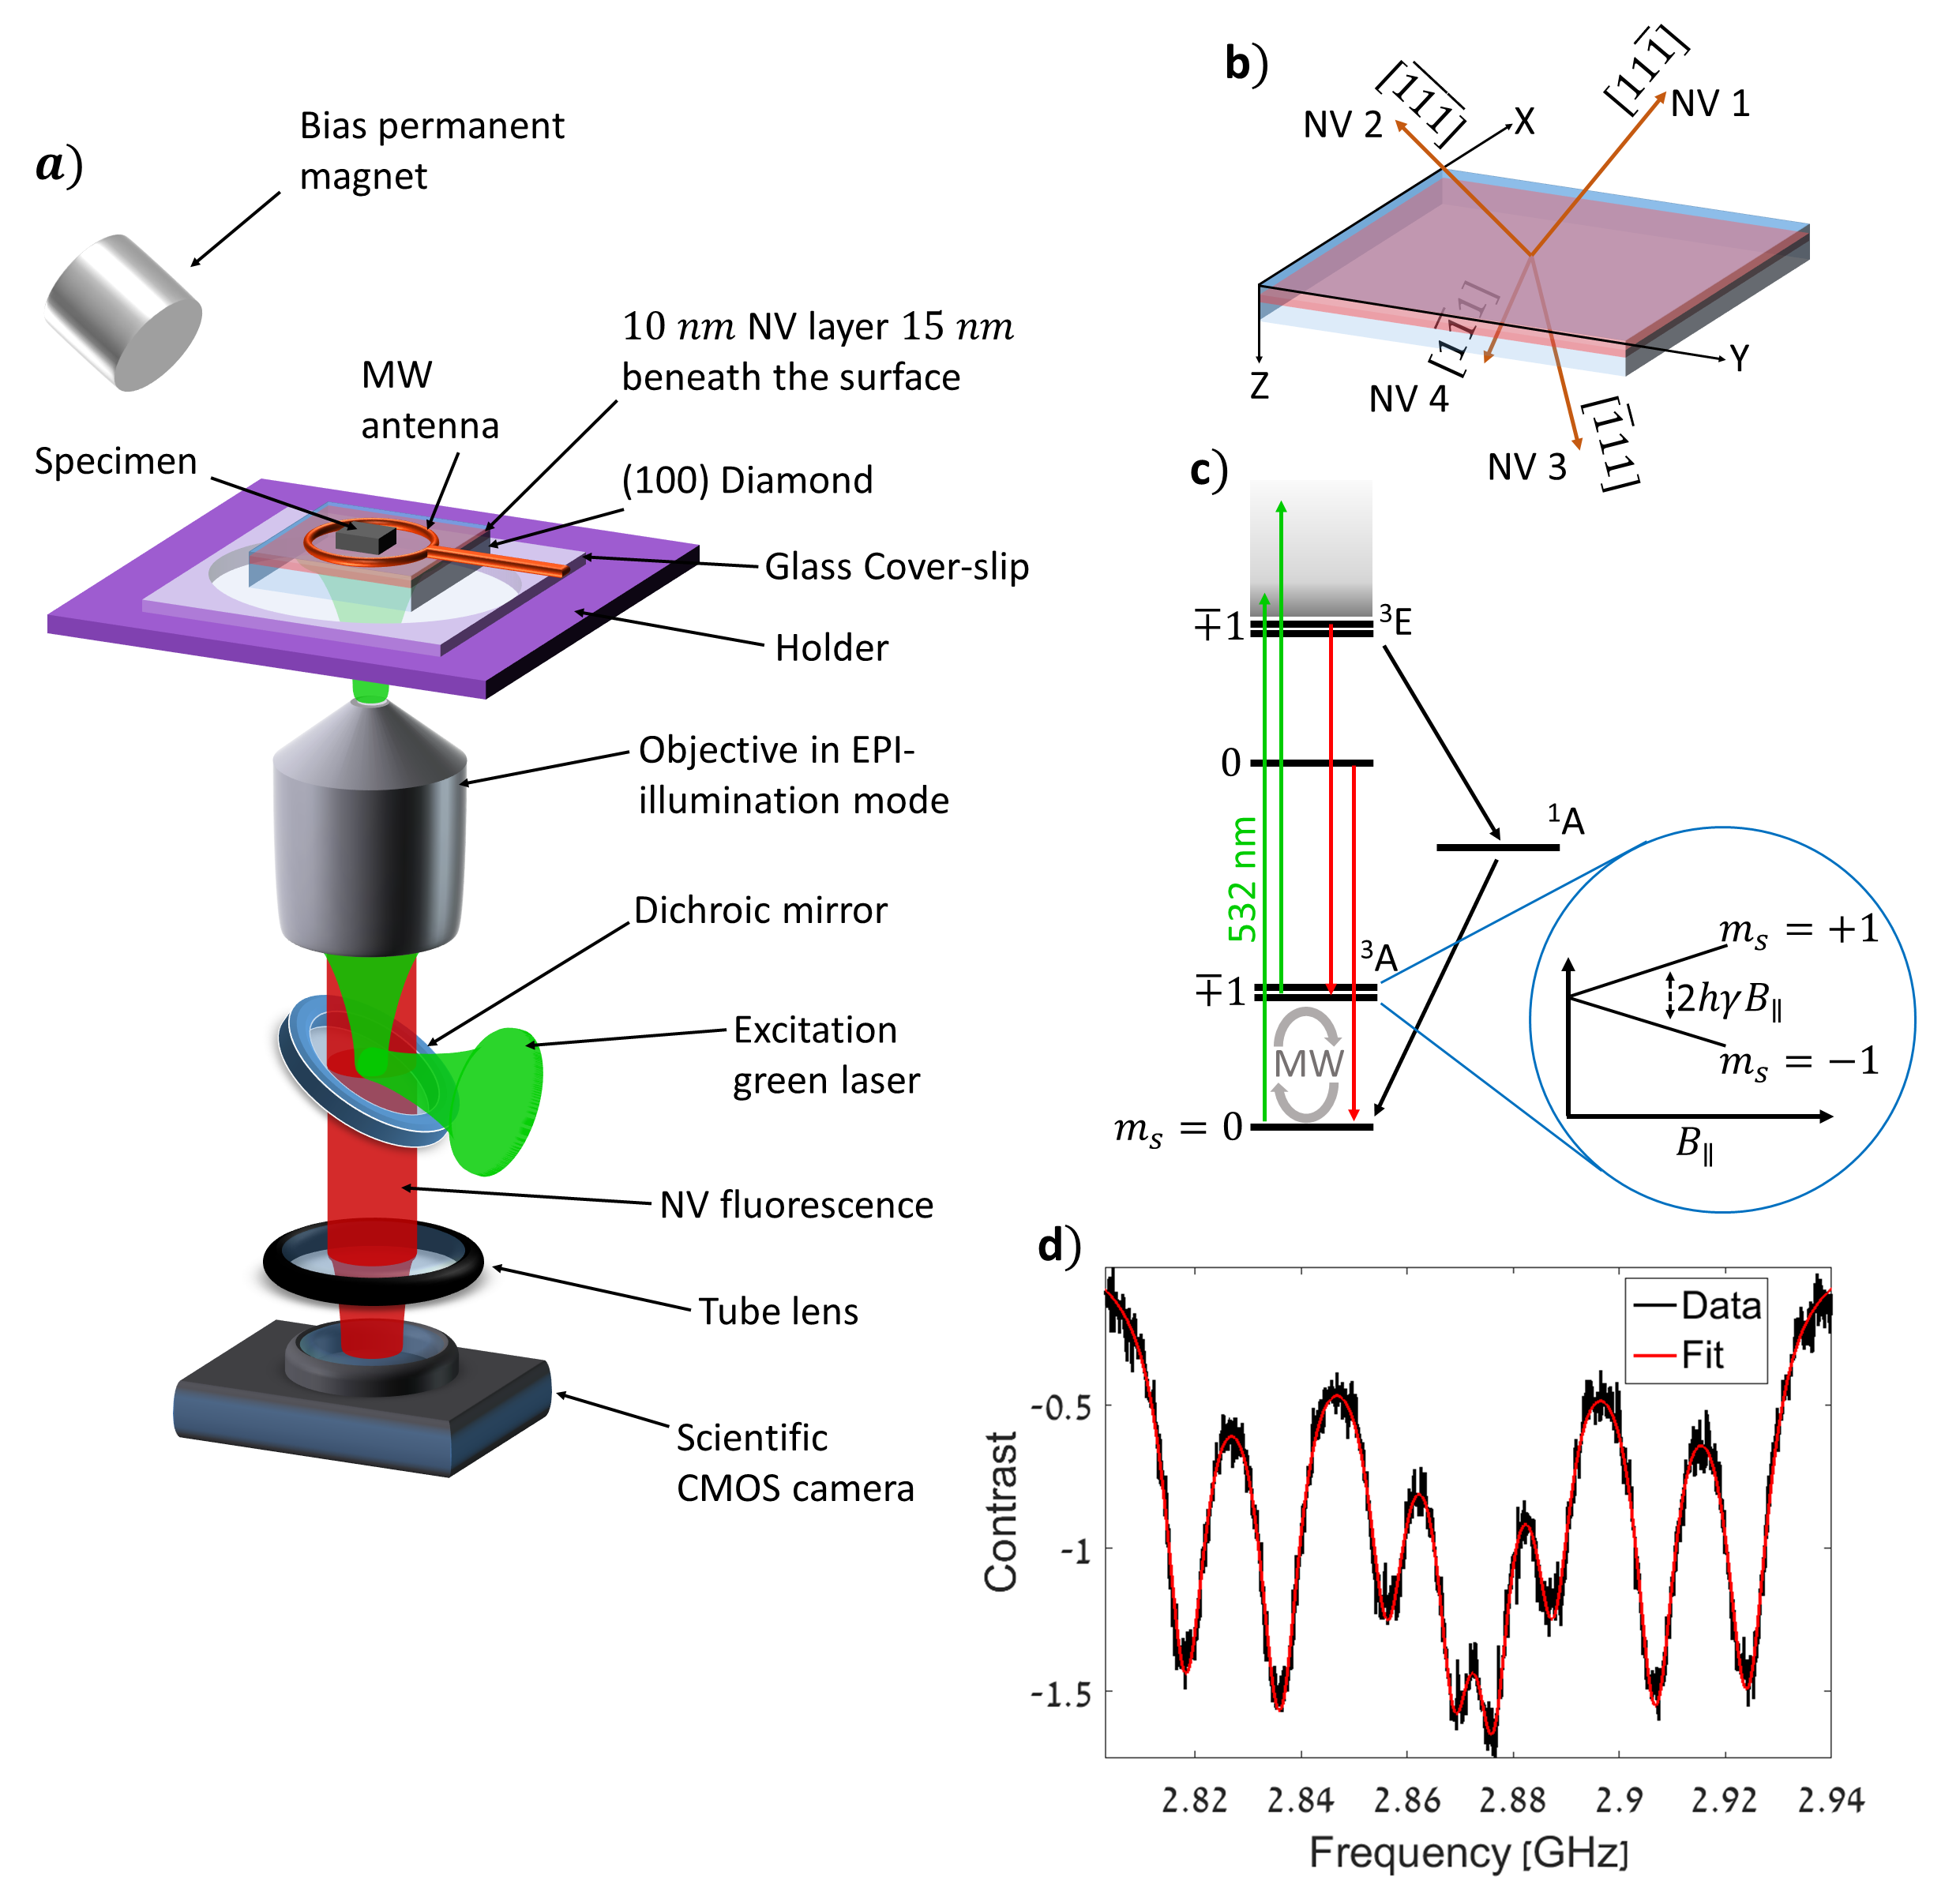
The optical and magnetic imaging was performed using an NV wide-field magnetic microscope setup depicted schematically in Fig. 1 (a). To measure the magnetic field we performed continuous-wave optically detected magnetic resonance (CW ODMR) measurements. In this method, The NV spin is optically polarized and interrogated using a green laser at . Concurrently, it is coherently driven by a frequency swept microwave (MW) field, created by a MW antenna located near the diamond surface. The signal is read-out optically via spin-state-dependent fluorescence in a broad range of , which is imaged on a camera. Magnetic field projection along the NV orientation is extracted based on the ODMR measured transition frequencies between and (Fig. 1 (d,c)) denoted as , and the Zeeman splitting, which can be written as
| (1) |
Where represents the electronic gyromagnetic ratio and is the external magnetic field along the NV center symmetry axis.
Wide field Magnetic imaging is achieved using a high density ( ) NV ensemble in a thin implanted layer located beneath the surface of the diamond chip (Element 6, electronic grade diamond, nitrogen implanted with a dose of and energy). This NV layer is excited over a large field-of-view of , and the resulting fluorescence is imaged onto a sCMOS camera (Andor Neo) using a high-numerical-aperture (0.9) air objective. Using a single-crystal bulk diamond enables us to measure the magnetic field along each of the four NV center orientations (tetrahedral symmetry) separately, resulting in vectorial magnetic field information. We demonstrate optical imaging of 2D DC magnetic field patterns with spatial resolution and magnetic sensitivity of per pixel (calibrated through measurements as depicted in Fig. 1 (d)).
The measurement protocol is based on the following procedure. The frequency of the microwave synthesizer was swept around the resonance transition frequencies. For each frequency step, a fluorescence image was taken. The images were appended in the computer memory to form a 3D volume of data, where each element contains the value of the fluorescence for each camera’s pixel and for each frequency of the sweep. This volume of data can also be considered as an image where each pixel contains an ODMR spectrum. The ODMR spectrum for each pixel was fitted to a multi-Lorentzian function (8 dips, for 2 resonance transition and 4 NV orientations) (Fig. 1 (d)). The algorithm require initial set of parameters for the first fitted pixel. Then the entire image was fitted gradually, taking the results of the already fitted neighboring pixels as an input for the following one. Finally, the resonance positions extracted from the fit are used to reconstruct the magnetic field vector. Calculation of the magnetic field in the lab frame was done by transforming the tetrahedral directions into Cartesian coordinates as defined in Fig. 1 (b) using the following relations
| (2) | |||
Where, is the magnetic field along the th NV orientation. To avoid overdetermined coordinate systems we perform a calibration by applying an additional known static magnetic field along spanning set directions. Using the equations in 2 we could match each resonance dip in the ODMR spectrum to its NV orientation.
Paleomagnetic imaging measurements were performed by placing a polished rock sample (roughly ) on top of the diamond’s surface containing the NV center layer (Fig. 1 (a)). The material we analyze was created by controlled solidification of silicate melt, simulating natural process of magma cooling in volcanic rocks. Details on sample preparation can be found in Shaar et al. (2011, 2010). The ferromagnetic phase in the sample consists of dendrites of magnetite containing minor amounts of Mn, Mg, and traces of Al, typical to volcanic rocks, homogeneously spread in a paramagnetic silicate matrix. The size, geometry, and composition of the magnetite dendrites allows investigation of domain wall behavior in a plane parallel to a known crystallographic axis. This advantage has been used in previous work by Shaar and Feinberg (2013), who carried out Magnetic Force Microscopy investigation on this sample. To reduce sample topography and minimize stress effects distorting domain walls, the samples were polished down to a surface roughness of using colloidal silica. We imaged the sample at two different states subsequent to the following magnetic treatment: 1) complete demagnetization state after inducing Alternating Field (AF) with a peak field of 100 mT, and 2) Isothermal remanent magnetization (IRM) after inducing a pulse of of 1.5 T. The IRM field was induced in a direction nearly perpendicular to the polished surface of the sample. Yet, accurate measurement of the angle between the IRM field and the sample surface could not be precisely determined due to technical instrumental limitations. The AF treatment allowed us to investigate domain wall configurations in a ”ground state” magnetization scheme, in which domains were arranged spontaneously in the absence of an ambient magnetic field. In contrast, the grain magnetization due to the strong IRM field is maximized, and the latter is used to investigate the potential of NV microscopy as a high sensitivity magnetometer.
Placement of the polished sample on the polished diamond surface resulted in a stand-off distance of a few microns, which is measured optically (by imaging the diamond surface vs. the sample surface) for each configuration. This stand-off distance translates into a spatial convolution of the measured magnetic signal on the NVs, and therefore into an effectively reduced spatial resolution (on the scale of the stand-off distance), although the inherent optical resolution limit is 350 nm (as stated above). We apply constant magnetic field, so that the magnetic field projection is different along each orientation. In this manner, all eight ODMR resonance dips are resolved (Fig. 1 (d)), and measuring three orientations from a single ODMR sweep allows us to extract full quantitative vectorial magnetic field information. We clearly identified a single magnetite dendrite using the same optical path of the fluorescence imaging microscope, and performed the ODMR measurement. Last, we performed a reference measurement excluding the rock sample, which then we used to vectorially subtract from the actual measurement. This resulted in a quantitative magnetic field produced by the rock bulk and the magnetite dendrite solely.
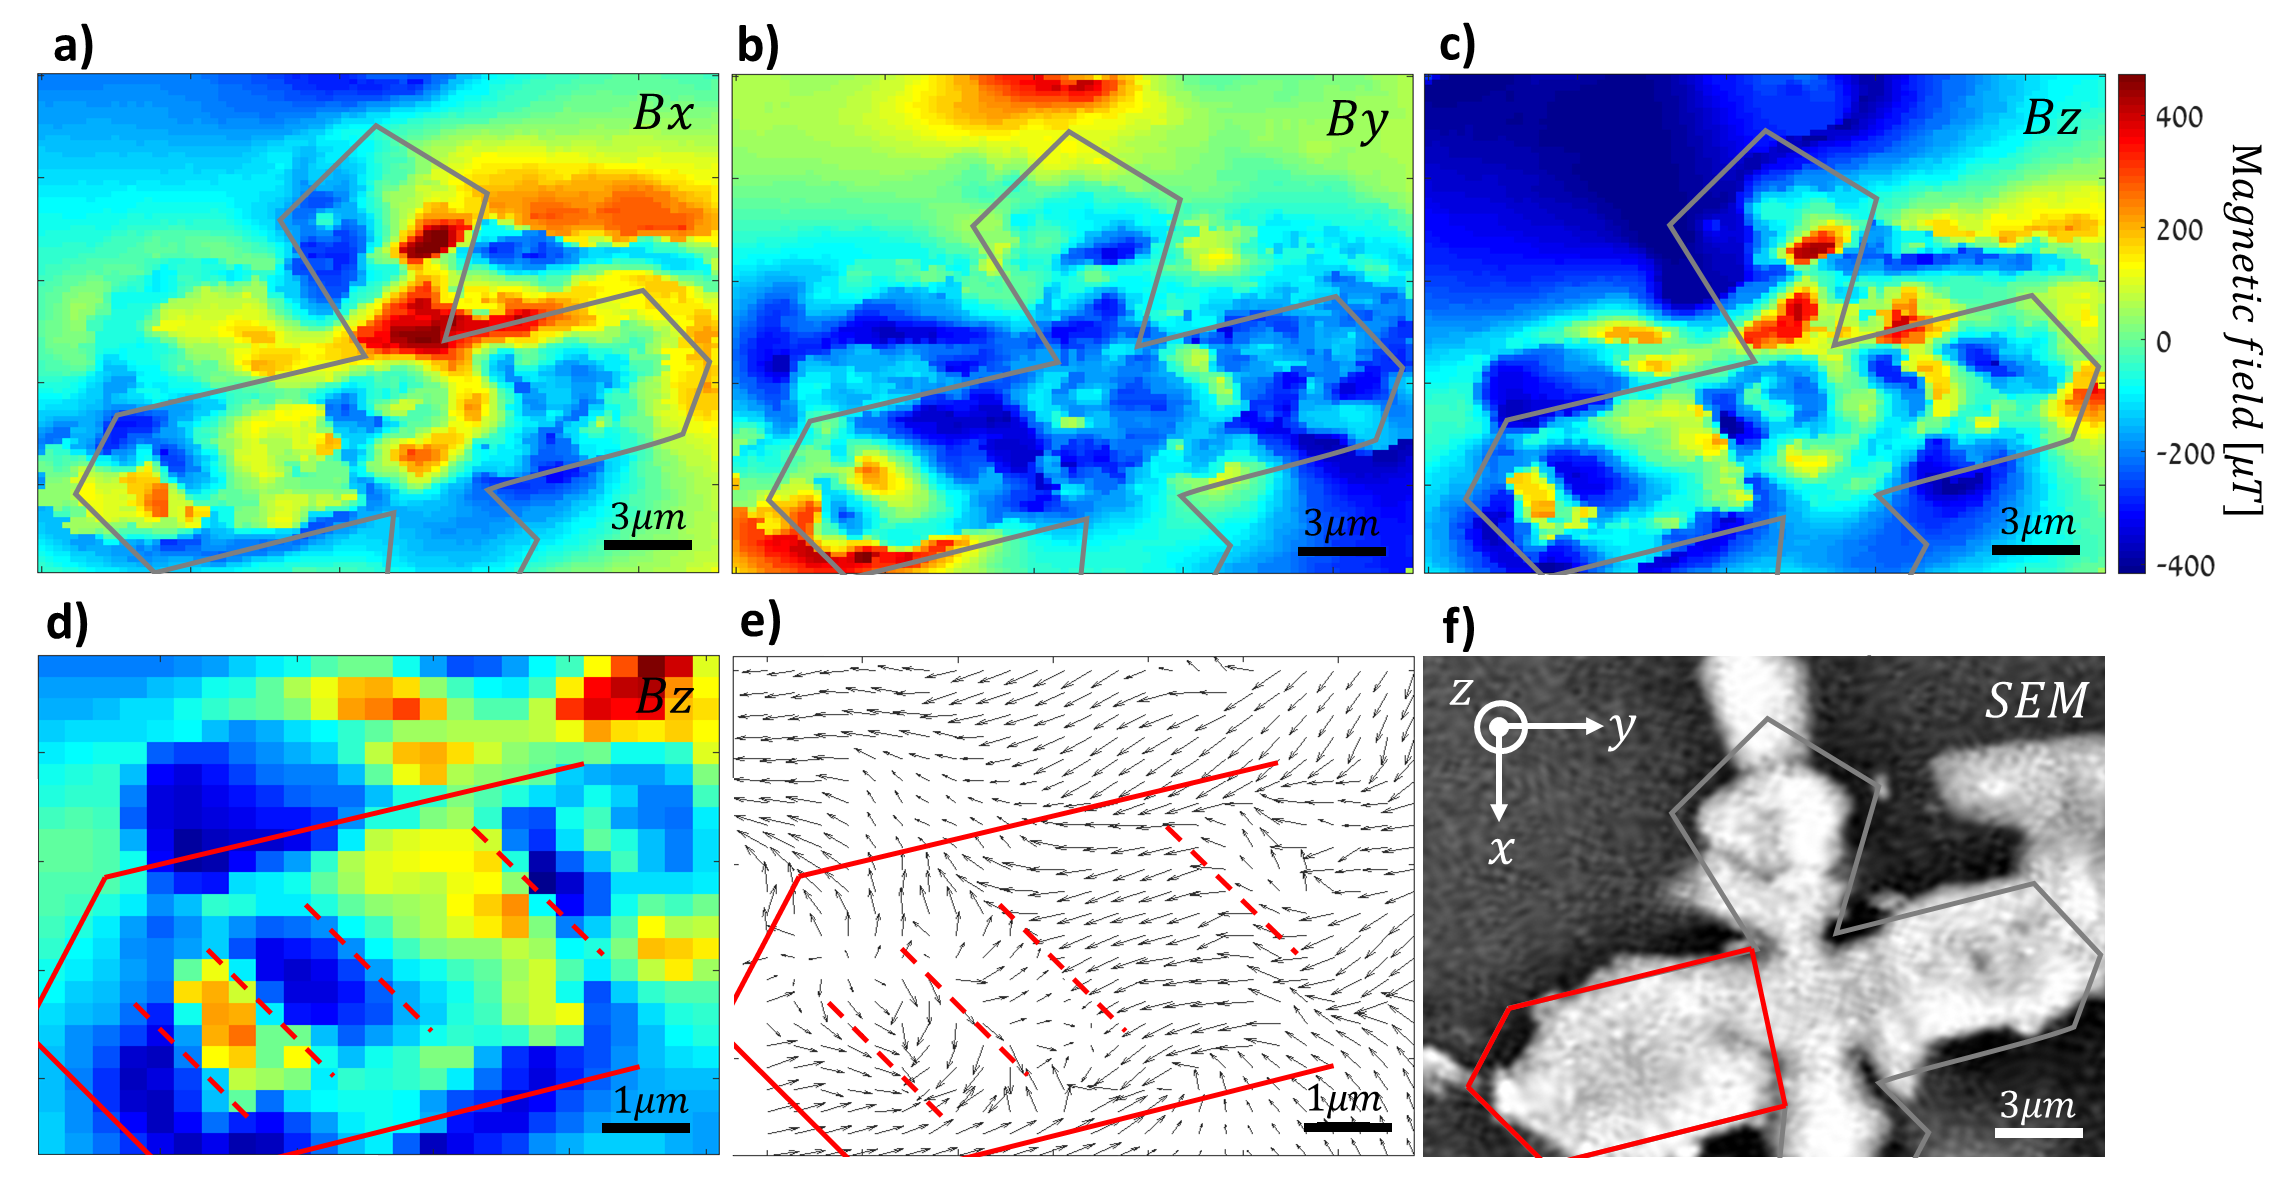
First, we present in Fig. 2 the results of the demagnetized sample at a measurement distance of in the presence of a constant bias magnetic field of along the (-0.8,-0.5,-0.4) direction. The results show the quantitative vectorial magnetic field of a single magnetite dendrite. The branches of magnetite dendrite occur as rod-like extensions growing along magnetite directions. The size of each individual branch of the dendrite correspond to a MD regime Muxworthy and Williams (2006). The images of the magnetic field show domains with anti-parallel magnetization separated by sharp walls along the dendrite branch. The steep change in magnetic field orientation over a relatively short distance corresponds to such multi-domain behavior, and is captured by our measurement scheme (although spatial resolution is somewhat limited due to the stand-off distance between diamond and sample). The geometry, relative size, pattern, and directions of the domains are similar to those observed using MFM by Shaar and Feinberg (2013), who also showed that the preferred direction of the walls is along the crystallographic plane, explaining the repetitive pattern in the left branch shown in Fig. 2(d).
Second, we present the results of a different, smaller particle after inducing IRM field in the -z direction. The measurements distance to the sample is in the presence of a constant bias magnetic field of along the (0.3,0.7,-0.6) direction. This distance from the sample is far enough to be in a dipole regime, i.e. observing magnetic field lines similar to those of a simple dipole. This distance is on the other hand close enough to result in relatively strong field measurements. Here we used the dipole approximation to calculate the effective magnetic moment of the particle. The magnetic moment calculation was performed based on the full vectorial magnetic images, the sensor-to-sample distance and the position of the dendrite in the x-y plane. A nonlinear fit was performed to a simple magnetic dipole, leaving the dendrite depth and the vectorial magnetic moment as free parameters. The results in Fig. 3 show the quantitative vectorial magnetic field of two magnetite dendrites and the corresponding fit of the magnetic field assuming tilted dipoles centered under the grains. The magnetic moment of the dendrite in the upper part of Fig. 3 is along the (0,-0.6,-0.8) direction. The direction of the dipole moment is in agreement with the direction of the applied field. Assuming a pure magnetite (saturation magnetization, Ms, of ) dendrite built from six octahedra with edge length of the saturation magnetization of a half dendrite, as the one shown in Fig. 3, is . Following Tauxe and Seberino (2002); Williams and Krása (2010) it is reasonable to assume that the IRM is about half of the saturation magnetization, which result is magnetic moment of , very similar to the best-fitting dipole in Fig. 3 (d-f).
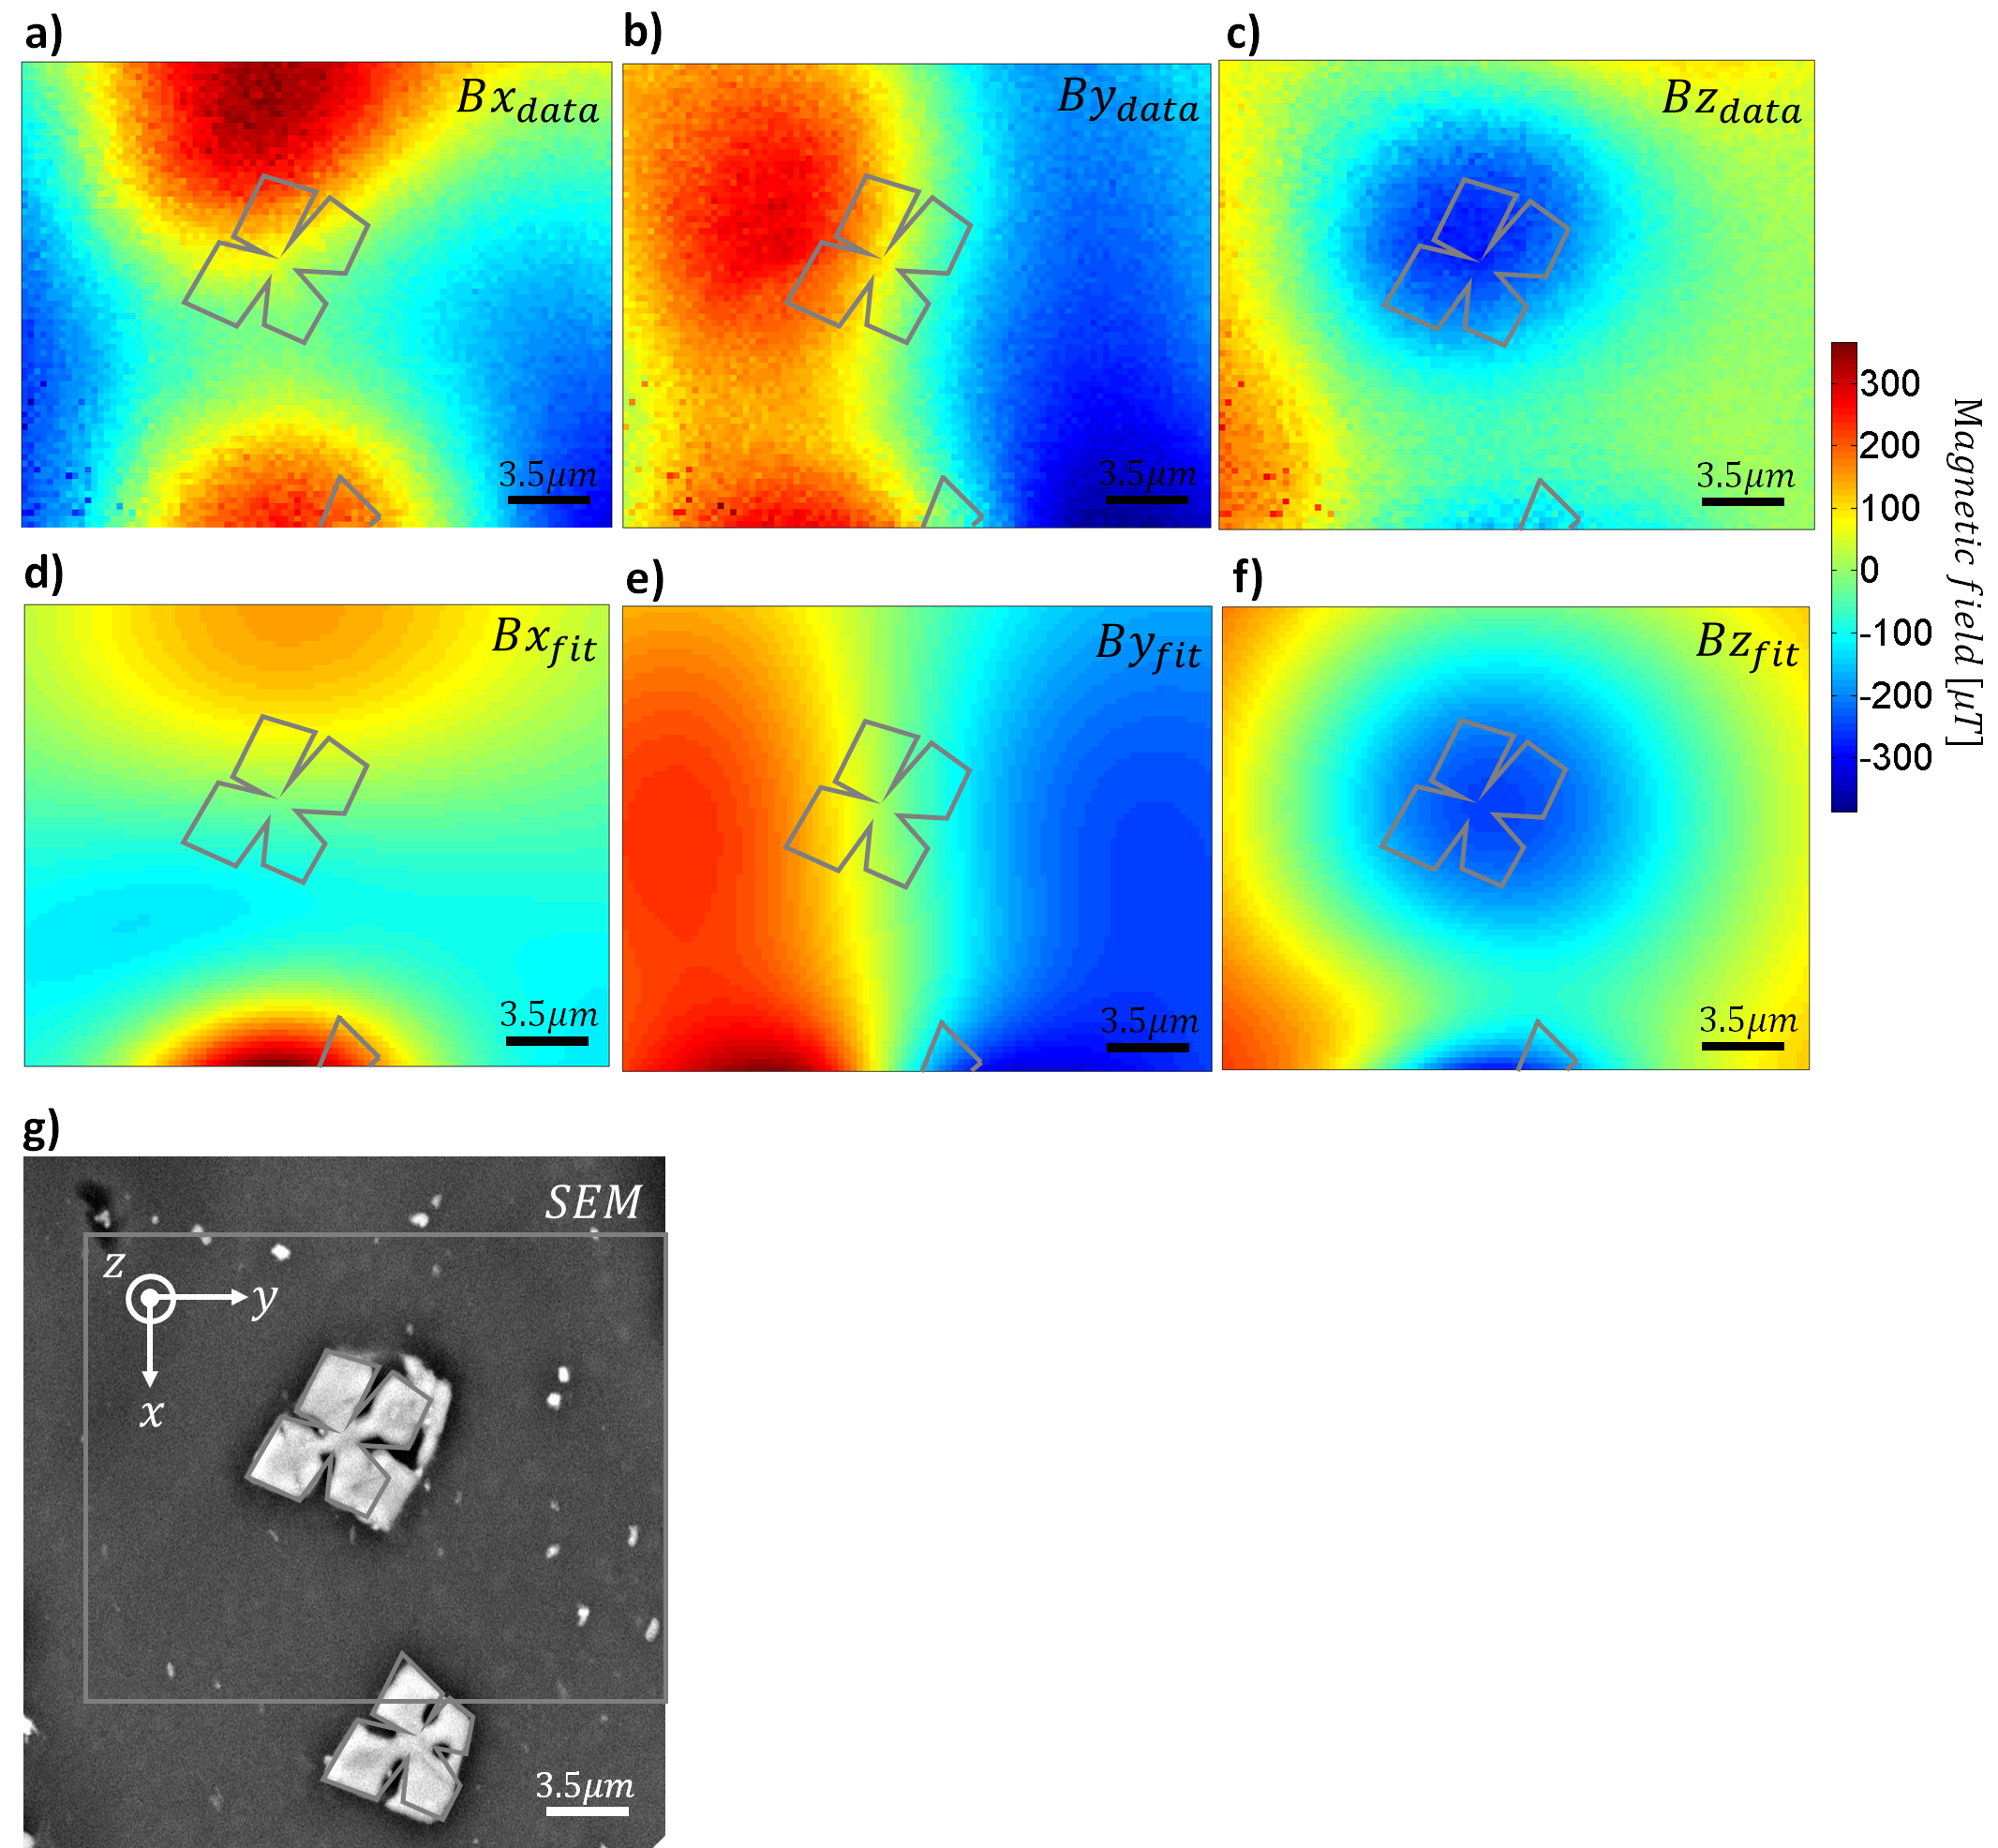
In both measurements, to separate the paramagnetic magnetization of the silicate matrix from the ferromagnetic effect, we measured the magnetic field of the matrix away from the magnetite dendrite (this field is not zero due to the finite size of the sample, inhomogeneities of the material, and contributions from ferromagnetic grains). A vectorial subtraction of this measurement from the dendrite measurement resulted in an approximation of the magnetic field of the magnetite alone. In the first result (Fig. 2), the magnetic field of the rock matrix was in a direction close to constant bias magnetic field and a magnitude of . In the second result (Fig. 3), the magnetic field magnitude of the rock matrix was along the (0.6,0.6,-0.5) direction. We expect that the discrepancy between the orientation of this field and the external field stem from field inhomogeneities and ferromagnetic effects. As detailed below, more precise measurements in the future will utilize a 3D Helmholtz coil configuration, affording better field homogeneity and a clearer separation between paramagnetic and ferromagnetic effects.
The results presented here demonstrate the capabilities and the future potential of NV microscopy in measuring the magnetic signals of individual micrometer scale grains. Our case study includes optical and magnetic imaging of geological magnetite dendrites from a distance of , with spatial resolution, magnetic sensitivity of and a field of view of .
In the demonstrated measurement modality we were limited by our control over the bias magnetic field. The bias field exerts a paramagnetic effect on silicates, and can distort magnetic domain configuration in grains with low coercive field. This problem can be solved by adding 3D Helmholz coils Fu et al. (2014), which should allow precise control over the vectorial bias field in future work. We expect to be able to perform measurements with bias magnetic field smaller by approximately an order of magnitude ( ), as well as to reverse the direction of the bias field in order to separate paramagnetic and ferromagnetic effects.
In this paper we demonstrated two potentially useful applications of NV microscopy in paleomagnetism. The first is the direct measurement of the full magnetic vector created by magnetic domains (Fig. 2). This application requires measurements as close as possible to the sample surface, in order to increase the spatial resolution in detecting fine-scale domain configurations. The second application is the calculation of weak magnetic moments of individual grains, the size of which is in the range of a few micrometers. This capability can potentially open a new path for paleomagnetic analyses of weakly magnetized individual ferromagnetic grains, such as minerals hosted in meteorites Fu et al. (2014) and the oldest rocks on Earth Tarduno (2015). Calculations of such small-scale moments are currently employed using low-temperature scanning SQUID devices that measure the z component of the vector Lima and Weiss (2016). Adopting the approach of Lima and Weiss (2016), using the three components of the field vector at room temperature offers promising potential for future applications. Altogether, these two applications provide significant supplements to the possibilities of NV microscopy in geological research, complementing the paleomagnetic applications first demonstrated by Fu et al. (2014, 2017).
Finally, we wish to highlight some technical challenges in application of NV magnetometry in paleomagnetism. First, the bias field should be minimized in order to reduce distortion of the paleomagnetic signal by reorganization of domain walls as a response to external field. Then, one should make sure that the coercive field of the investigated samples, i.e. the field required to trigger domain-wall reorganization, is lower than the NV bias field. Second, we stress the necessity of generating a uniform bias field using a controlled 3-axis Helmholtz coil configuration Fu et al. (2014, 2017). This will allow better control of paramagnetic effect, and will enable subtraction of the paramagnetic signal from the ferromagnetic one by carrying out two measurements with antiparallel fields. Third, to support the use of NV magnetometry in standard paleomagnetic treatments, such as progressive AF demagnetizations (Fig. 2), the design of a specialized sample holder is required to allow reproducible placement of the sample with respect to the diamond detector. Fourth, the standoff distance between the diamond and the rock surface should be adjustable such that the measurement regime (dipole-dominated or multi-domain) could be determined.
This work has been supported in part by the CIFAR-Azrieli global scholars program, the Israel Science Foundation (grant No. 750/14), the Ministry of Science and Technology, Israel, and the KLA fellowship.
References
- Tauxe (2010) L. Tauxe, Essentials of paleomagnetism (University of California Press, Berkeley, 2010) pp. xvi, 489 p., n/a.
- Dunlop and Özdemir (1997) D. J. Dunlop and Ö. Özdemir, Rock Magnetism: Fundamentals and Frontiers, Cambridge Studies in Magnetism (Cambridge University Press, 1997).
- Néel (1955) L. Néel, Advances in Physics 4, 191 (1955), http://dx.doi.org/10.1080/00018735500101204 .
- Hoffmann et al. (1987) V. Hoffmann, R. Schäfer, E. Appel, A. Hubert, and H. Soffel, Journal of Magnetism and Magnetic Materials 71, 90 (1987).
- Pokhil and Moskowitz (1996) T. G. Pokhil and B. M. Moskowitz, Journal of Applied Physics 79, 6064 (1996), http://aip.scitation.org/doi/pdf/10.1063/1.362093 .
- Harrison et al. (2002) R. J. Harrison, R. E. Dunin-Borkowski, and A. Putnis, Proceedings of the National Academy of Sciences 99, 16556 (2002), http://www.pnas.org/content/99/26/16556.full.pdf .
- Weiss et al. (2007) B. P. Weiss, E. A. Lima, L. E. Fong, and F. J. Baudenbacher, Journal of Geophysical Research: Solid Earth 112, n/a (2007), b09105.
- Simpson (2016) T. J. P. M. J. M. G. K. H. L. T. P. S. . . H. L. C. Simpson, D. A., Scientific reports 6, 22797 (2016).
- Pelliccione (2016) J. A. O. P. R. C. E. E. N. N. . J. A. C. B. Pelliccione, M., Nature nanotechnology 11, 700 (2016).
- Tetienne (2014) H. T. K. J. V. D. L. H. A. J. P. G. K. . . J. V. Tetienne, J. P., Science 344, 1366 (2014).
- Fu et al. (2014) R. R. Fu, B. P. Weiss, E. A. Lima, R. J. Harrison, X.-N. Bai, S. J. Desch, D. S. Ebel, C. Suavet, H. Wang, D. Glenn, D. Le Sage, T. Kasama, R. L. Walsworth, and A. T. Kuan, Science 346, 1089 (2014), http://science.sciencemag.org/content/346/6213/1089.full.pdf .
- Fu et al. (2017) R. R. Fu, B. P. Weiss, E. A. Lima, P. Kehayias, J. F. Araujo, D. R. Glenn, J. Gelb, J. F. Einsle, A. M. Bauer, R. J. Harrison, G. A. Ali, and R. L. Walsworth, Earth and Planetary Science Letters 458, 1 (2017).
- Doherty (2013) M. N. B. D. P. J. F. W. J. . H. Doherty, M. W., Physics Reports 528, 1 (2013).
- Taylor et al. (2008) J. M. Taylor, P. Cappellaro, L. Childress, L. Jiang, D. Budker, P. R. Hemmer, A. Yacoby, R. Walsworth, and M. D. Lukin, Nat. Phys. 4, 810 (2008).
- Shaar et al. (2011) R. Shaar, H. Ron, L. Tauxe, R. Kessel, and A. Agnon, Earth and Planetary Science Letters 310, 213 (2011).
- Shaar et al. (2010) R. Shaar, H. Ron, L. Tauxe, R. Kessel, A. Agnon, E. Ben-Yosef, and J. M. Feinberg, Earth and Planetary Science Letters 290, 201 (2010).
- Shaar and Feinberg (2013) R. Shaar and J. M. Feinberg, Geochemistry, Geophysics, Geosystems 14, 407 (2013).
- Muxworthy and Williams (2006) A. R. Muxworthy and W. Williams, Journal of Geophysical Research Solid Earth 111 (2006).
- Tauxe and Seberino (2002) H. N. B. Tauxe, Lisa and C. Seberino, Geochemistry, Geophysics, Geosystems 3, 1 (2002).
- Williams and Krása (2010) M. E. E. Williams, W. and D. Krása, Geochemistry, Geophysics, Geosystems 11 (2010).
- Tarduno (2015) C. R. D. D. W. J. N. F. . B. R. K. Tarduno, J. A., Science 349, 521 (2015).
- Lima and Weiss (2016) E. A. Lima and B. P. Weiss, Geochemistry, Geophysics, Geosystems 17, 3754 (2016).