11email: myriam.gitti@unibo.it 22institutetext: INAF, Istituto di Radioastronomia di Bologna, via Gobetti 101, 40129 Bologna, Italy
New JVLA observations at 3 GHz and 5.5 GHz
of the ‘Kite’ radio source in Abell 2626
Abstract
Context. We report on new JVLA observations performed at 3 GHz and 5.5 GHz of Abell 2626. The cluster has been the object of several studies in the recent years due to its peculiar radio emission, which shows a complex system of symmetric radio arcs characterized by a steep spectrum. The origin of these radio sources is still unclear. Due to their mirror symmetry toward the center, it has been proposed that they may be created by pairs of precessing jets powered by the inner AGN.
Aims. The new JVLA observations were requested with the specific aim of detecting extended emission on frequencies higher than 1.4 GHz, in order to constrain the jet-precession model by analyzing the spectral index and radiative age patterns alongs the arcs.
Methods. We performed a standard data reduction of the JVLA datasets with the software CASA. By combining the new 3 GHz data with the archival 1.4 GHz VLA dataset we produced a spectral index maps of the extended emission, and then we estimated the radiative age of the arcs by assuming that the plasma was accelerated in moving hot-spots tracing the arcs.
Results. Thanks to the high sensitivity of the JVLA, we achieve the detection of the arcs at 3 GHz and extended emission at 5.5 GHz. We measure a mean spectral index for the arcs up to 3 GHz. No clear spectral index, or radiative age, trend is detected across the arcs which may challenge the interpretation based on precession or put strong constraints on the jet-precession period. In particular, by analyzing the radiative age distribution along the arcs, we were able to provide for the first time a time-scale Myr of the jet-precession period.
Key Words.:
galaxies: clusters: individual: Abell 2626; galaxies: individual: IC5338, IC5337; galaxies: jets; radio continuum: galaxies; radiation mechanisms: non-thermal; methods: observational1 Introduction
In recent years, radio observations have revealed that a fraction of galaxy clusters hosts diffuse synchrotron emission on cluster scale. The discovery of radio sources not associated with any individual galaxy proves the presence of non-thermal components, such as relativistic particles and magnetic fields, mixed with the thermal intra-cluster medium (ICM) on spatial scale that are comparable to the cluster size. According to their morphology and location in the cluster, cluster-scale radio sources are classified as radio relic, radio halos and radio mini-halos (e.g. Feretti et al. 2012). Relics are polarized, elongated, arc-shaped synchrotron sources located in the peripheries of dynamically disturbed clusters. Radio relics are also unique probes of the properties of magnetic fields in the outskirts of galaxy cluster. Halos and mini-halos are instead roundish radio sources located in the cluster central regions. The two classes differ in size and in the dynamical properties of the hosting clusters. Radio halos are located in the center of dynamically disturbed clusters, which show signs of recent major merger activity, whereas mini-halos are detected only in relaxed, cool-core clusters. It is currently thought that relics and halos originate from complex acceleration mechanisms that are driven by shocks and turbulence in the ICM (e.g. Brunetti & Jones 2014). On the other hand, the mini-halo diffuse emission is always observed to surround the intense radio emission of the brightest cluster galaxy (BCG), which often shows non-thermal radio jets and lobes ejected by the central active galactic nucleus (AGN). The radio-lobe plasma strongly interacts with the ICM by inflating large X-ray cavities and triggering the so-called ‘radio-mode AGN feedback’ (e.g., Gitti et al. 2012). The central radio-loud AGN is also likely to play a role in the initial injection of the relativistic particles emitting in the mini-halo region. Nonetheless, the diffuse radio emission of mini-halos is truly generated from the ICM on larger scales, where the thermal and non-thermal components are mixed, and can be explained in the framework of leptonic models which envision in situ particle re-acceleration by turbulence in the cool-core region (e.g., Gitti et al. 2002). Turbulence in cool cores may be generated by several mechanisms, including the interplay between the outflowing relativistic plasma in AGN jets/lobes, and sloshing gas motions.
This work is a multi-frequency study of the inner part of Abell 2626 (hereafter A2626), which was included in the first sample of mini-halo clusters (Gitti et al. 2004). Its radio morphology, more complex than that of the standard radio bubbles typically observed to fill X-ray cavities, represents a challenge to models for the ICM / radio source interaction in cool cores. A2626 is a low-redshift (z=0.0553 Struble & Rood 1999), regular, poor cluster (Mohr et al. 1996), located at RA 23h36m30s, DEC+21d08m33s and it is part of the Perseus-Pegasus super-cluster. A2626 has an estimated mass of 1.3 M⊙ and a virial radius of 1.6 Mpc (Mohr et al. 1996). It is a cool-core cluster with estimated X-ray luminosity of erg s-1 and mass accretion rate of 5 M⊙ y (Bravi et al. 2016). Its core-dominant (cD) galaxy IC5338 hosts a pair of optical nuclei with a projected separation of 3.3 kpc, of which only the southern one has a counterpart also in the radio (Gitti 2013, hereafter G13) and hard X-rays (Wong et al. 2008) bands (see Wong et al. 2008, Fig. 3). The extended radio emission of the cluster has a peculiar morphology resembling a giant kite, with striking arc-like, symmetric features whose origin is puzzling (Gitti et al. 2004; Gitti 2013; Kale & Gitti 2017). The arcs are collimated structures having largest extent of 70 kpc, steep radio spectrum (-2.5111In this work the radio spectral index is defined such as , Kale & Gitti 2017), and no evidence of polarized emission (G13). Gitti et al. (2004) argued that the elongated features are distinct from and embedded in the diffuse, extended radio emission, which they classified as a radio mini-halo and successfully modeled as radio emission from relativistic electrons reaccelerated by MHD turbulence in the cool-core region. On the other hand, the origin and nature of the radio arcs is still unclear. Their morphology may suggest that the arcs are radio bubbles, or cluster relics. However, Chandra and XMM-Newton observations failed to detect any X-ray cavity or shock front associated to them, in general showing no clear spatial correlation between the non-thermal emission of the arcs and the thermal emission of the cluster (Wong et al. 2008).
Wong et al. (2008) argued that the peculiar radio morphology of the northern and southern arcs may be produced by jet precession triggered by the reciprocal gravitational interactions of the two cores of the cD galaxy. According to this scenario, the relativistic plasma of the arcs was accelerated in a pair of precessing hot-spots powered by the AGN located inside the southern core of IC5338. In particular, if two jets ejected towards the north and south direction are precessing about an axis which is nearly perpendicular to the line-of-sight and are stopped at approximately equal radii from the AGN (at a ‘working surface’), radio emission may be produced by particle acceleration, thus originating the elongated structures. The impressive arc-like, mirror symmetric morphology of these features highlighted by the high resolution radio images (G13) may support this interpretation. On the other hand, the recent discovery of the third and fourth radio arc to the east-west direction (Gitti 2013; Kale & Gitti 2017) further complicates the picture. They could represent other radio bubbles ejected in a different direction, similarly to what observed in RBS 797 (Doria et al. 2012; Gitti et al. 2013), but again the absence of any correlation with the X-ray image disfavors this interpretation. In the model proposed by Wong et al. (2008), they could represent the result of particle acceleration produced at a working surface by a second pair of jets ejected to the east-west direction. This interpretation would imply the existence of radio jets emanating also from the northeast nucleus of the cD galaxy IC 5338, which however does not show a radio core.
In order to constrain the jet-precession scenario, we requested new Karl Jansky Very Large Array (JVLA) observations at 3 GHz and 5.5 GHz to estimate the spectral index distribution along the arcs and thus infer detailed information on the radiative age of the plasma in the radio arcs. According to the jet-precession model, due to the gradual formation of the structures, the plasma along the arcs should exhibit a monotonic trend from one end to the other in the radiative age distribution, and thus also in the spectral index. The differences in radiative age between the opposite ends of each arc would represent a measure of the time required to create the arcs, and therefore it would also provide an estimate of the precession time of the jets.
We adopt a cosmology with km , . The cluster luminosity distance is 232 Mpc, leading to a conversion of 1 arcsec = 1.1 kpc222https://ned.ipac.caltech.edu/.
2 Observation and Data Reduction
We performed new observations of the radio source A2626 at 3 GHz
and 5.5 GHz with the JVLA in C-configuration (see Table LABEL:obs.tab for details
regarding these observations). In all observations the source 3C 48
(J01373309) was used as the primary flux density calibrator, while
the sources J00160015 and 3C 138 (J05211638) were used as secondary
phase and polarization calibrators, respectively. Data reduction was
done using the NRAO Common Astronomy Software Applications package
(CASA), version 4.6. As a first step we carried out a careful editing
of the visibilities. In particular, the 3 GHz dataset required an
accurate flagging to remove every radio frequency interference (RFI),
that are quite common in this radio band. Overall, we removed about
10 of the visibilities in the 5.5 GHz dataset and 20 in the 3
GHz one, by repeating manual and automatic flagging with the modes
MANUAL and RFLAG of the CASA task FLAGDATA. Due to the visibility loss, the bandwidth of the 3 GHz
observation decreased from 2.0 GHz (2.0-4.0 GHz) to 1.6 GHz (2.4-4.0
GHz), thus moving the central frequency from 3.0 GHz to 3.2 GHz. We
performed a standard calibration procedure333e.g., see the
Tutorials,
https://casaguides.nrao.edu/index.php/ for
each dataset, and the target was further self-calibrated.
Due to the presence of several bright radio sources in the field of view, we carried out the imaging procedure, with the task CLEAN, on a region centered on the cluster, in order to remove as best as possible their secondary lobes. To this purpose, we used gridmode=WIDEFIELD to parametrize the curvature of the sky regions far from the phase center. We also used the MS-MFS algorithm (Rau & Cornwell 2011) by setting a two-terms approximation of the spectral model (nterms=2) and the multi-scale clean (multiscale=[0,5] on the point-like and beam scales) to reconstruct as best as possible the faint extended emission.
| PI: Dr. Myriam Gitti | 5.5 GHz | 3 GHz |
|---|---|---|
| [C-band] | [S-band] | |
| Observation Date | 19-Oct-2014 | 14-Dec-2014 |
| Frequency Coverage (GHz) | 4.5-6.5 | 2.0-4.0 |
| Array Configuration | C | C |
| On source Time | 44 m | 63 m |
3 Results
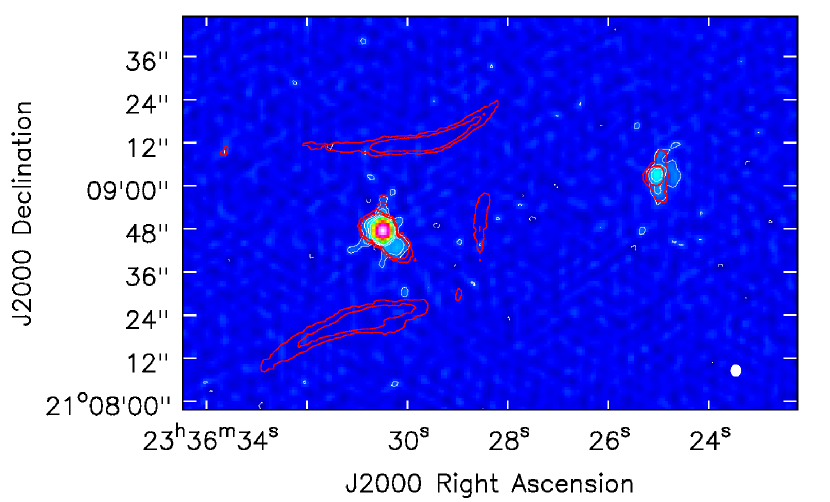
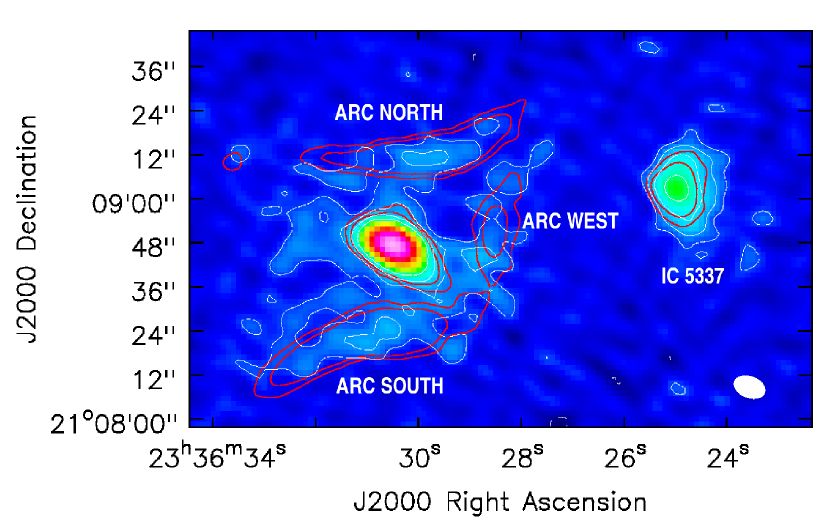
We report here the most relevant results of our analysis. For each observing band, we produced three different types of maps by varying the relative weight between short and long baselines. The UNIFORM maps, obtained by setting weighting=UNIFORM, nterms=1, give a uniform weight to all spatial frequencies, thus enhancing angular resolution. The NATURAL maps, obtained by setting weighting=NATURAL, nterms=1, give more weight to low spatial frequencies thus degrading angular resolution but at the same time maximizing the sensitivity to the diffuse, extended emission sampled by short baselines. Finally, the ROBUST 0 maps, obtained by setting weighting=BRIGGS, ROBUST=0, nterms=2, have resolution and sensitivity half-way between UNIFORM and NATURAL. We report the maps in Fig. 1 (5.5 GHz) and Fig. 2 (3 GHz), whereas the flux density values measured on each map are reported in Tab. LABEL:flulli.tab. Typical amplitude calibration errors are at 3, therefore we assume this uncertainty on the flux density measurements. In the following analysis we assume the 7 rms levels at 1.4 GHz (shown in red in Fig. 2, middle panel) as reference contours for the size and position of the arcs and of the unresolved core, as they best trace the morphology of the features seen at 1.4 GHz (G13).
3.1 5.5 GHz maps
The published map at 4.8 GHz (G13) does not show diffuse radio emission neither discrete features like the radio arcs seen at 1.4 GHz. The new observations presented in this work were performed with a more compact configuration of the array and with the larger receivers band of the JVLA, thus reaching an unprecedented high sensitivity. This allowed us to detect faint extended emission around IC5338 and IC5337 for the first time at 5.5 GHz.
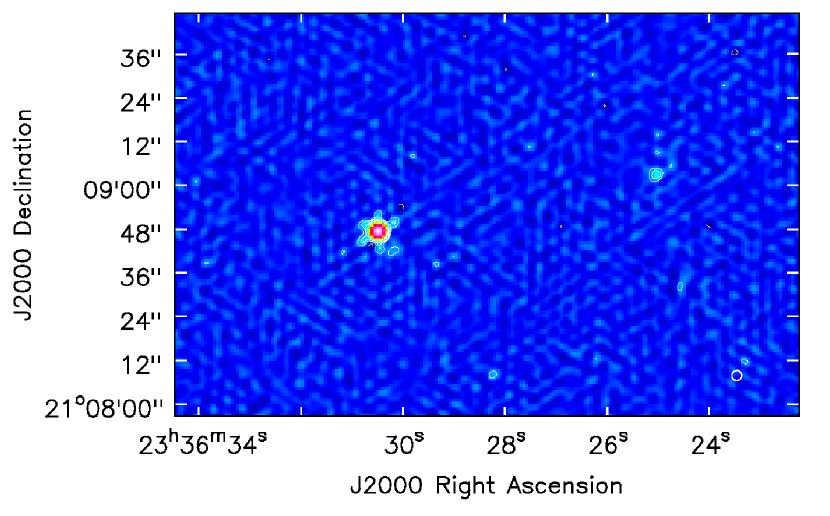
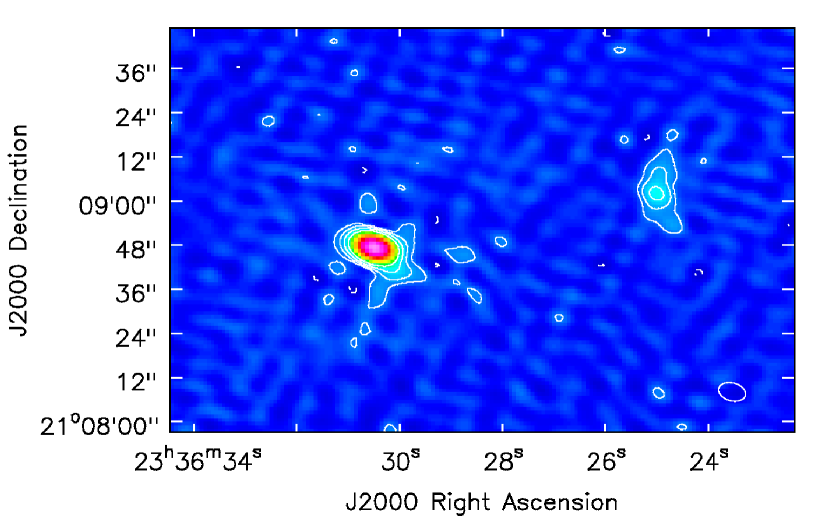
We report the 5.5 GHz maps in Figure 1. The UNIFORM (top panel) and the ROBUST 0 (middle panel) maps, which have a resolution of and , do not show extended emission around IC5338, except for the jet-like feature at south-west that was yet observed at 1.4 GHz by G13. On the other hand, in the ROBUST 0 map the close source on the left, IC5337, exhibits an extended emission in addition to the radio core already detected by G13. Due to its optical properties indicating that the galaxy is leaving a trail of cold gas, IC5337 has also been classified by as a jellyfish galaxy (Poggianti et al. 2016). Therefore, the disrupted radio morphology agrees with previous dynamical studies of the cluster (Mohr et al. 1996) indicating that IC5337 is moving toward IC5338.
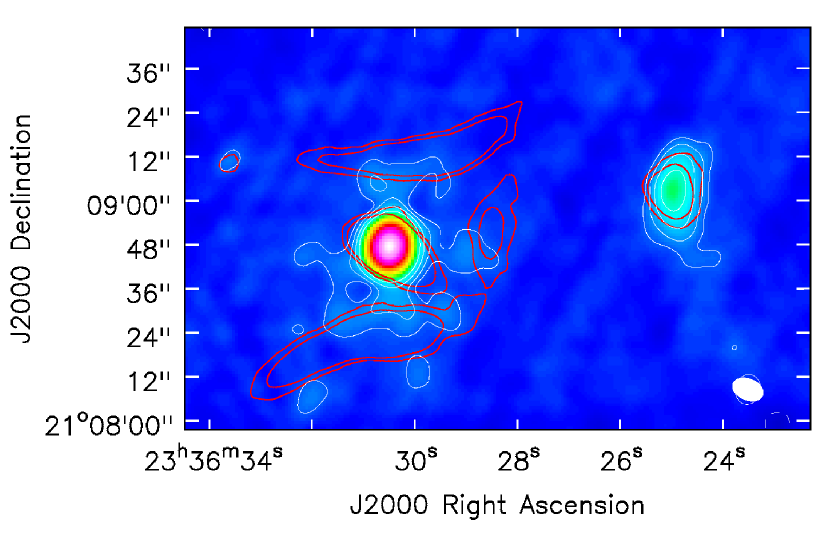
In the bottom panel of Fig. 1 we show the NATURAL map at a resolution of , obtained by further imposing a UV tapering to 20 k to maximize the sensitivity to the short spatial frequencies. In this high-sensitivity, low-resolution image we detected extended emission around IC5338. The emission region extends up to 27′′ ( 30 kpc) and is located inside the radio arcs known at 1.4 GHz (G13). We measure a total flux densities of 8.2 0.2, of which 6.20.2 mJy are contributed by the core, thus leaving an estimate of 2.00.3 mJy related to the extended emission. The nature of this radio emission is uncertain. On the one hand, due to its position, it may be contributed by the emission of the radio arcs and of the inner AGN jets. On the other hand, it may indicate the presence of a diffuse radio mini-halo.
We note that the core flux density measured in these new 5.5 GHz maps differs from that reported by G13 in the same band, which is 9.60.3 mJy. We accurately checked the flux calibration procedure in both observations finding no trivial problems, therefore this flux difference may indicate variability, and therefore activity, of the IC5338 core. By observing hard X-rays emission from its core, Wong et al. (2008) suggested that IC5338 hosts an AGN. The jet-like features observed at 1.4 GHz by G13 and the likely variability of the radio emission that we observe are consistent with this hypothesis.
3.2 3 GHz maps
The 2.0-4.0 GHz band is the new radio window observed with the JVLA. This is also the transmission band of the communication satellites, so it is populated by radio interferences which may jeopardize the observations. The maps we present here have been produced after an accurate editing of the target visibilities. The UNIFORM map (Fig. 2, top panel) exhibits only the emission of IC5338 and the extended emission of IC5337. The ROBUST 0 map at a resolution of (Figure 2, middle panel) shows several patches of extended emission. By superposing the 1.4 GHz contours by G13 (in red), we confirm that the new features detected in this band are the radio arcs already seen at 1.4 GHz. Remarkably, we identify a feature to the east which resembles the diffuse emission detected by G13 (see their Fig. 3), but it does not coincide entirely with the eastern arc discovered by Kale & Gitti (2017). Due to the low resolution of this map, the inner part of IC5338 is unresolved.
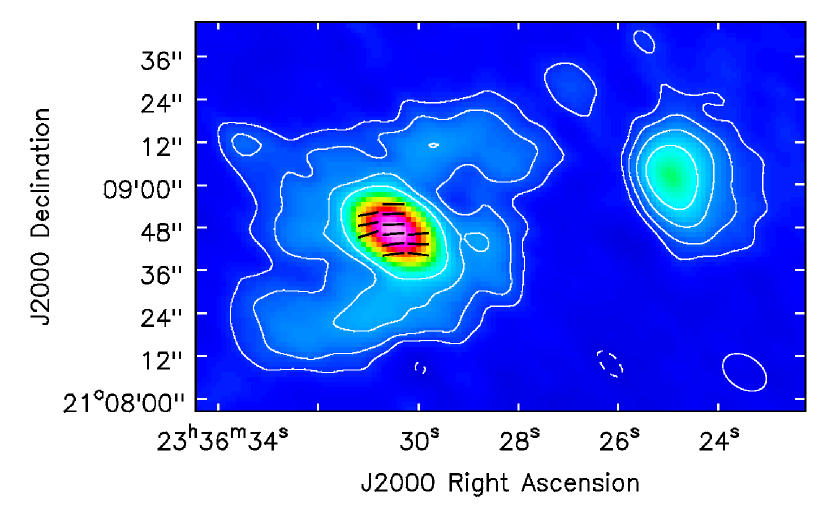
For this band we produced also a polarization intensity map. We combined the stokes components, Q and U, of the emission to compute the vector and total intensity maps of linear polarization. We set the weights to NATURAL to improve the signal-to-noise ratio (SNR) of the arcs. The NATURAL map in Fig. 2, bottom panel, shows an overlay of polarization vector and total intensity contours. We observe only a small percentage () of polarized emission from the core, whereas we do not observe polarized emission from the arcs. By comparing the rms of the polarized emission map with the peak flux density of the arcs, we estimate an upper limit for the polarized emission fraction of the arcs of 555We note that the low resolution map is affected by the beam depolarization effect, so high-resolution observations are needed to confirm the lack of polarized emission from the radio arcs at 3 GHz..
| Weighting | Component | Flux density |
| [mJy] | ||
| 5.5 GHz maps (Fig. 1) | ||
| Total | 6.70.2 | |
| UNIFORM | Core | 6.70.2 |
| IC 5337 | 0.20.1 | |
| Total | 7.40.2 | |
| ROBUST 0 | Core | 6.00.2 |
| IC 5337 | 0.50.1 | |
| Total | 8.20.2 | |
| NATURAL | Core+jets | 6.20.2 |
| IC 5337 | 0.50.1 | |
| 3 GHz maps (Fig. 2) | ||
| Total | 12.10.5 | |
| UNIFORM | Core+jets | 11.70.4 |
| IC 5337 | 1.60.3 | |
| ROBUST 0 | Total | 14.60.4 |
| Core+jets | 12.00.4 | |
| Arc Noth | 0.40.1 | |
| Arc South | 0.50.1 | |
| Arc West | 0.50.1 | |
| IC 5337 | 1.50.1 | |
| NATURAL | Total | 16.50.5 |
| Core+jets | 10.90.3 | |
| Arc Noth | 0.70.1 | |
| Arc South | 0.80.1 | |
| Arc West | 0.40.1 | |
| IC 5337 | 2.20.1 |
3.3 Spectral Index maps
By combining the new JVLA observation at 3 GHz with the VLA ones at 1.4 GHz obtained with the VLA in A+B configuration (G13), we produced a spectral index map of the extended emission of A2626. We produced the input maps by setting weighting=UNIFORM, UVRANGE=0-40, UVTAPER=0-20, RESTORINGBEAM=, nterms=1, multiscale=[0,5]. We improved the sensitivity to the faint, extended emission of the UNIFORM maps by applying a UVTAPER and by enlarging the beam to improve the SNR. The rms of the 1.4 GHz and 3 GHz maps are 31.9 and 29.1 Jy beam-1.
In calculating the spectral index value in each pixel of the map, we excluded regions where the 1.4 GHz brightness is rms level. We further corrected the spectral index map for the bandwidth effect described by Condon (2015). Due to the large receiver bandwidth of the JVLA, the flux density the we measure on the 3 GHz maps may not coincide with the flux at 3.2 GHz, which is the arithmetical center of our band, but instead it may be the flux density at an equivalent frequency, , defined as:
| (1) |
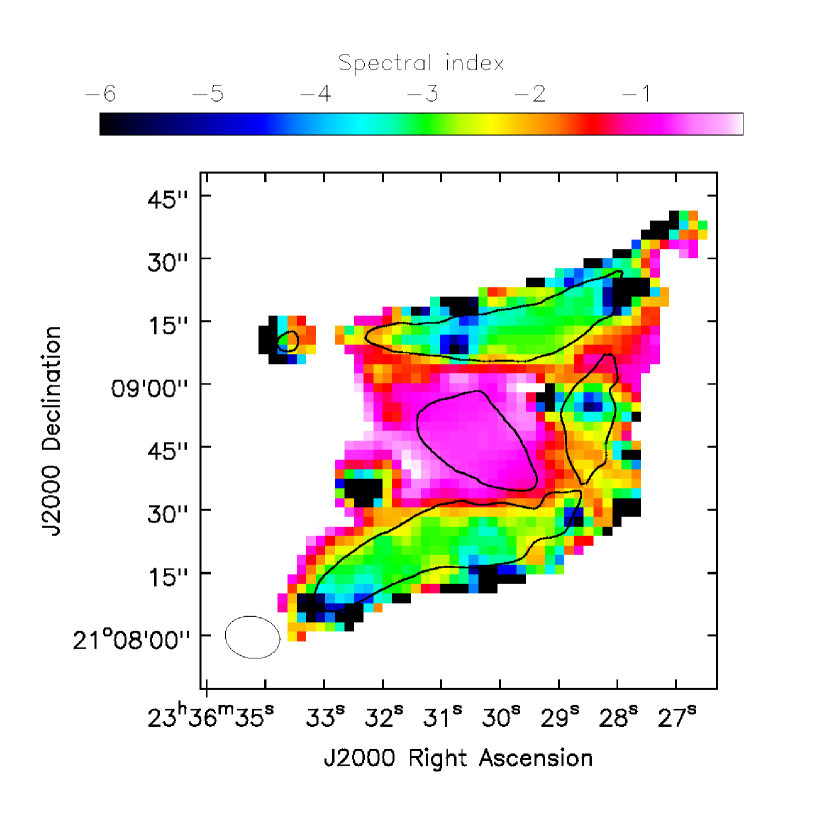
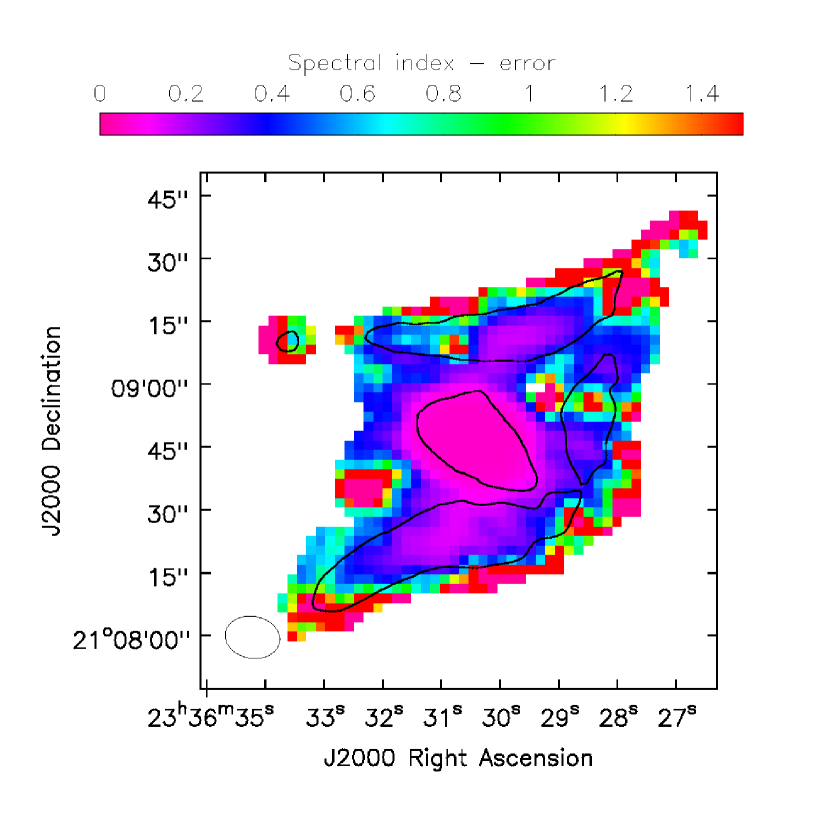
where and (expressed in GHz) are the ends of the bandwidth and is the spectral index. According to this relation, is a function of , which is, in turn, a function of the frequencies. In order to correct the spectral index map, which was computed between 1.4 and 3.2 GHz, we derived numerically the correction for the spectral indices. According to our bandwidth (2.4-4.0 GHz), we estimated a first set of equivalent frequencies for a set of spectral indices between -0.1 and -7.0. We then corrected the spectral indices for the equivalent frequencies, thus obtaining a new set that allowed us to estimate again a new set of equivalent frequencies . We repeated this cycle until it converges to the final values and . We then obtained by numerical fit the relation that we finally applied to the each pixel of the uncorrected spectral index map with the task immath of CASA. With the relation we re-scaled also the relative spectral index error map. We report the corrected spectral index map, and the relative error map, in Fig. 3.
The spectral index map disentangles the extended emission in two major components, the unresolved core with a flat spectral index666As a word of caution we note that the spectral index in the central region may be unreliable due to the core variability, because the observations are separated by five years. and the arcs with steep spectral index , that is consistent with the recent results by Kale & Gitti (2017). We measured the mean spectral index inside the 1.4 GHz reference contours (Fig. 2, middle panel) for the northern, southern and western arcs, finding , and , respectively. The unresolved core has a mean spectral index .
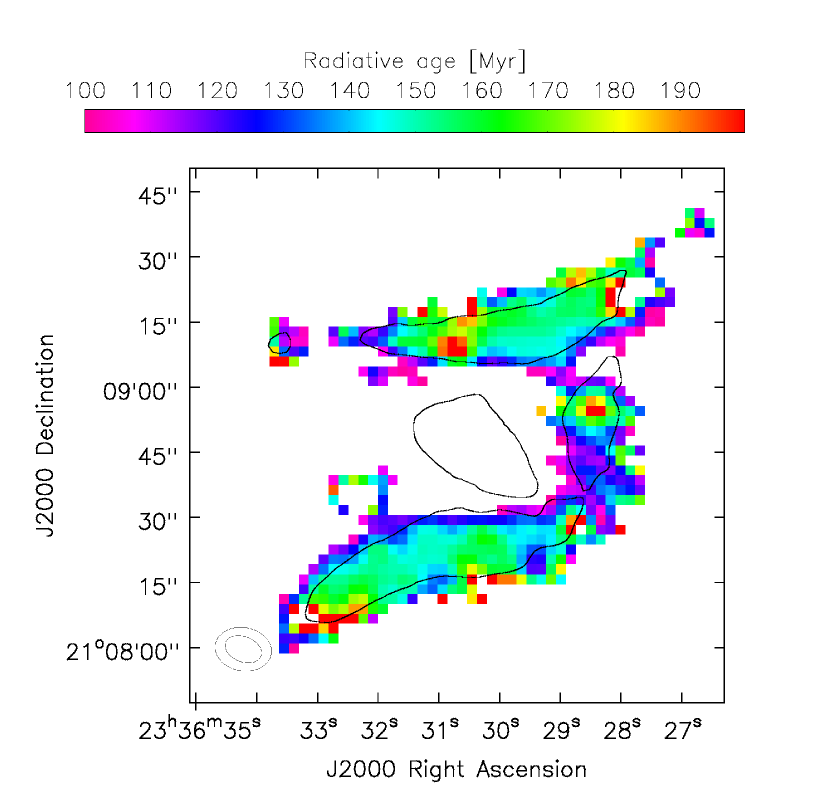
3.4 Radiative age maps
The continuous radiative loss modifies the spectrum of the emitting particles by steepening it. So, it is possible to estimate the radiative age, , of the emitting plasma from the break frequency, , of its synchrotron spectrum and the magnetic field, , that produces the radio emission (e.g., Eq. 2 of Murgia et al. 1999)777Note that we are only considering the effect of radiative losses on the evolution of the energy of electrons. From this relation, it is possible to demonstrate that the radiative life-span, for a given , is maximized by a magnetic field G, where G is the equivalent magnetic field of the inverse Compton emission and is the redshift of the radio source. By integrating numerically the synchrotron emission spectrum, we derived a relation for a population of particles with a energy distribution function and a magnetic field that is uniform and constant over the radio source. We assumed a G as magnetic field, and =2.4 for the energy distribution function, that we derived from the hypothesis of the jet-precession model. If the plasma of the arcs was initially accelerated in an hot-spot, then it had an initial spectral index (e.g. Meisenheimer et al. 1997), and so . Therefore, the map exhibits the upper limit of the time required to the spectrum to steepen from to the values that we observe in Fig. 3. Due to our assumptions, it was not possible to evaluate the in those regions which emit with a spectral index flatter than .
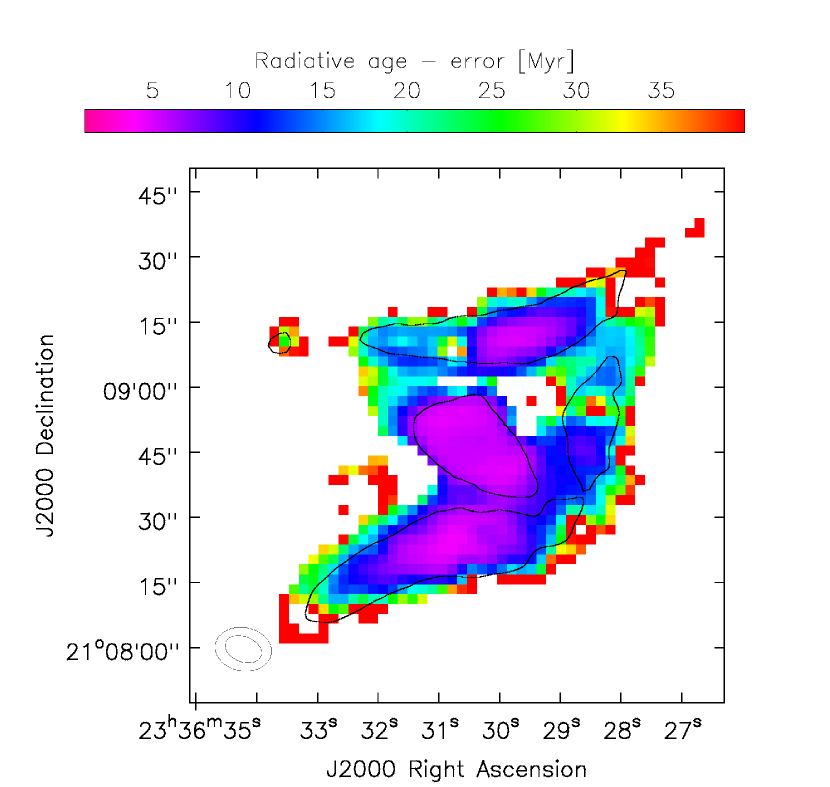
We computed the spectral map in Fig. 3 with the relation and we obtained the radiative age map. Moreover, we obtained the relative error map on the radiative age from the spectral index error map by estimating the radiative age associated to the upper and lower limits of the spectral index map. We report the radiative age map and the relative error map in Fig. 4. To obtain an indicative estimate of the mean upper limit on the radiative age, we averaged the values of the map inside the 1.4 GHz reference contours (Fig. 2, middle panel). We measured 157 Myr, 148 Myr and 136 Myr for the northern, southern and western arcs, respectively, which can be considered as an estimate of the maximum time elapsed since the particle acceleration. The average radiative age error, , on those regions is 12 Myr.
4 Discussion
The new JVLA observations presented in this work add important information to the general picture of A2626, and allowed us to test for the first time the jet-precession model.
The spectral index map in Fig. 3 exhibits that the arcs are steep-spectrum radio sources, with . We do not observe at any of the arcs ends, which should be the initial spectral index of the plasma, so we argue that the activity has ceased. The radiative map that we provide (Fig. 4) does not show the real age of the arcs, but only an upper limit of it, because we do not know the real strength of the magnetic field in the arc regions. However, it is useful to constrain the time-scale of the jet-precession by considering the difference between the radiative age at the ends of each arc, . This can be considered as a measure of the time required by the jets to cover the arc length, thus it is an estimate of the time-scale of the precession period of the jets.
According to the jet-precession scenario, the relativistic plasma of the arcs was accelerated gradually along the structures by a pair of precessing jets. Therefore, the spectral index distribution along the arcs may reflect the gradual formation of the structures, by showing a monotonic steepening trend from one end to the other, where the emission with the flattest spectral index comes from the most recently accelerated plasma. Moreover, the trends along the northern and southern arcs should be anti-symmetric due to the geometry of the jet-precession (if the northern arc is created from west to east, then the southern arc must be created from east to west), and they should be observable also in the radiative age maps.
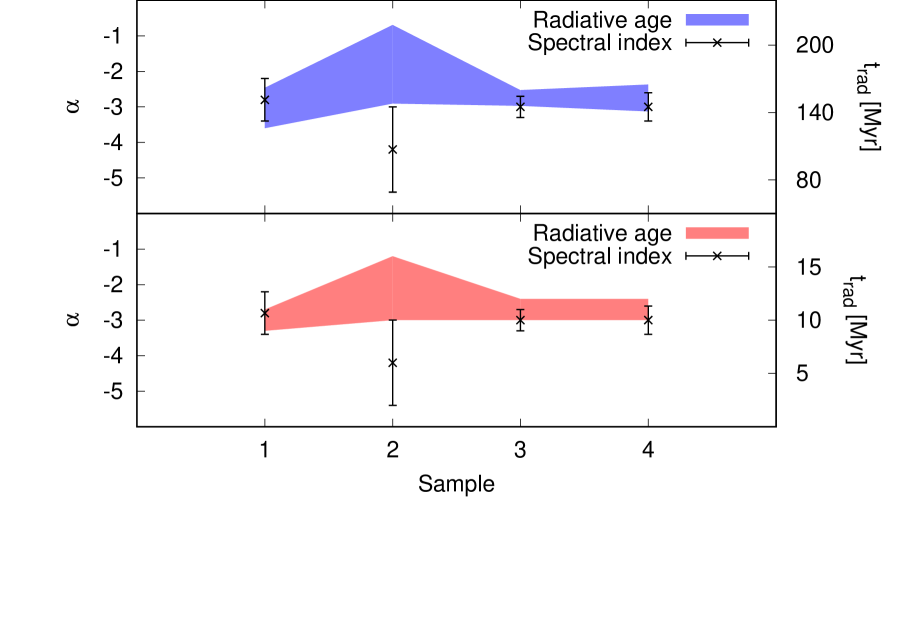
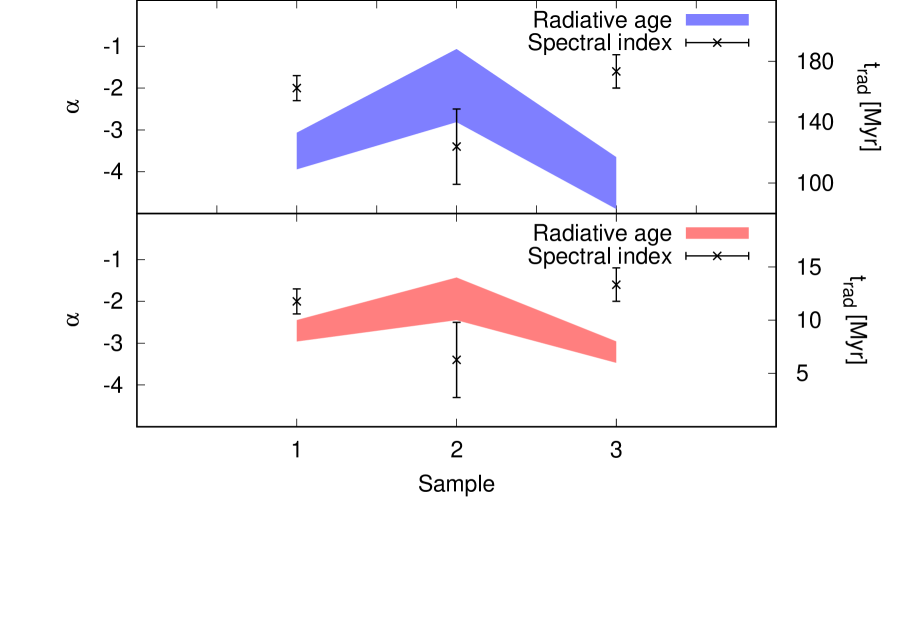
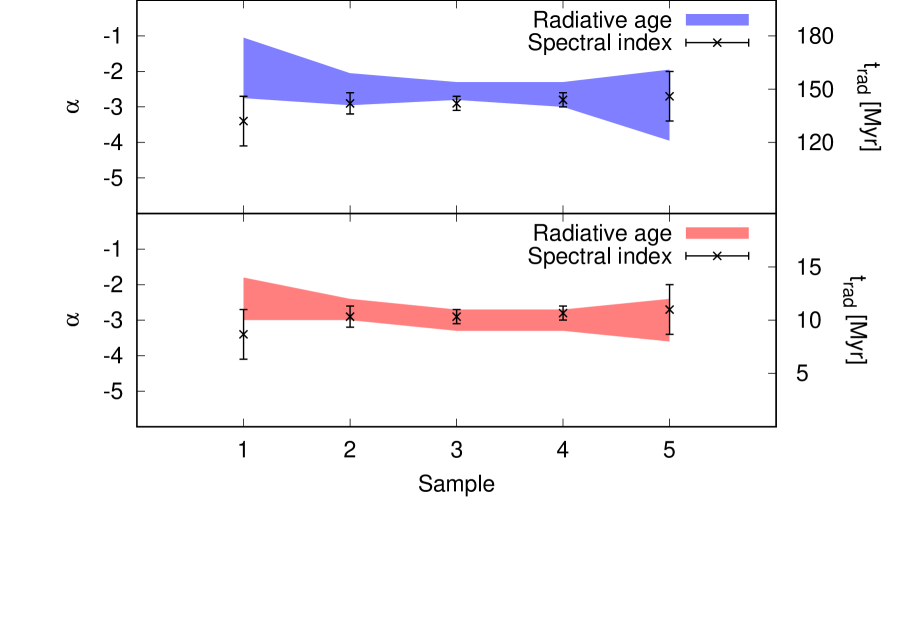
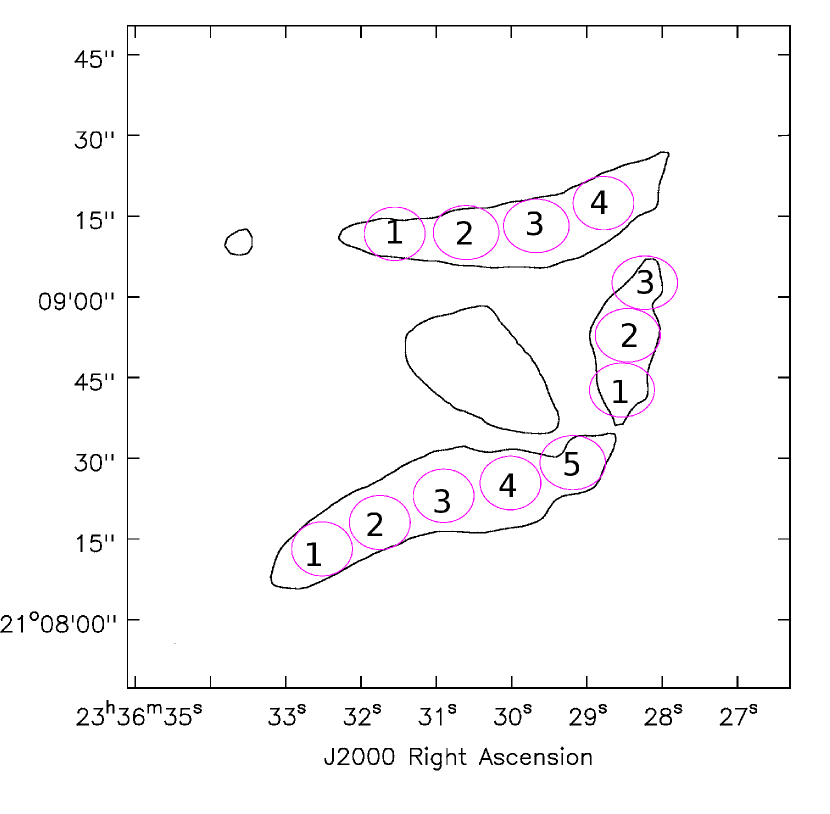
Observationally, the spectral index map (Fig. 3) does not show any clear evolution in the spectrum along the arcs, hinting at the absence of the age progression expected by the precession model. In order to quantitatively confirm this result, we sampled both the spectral index and the radiative age maps with the sampling reported in Fig. 5 (bottom-right panel) and we measured the values, with the relative errors, of each sample. The samples are as large as the beam () and cover the area delimited by the 1.4 GHz reference contours shown in Fig. 2, middle panel. We report the result of our analysis on each arc in Fig. 5.
We estimated the radiative age trend also by assuming the reference equipartition magnetic field. From the formula provided by Govoni & Feretti (2004, Eq. 22), by assuming that the spectral index of the arcs at 100 MHz is 888The classical equipartition formula (Pacholczyk 1970) is obtained for a power law energy distribution of electrons. However, we detect a synchrotron spectrum whose properties are affected by radiative ageing. In order to correct for this effect, we estimated the spectrum of the arcs at lower frequencies, where ageing is not important and the assumption of power-law energy distribution is satisfied. In particular, we calculated the emission at frequency 100 MHz by re-scaling the spectrum measured at 1.4 GHz according to the synchrotron spectrum with a break frequency derived from the spectral slope between 1.4 GHz and 3.0 GHz, obtaining an estimated flux density at 100 MHz of 260 mJy., that the arcs have a cylindrical volume and that the energy in electrons and protons is equally distributed (=1), we estimated a equipartition field strength of G. Depending on the magnetic field, the mean radiative age of the arcs decreases from 140 Myr to 10 Myr, whereas the mean error on it decreases from 10 Myr to 1 Myr. Due to the uncertainties in the assumptions made to derive the equipartition magnetic field, in the following discussion we consider the estimates of radiative age upper limits provided by .
The plots in Fig. 5 show that the radio arcs do not exhibit significant spectral index or radiative age trends. By considering the uncertainties of our measures, we derived an estimate of the maximum difference between the radiative time scale of 22 Myr, 26 Myr and 22 Myr for the northern, southern and western arcs, respectively. This corresponds to an estimate of the upper limit on the time required by the jets to cover the arc length.
In order to test the jet-precession model, we compared our result with a theoretical estimate of the precession period. Wong et al. (2008) argued that the jet-precession may be triggered by the mutual gravitational interactions of the optical cores of IC5338. The precession period, , of the jets of a binary system in the center of a galaxy cluster can be estimated with the relation proposed by Pizzolato & Soker (2005). We re-scaled the relation that they provide according to the parameters that we observe:
| (2) |
where and are, respectively, the sum and the ratio of the masses of the black holes, is their distance, is the radius of the accretion disk and is the angular difference between the accretion disk and the plane of the orbit of the black holes. In the case of A2626, the masses of the objects and the accretion disk radius are unknown, so we assumed a mass of M⊙ (so 2 M⊙, =1), that is the typical mass of the supermassive black holes (SMBH) located at the center of cD galaxies, and the typical accretion disk radius pc. The observed projected distance between the cores, which is a lower limit to their real distance, is =3.3 kpc. Moreover, also is unknown, therefore we assume for simplicity that the accretion disk is on the same plane of the orbit (). From these assumptions, we estimated a lower limit for the precession time Gyr, that is not in agreement with the that we measure. This estimate is also much greater than the age of the universe, thus challenging the hypothesis that the two nuclei are currently producing the jet-precession. More specifically, from the formula proposed by Pizzolato & Soker (2005), the distance between the two cores that admits a precession period is:
| (3) |
Consequently, at the epoch of particle acceleration (corresponding to Myr ago) the two cores had to have a separation of just few pc. Alternatively, the precession should have been generated by the interactions with a secondary SMBH which is yet undetected (likely not active), rather than with the northern optical core of IC5338. Therefore, we argue that the dynamical process behind the origin of the radio arcs may be more complex than the scenario initially proposed by Wong et al. (2008). At the same time, however, the lack of a clear optical core candidate makes the precession model less appealing, and other scenarios for the origin of the radio arcs should be investigated in the future.
We finally note that, by combining the results of our spectral analysis with the spectral maps provided by Kale & Gitti (2017), we may argue that the radio spectrum of the arcs has a steep spectral index from 610 MHz to 3 GHz, and this is not in agreement with the expected evolution of the radio spectrum of the hot-spots. The AGN-driven nature of the radio arcs through jet precession may be further challenged by the fact that we observe four arcs, which would require the presence of two pairs of radio jets, powered by two radio cores inside IC5338. However, only one radio AGN (with jets) is currently observed, whereas the other one remains undetected (although it is still possible that it was active in the past and has recently shut down).
5 Summary and Conclusion
We presented the results of new JVLA observations of A2626 at 3 GHz and 5.5 GHz, which were requested in order to test the jet-precession model for the origin of the radio arcs. We achieved the first detection at high frequency of an extended component of radio emission at 5.5 GHz and we observed for the first time the radio arcs at 3 GHz. Moreover, we observed the extended emission of IC5337 at 3 GHz and 5.5 GHz.
By combining the archival 1.4 GHz observation (G13) with the new one at 3 GHz, we produced new spectral index maps that allowed us to disentangle the extended emission of the cluster in two main components – the inner, flat-spectrum emission (), and the ultra-steep spectrum () arcs. In order to find constraints for the jet-precession model, we converted the spectral index map into radiative age maps and we studied the trends of spectral index and radiative time along the arcs. We found that the radio arcs do not exhibit significant spectral index or radiative age evolution. By considering the uncertainties on our measures, we estimated an upper limit of the precession period Myr. We also estimated a mean radiative age of Myr, that may be considered as a measure of the time elapsed since the hot-spot ceased to accelerate the particles.
We then compared our results with a theoretical precession period estimated for the current kinematics of the IC5338 system, finding a disagreement. Therefore, we argue that the dynamics of the cores that produced the jet-precession and created the radio arcs may be more complex than the scenario proposed by Wong et al. (2008). On the other hand, our results put strong constraints for every future model which relates the origin of the radio arcs to the activity of the inner AGN, or indicate a different origin of the radio arcs.
Acknowledgments
We thank the referee for the prompt response and constructive comments. AI thanks R. Paladino for helpful advices during the data reduction with CASA. We thank A. Bonafede, M. Bondi and D. Dallacasa for useful discussions. MG, GB, GG, LF acknowledge partial support from PRIN-INAF 2014.
References
- Bravi et al. (2016) Bravi, L., Gitti, M., & Brunetti, G. 2016, MNRAS, 455, L41
- Brunetti & Jones (2014) Brunetti, G. & Jones, T. W. 2014, International Journal of Modern Physics D, 23, 30007
- Condon (2015) Condon, J. 2015, ArXiv e-prints
- Doria et al. (2012) Doria, A., Gitti, M., Ettori, S., et al. 2012, ApJ, 753, 47
- Feretti et al. (2012) Feretti, L., Giovannini, G., Govoni, F., & Murgia, M. 2012, A&A Rev., 20, 54
- Gitti (2013) Gitti, M. 2013, MNRAS, 436, L84
- Gitti et al. (2012) Gitti, M., Brighenti, F., & McNamara, B. R. 2012, Advances in Astronomy, 2012
- Gitti et al. (2004) Gitti, M., Brunetti, G., Feretti, L., & Setti, G. 2004, A&A, 417, 1
- Gitti et al. (2002) Gitti, M., Brunetti, G., & Setti, G. 2002, A&A, 386, 456
- Gitti et al. (2013) Gitti, M., Giroletti, M., Giovannini, G., Feretti, L., & Liuzzo, E. 2013, A&A, 557, L14
- Govoni & Feretti (2004) Govoni, F. & Feretti, L. 2004, International Journal of Modern Physics D, 13, 1549
- Kale & Gitti (2017) Kale, R. & Gitti, M. 2017, MNRAS, 466, L19
- Meisenheimer et al. (1997) Meisenheimer, K., Yates, M. G., & Roeser, H.-J. 1997, A&A, 325, 57
- Mohr et al. (1996) Mohr, J. J., Geller, M. J., & Wegner, G. 1996, AJ, 112, 1816
- Murgia et al. (1999) Murgia, M., Fanti, C., Fanti, R., et al. 1999, A&A, 345, 769
- Pacholczyk (1970) Pacholczyk, A. G. 1970, Radio astrophysics. Nonthermal processes in galactic and extragalactic sources, ed. Pacholczyk, A. G.
- Pizzolato & Soker (2005) Pizzolato, F. & Soker, N. 2005, Advances in Space Research, 36, 762
- Poggianti et al. (2016) Poggianti, B. M., Fasano, G., Omizzolo, A., et al. 2016, AJ, 151, 78
- Rau & Cornwell (2011) Rau, U. & Cornwell, T. J. 2011, A&A, 532, A71
- Struble & Rood (1999) Struble, M. F. & Rood, H. J. 1999, ApJS, 125, 35
- Wong et al. (2008) Wong, K.-W., Sarazin, C. L., Blanton, E. L., & Reiprich, T. H. 2008, ApJ, 682, 155