X-ray emission from the nuclear region of Arp 220
Abstract
We present an imaging and spectral analysis of the nuclear region of the ULIRG merger Arp 220, using deep Chandra-ACIS observations summing up to . Narrow-band imaging with sub-pixel resolution of the innermost nuclear region reveals two distinct Fe-K emitting sources, coincident with the infrared and radio nuclear clusters. These sources are separated by 1’ ( pc). The X-ray emission is extended and elongated in the eastern nucleus, like the disk emission observed in millimeter radio images, suggesting starburst dominance in this region. We estimate Fe-K equivalent width keV for both sources, and observed 2-10 keV luminosities (W) and (E). In the 6-7 keV band the emission from these regions is dominated by the 6.7 keV Fe xxv line, suggesting contribution from collisionally ionized gas. The thermal energy content of this gas is consistent with kinetic energy injection in the interstellar medium by Type II SNe. However, nuclear winds from hidden AGN () cannot be excluded. The upper limits on the neutral Fe-K flux of the nuclear regions correspond to intrinsic AGN 2-10 keV luminosities (W) and (E). For typical AGN SEDs the bolometric luminosities are (W) and (E), and black hole masses (W) and (E) for Eddington limited AGNs with a standard 10% efficiency.
1 INTRODUCTION
At a distance of 80 Mpc (Kim & Sanders, 1998), Arp 220 (IC 4553/4) is both a merger, and the nearest Ultra-luminous IR Galaxy (ULIRG; Soifer et al., 1987; Sanders & Mirabel, 1996). Near IR high-resolution (0.1”) NICMOS-HST imaging identifies the two nuclear regions of the merging galaxies, which are coincident with the two components of a double radio source (Baan & Haschick, 1995; Scoville et al., 1998). At a separation of 1” (380 pc at a distance of 80 Mpc 111In the following, we adopt the standard flat cosmology with and (Planck Collaboration et al., 2016).), these nuclei are closer together than the nuclei of NGC 6240 ( pc separation, Komossa et al. 2003), and therefore may be subject to even stronger gravitational interaction, leading to accretion on the nuclei of the merging galaxy (e.g., Governato et al., 1994; Mayer et al., 2007).
The presence of AGN emission in addition to intense star formation in the two nuclei has been debated. It is also not clear where this AGN emission may reside. AGN contribution to the bolometric luminosity between and () is suggested by the Spitzer Mid-IR spectrum of the central 8” region of Arp 220 (Veilleux et al. 2009; Nardini et al. 2010; more recent Herschel results (Rangwala et al., 2011) and modeling of the nuclear spectra (Contini, 2013) agree with this conclusion. In the west nucleus of Arp 220 the presence of a maser (Aalto et al., 2009) and a rotating massive molecular disk (Downes & Eckart, 2007) suggests a massive nuclear black hole. Instead, IRAM-PdBI observations (König et al., 2012) showed in the eastern nucleus of Arp 220 an extended structure in the mm-CO gas emission, elongated in the NE-SW direction, and suggested a highly dust-obscured nucleus lying between the two NIR sources detected by Scoville et al. (1998). Recently, an analysis of 3.5 and 1.2 mm IRAM-PdBI data performed by Tunnard et al. (2015) provided evidence of significant chemical differences between the two nuclei. These authors argue for a significant AGN contribution to the W nucleus luminosity, and starburst dominance in the E nucleus. ALMA imaging at 350 and 696 GHz (Scoville et al., 2015) suggested compact nuclear disks with masses of and for W and E nucleus, respectively, within a radius . High-resolution VLA observations at 33 and 6 GHz by Barcos-Muñoz et al. (2015) showed double radio morphology. These authors estimated for both nuclei high hydrogen column densities , and the star formation rate surface densities among the most extreme measured for any star-forming system (), without any compelling evidence of an AGN dominating the nuclei emission at 33 GHz.
The M- relation (e.g., Magorrian et al., 1998) has suggested that the evolution of galaxies and super-massive nuclear black holes are linked. Both the stellar population and the SMBH of a galaxy are thought to grow and evolve by merging of smaller gas-rich galaxies and their nuclear SMBHs (Di Matteo et al., 2005; Hopkins et al., 2008). During this process, the SMBH may be “buried” by thick molecular gas, which feeds the SMBH at high rates, causing the birth of an obscured Compton Thick (CT, Risaliti et al., 1999; Levenson et al., 2006) Active Galactic Nucleus (AGN). In this paper we re-examine the X-ray emission of Arp 220. A high resolution study of the archival ks Chandra ACIS observation (obsid 869; Clements et al., 2002) measured the hard X-ray luminosity of the central AGN but had insufficient signal to noise ratio and spatial resolution to detect a line or to spatially untangle the complex central emission. The X-ray spectrum extracted from the central ” region suggested hard continuum and keV Fe-K emission line. A subsequent XMM-Newton observation detected Fe-K line emission centered at 6.7 keV with an equivalent width EW keV (Iwasawa et al., 2005) suggesting highly photoionized, low-density gas illuminated by a hidden CT AGN. A reanalysis of the Chandra and XMM-Newton data (LaMassa et al., 2011) only managed to set an upper limit on the neutral Fe-K emission at 6.4 keV.
Here we make use of new deep Chandra-ACIS data. Together with the archival observation, we reach a total exposure of , which allows us to perform a study of the X-ray emission from the nuclear region of Arp 220 with unprecedented detail, by means of sub-pixel imaging of Chandra ACIS data in narrow spectral ranges. This technique has been used successfully to study crowded emission regions of nearby Seyferts (e.g. in NGC 4151 Wang et al. 2011a, b, c; Mrk 573, Paggi et al. 2012). Our new look at the nuclear region of Arp 220, has resulted in the discovery of two sources in the 6-7 keV Fe-K band, spatially coincident with the near-IR and radio positions. In Section 2 we present the data reduction procedures for the imaging and spectral analysis; in Section 3 we discuss and interpret our results; in Section 4 we then draw our conclusions. In the following analysis we fix the Galactic absorption to the value .
2 Data Reduction
Chandra observations used in this analysis are listed in Table 1. Level 2 event files were retrieved from the Chandra Data Archive222http://cda.harvard.edu/chaser and reduced with the CIAO (Fruscione et al. 2006) 4.7 software and the Chandra Calibration Data Base (caldb) 4.6.7, adopting standard procedures. After excluding time intervals of background flares exceeding with the lc_sigma_clip task, we obtained a low-background total exposure time of ks. The nucleus has no significant pile up, as measured by the CIAO pileup_map tool333Pile-up occurs on X-ray CCDs for source with high flux levels, when two or more photons arrive within the same detector region within a single CCD frame integration time, and they are counted a single photon of higher energy(Davis, 2001)..
2.1 Imaging analysis
Imaging analysis was performed without pixel randomization to take advantage of the telescope dithering in event positioning and with the sub-pixel event repositioning (SER) procedure (Li et al., 2003). We used a pixel size 1/4 of , the native Chandra/ACIS detector pixel (see, e.g., Harris et al., 2004; Siemiginowska et al., 2007; Perlman et al., 2010; Wang et al., 2011a). Using the same Orion ACIS-S data as in the calibration of Li et al. (2003), we find a significant (improvement in PSF FWHM as defined in Li et al. 2003) from sub-pixel repositioning for an on-axis source at 6-7 keV ( at keV because of the narrower PSF at larger energies). Most of the imaging improvement is from sub-pixel event repositioning (SER) procedure (Li et al., 2003) and without pixel randomization, to take advantage of the sampling of the PSF by the well characterized spacecraft dither motion. Because of the similarly ‘peaked’ inner PSF, this is similarly effective at 2 and 6 keV.
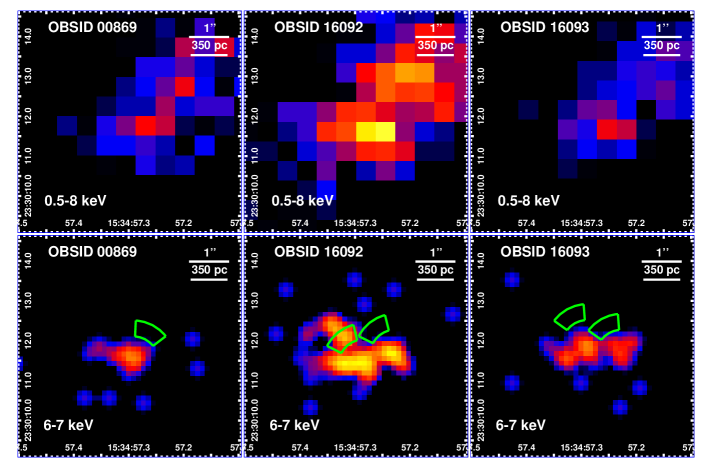
In the top panels of Figure 1 we show the central 5” region of Arp 220 as imaged by the three Chandra-ACIS observations in the broad 0.5-8 keV band with native pixel size. To merge the three exposures we first used the wavdetect task to identify point sources in the field of each observation (excluding the central region). We then used the reproject_aspect task to modify the aspect solutions minimizing position differences between these sources and finally merged the re-aligned images with the reproject_events task to reproject the event files to the deepest 16092 observation. The relative shifts between the observations is , comparable with the Chandra astrometric uncertainty.
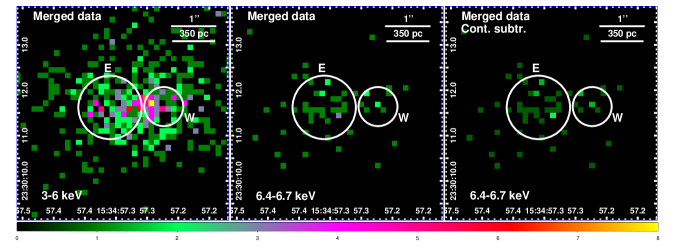
In the bottom panels of Figure 1 the same central 5” region is shown in the narrow Fe-K 6-7 keV band with sub-pixel binning of 1/4 of the native pixel size and 3 pixel FWHM gaussian filter smoothing. The narrow-band images for the deeper observations - 16092 and 16093 - show two sources associated with the West (W) and East (E) Arp 220 nuclei separated by 1” ( pc at the source distance), while in the shorter 00869 observation only the W nucleus is detected. The locations of these unique emission regions strongly argue for an identification of these sources with the nuclei of the merging galaxies. On the same panels we also show in green the position of the Chandra PSF artifacts as obtained with make_psf_asymmetry_region444http://cxc.harvard.edu/ciao/ahelp/make_psf_asymmetry_region.html tool for the two nuclei. PSF asymmetries are expected in the north-west direction for Obs ID 869, and in north-east direction for Obs IDs 16092 and 16093 (due to different roll angles). The two nuclear sources are not affected by PSF asymmetries, but the extension in the north-east direction of the E source, shown in the deepest observation 16092, overlaps with the region of Chandra PSF asymmetry which, however, can account for only up to 10% of the counts of this feature. The resulting merged images are shown in Figure 2 in the 3-6 (left panel), and 6.4-6.7 (central panel) keV bands with sub-pixel binning 1/4 of the native pixel size. In addition, in the right panel of the same figure we show the 6.4-6.7 keV band image after continuum (3-6 keV) subtraction (see Sect. 2.2). These images are indicative of continuum and Fe xxv line emission. The regions of W and E nuclei considered for spectral extraction discussed in Section 2.2 are shown as white circles.
Using PSF simulations performed with Chandra Ray Tracer (ChaRT555http://cxc.harvard.edu/chart/, Carter et al. 2003) taking into account the source spectrum, exposure time and off-axis angle, we applied the Expectation through Markov Chain Monte Carlo (Esch et al., 2004; Karovska et al., 2005, 2007; Wang et al., 2014) PSF-deconvolution algorithm to the merged images of the narrow-band emission. This method yields a multi-scale image reconstruction specifically applicable to Poisson noise limited data.
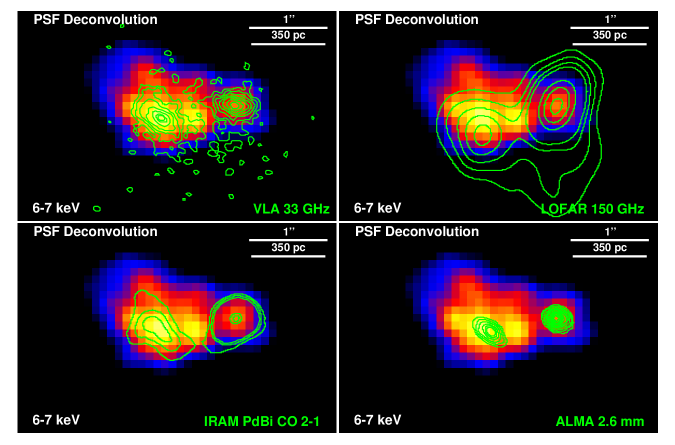
As noted by Clements et al. (2002), the lack of USNO detected stars in Arp 220 field does not allow accurate absolute astrometry using field stars. However, a comparison between the merged 6-7 keV Chandra-ACIS image and the high-resolution 33 GHz VLA observations (Barcos-Muñoz et al., 2015) shows a clear similarity in the morphology of the nuclei. In order to highlight the morphological similarity between the X-ray and the radio emission, we shifted the VLA 33 GHz sources shifting the latter in the NE direction by (compatible with the Chandra astrometric accuracy, Rots & Budavári 2011) in order to match the position of the western radio lobe with the western X-ray nucleus, that appears less extended and allows therefore a more accurate positioning. The result of this registration procedure is shown in Figure 3. In both the X-ray image and the radio contours the W nucleus looks compact while the E nucleus appears somewhat extended. We performed a similar registration with radio contours of 150 MHz LOFAR continuum and CO 2-1 IRAM PdBi images (Varenius et al., 2016), and with 2.6 mm continuum ALMA images (Scoville et al., 2017). Again we matched the western nuclei. We notice that the positions of western lobes in VLA 33 GHz, LOFAR 150 MHz, IRAM PdBi CO 2-1 and ALMA 2.6 mm images differ less , and therefore the use of these maps yields similar results. In all cases the deconvolved X-ray image shows a more compact emission from the W nucleus, and a more extended E nucleus with a morphology similar to that of the 33 GHz, CO 2-1 and 2.6 mm radio emissions suggesting starburst dominance in this region. On the other hand, the E X-ray nucleus lies somewhat north of the E lobe observed in the 150 MHz continuum LOFAR image. The central peak corresponds with the X4 X-ray source from Clements et al. (2002). Since the registration of radio images to the X-ray data yields similar results, in the following we will compare to VLA 33 GHz data.
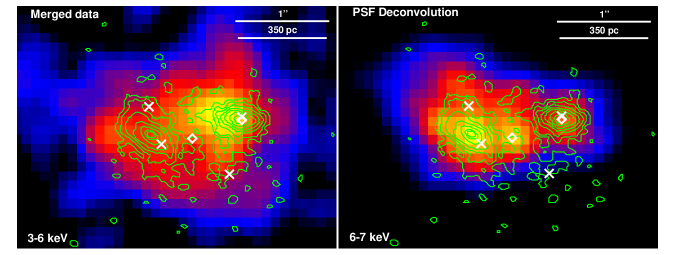
Figure 4 compares the Chandra merged images in the keV continuum with the observed 6-7 keV band selected to represent both the 6.4 keV emitted Fe K- neutral line and the 6.7 keV Fe xxv line. The 3-6 keV continuum emission centroid lies in between the peaks of the nuclear line emission (although closer to the W nucleus). The 6-7 keV peak coincide with the NIR sources reported by Clements et al. (2002), and the 5 GHz peaks. The Fe 6-7 keV image suggests a more extended E nucleus emission with respect to the W one. The X1 source reported by Clements et al. (2002) in the first 57 ks Chandra dataset coincides with the W nucleus, while the X4 source from the same study lies between the two nuclei and it is coincident with the central peak seen the PSF-deconvolved 6-7 keV image.
2.2 Spectral analysis
We attempted a spectral characterization of the emission, extracting 3-8 keV spectra from the two circular regions indicated in Figure 2. The two easternmost peaks shown in Figure 3 do not have enough counts to be studied separately (see Table 2) and we therefore selected a region that encompasses them both. Spectra were extracted with CIAO specextract task, applying a point-source aperture correction, binned to obtain a minimum of counts per bin, and fitted employing the Cash statistic.
2.3 AGN Model
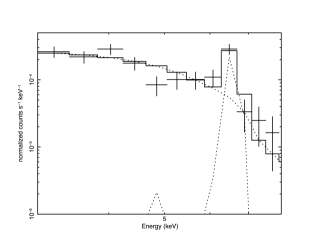
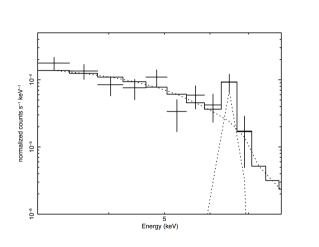
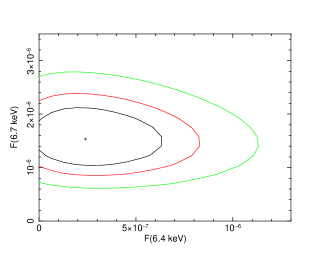
We first used a model typical of CT AGN emission (Levenson et al., 2006), comprising an absorption component fixed to the Galactic value , a power-law and red-shifted gaussian Fe-K line(s) with width fixed to 100 eV, plus possible additional Ar, S and Ca lines as reported by Iwasawa et al. (2005). We used both XSPEC (ver. 12.8.2666https://heasarc.gsfc.nasa.gov/xanadu/xspec) and Sherpa777http://cxc.harvard.edu/sherpa with identical results. The extracted spectra and the best-fit parameters are presented in Figure 5 and Table 2888In the following, errors correspond to the - confidence level for one parameter of interest., respectively. Spectra were extracted from nuclear regions shown in Figure 2, as well as in the entire central region of Arp 220 using a circular region of 4.5” radius centered at the coordinates of sources shown in Fig 2.
Due to low statistics, we first fit the power-law component excluding data from 6-7 keV energy range. We then froze the power-law spectral index so obtained and added a red-shifted gaussian Fe-K line with energy free to vary (columns 1, 4 and 7 of Table 2, model a). In order to evaluate the contribution from neutral and ionized Fe-K separately, we then froze the line rest-frame energy at 6.4 keV (columns 2, 5 and 8 of Table 2, model b), and then added a second line with rest-frame energy frozen at 6.7 keV (columns 3, 6 and 9 of Table 2, model c) in order to evaluate the relative contribution of neutral and ionized Fe lines.
In each model, given the contamination of the continuum radiation by the extended emission (suggested by the spatial distributions of continuum photons in Figure 2) and the poor statistics, our estimate of the nuclear continuum luminosity is an upper limit, and the Fe-K EWs must be considered as lower limits.
-
Model (a)
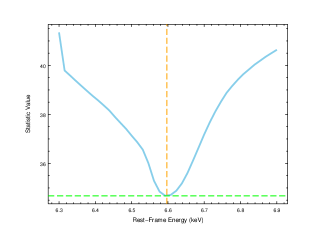
We added a single gaussian line to the power law. This leads to detections of Fe-K line features in both regions, with comparable EW (1.2 keV and 1.8 keV in W and E region, respectively). As expected from the imaging, the Fe-K line is more luminous in the E nucleus () with respect to the W (). As already discussed, the observed 2-10 keV luminosities, (E) and (W), should be considered as upper limits because of contamination. Given the rest-frame line energies, ( and keV in E and W regions, respectively) Fe xxv appears to be dominant in the Fe-K range, with fluxes of and in E and W regions, respectively. In Figure 6 we show the value of the fit statistic as a function of the rest-frame line energy.
We compare our results with those of LaMassa et al. (2011), who extracted a spectrum of the entire central region of Arp 220 using the archival Chandra-ACIS observation (OBSID 00869). Using a circular 4.5” radius count extraction region we detect a line at keV with and equivalent width of keV, compatible with the XMM-Newton detection at keV (Iwasawa et al., 2005).
-
Model b)
To assess an upper limit to the neutral Fe-K contribution, we held the line rest-frame energy fixed at 6.4 keV (model b). Using a circular 4.5” radius extraction region like LaMassa et al. (2011), we confirm their results only being able to set an upper limit on the Fe-K EW. We then performed the same spectral fitting in the E and W nuclear regions. As shown in Table 2, due to the lower statistics with respect to the 4.5” region, neutral Fe-K is detected, although with lower significance with respect to Model a, with line fluxes of and for E and W nucleus, respectively.
-
Model c)
Then, we added a second line with a rest-frame energy fixed at 6.7 keV (model c) to try to evaluate the relative contribution of Fe-K and Fe xxv lines. With this model the neutral iron line is detected only in the W nucleus region with a flux accounting of the total line flux, while both in the E nuclear and in the central 4.5” region we can only put an upper limit of on the Fe-K emission.
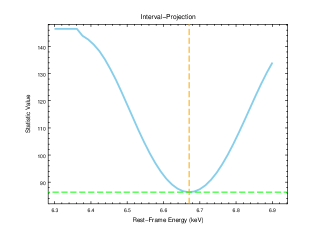
To further test the possible contribution of a neutral iron emission line to the 6-7 keV emission we see in Figure 4, we analyzed the archival XMM-Newton observations of Arp 220 discussed in Iwasawa et al. 2005. The data were reduced following a standard procedure, analogous to the one described by Iwasawa et al. (2005). The results are also in agreement: in a continuum plus single line model we obtain a best fit peak rest-frame energy . However, if we fit the data with two lines with fixed peak rest-frame energies and , we obtain the results shown in Figure 7: a neutral component accounting for up to 40% of the observed line flux cannot be ruled out at a 90% confidence level, which is compatible with the fluxes obtained with fixed 6.4 keV lines.
2.4 Thermal Model
Finally, we investigate the possibility for the Fe-K lines to arise from thermal gas emission - possibly from merged supernova (SN) ejecta and stellar winds present during a starburst. To this end we fitted the 2-8 keV spectra with a collisionally ionized plasma component APEC and an intrinsic absorption component ZWABS at the source redshift (Model d), with element abundances both fixed at solar values and free to vary, and the results are reported in Table 2. The temperatures of the gas obtained from the fits are , with column densities for the W and E regions, and in the central 4.5” region. The metallicity are found to be , and in the E, W and central 4.5” regions, respectively. We notice, in particular, that the high metallicity obtained in the eastern nucleus can be due to chemical enrichment by Type II SNe in a starburst region, producing substantial -elements but a relatively small amount of iron. The Fe metallicity in this region is very large - about four times solar - but this can be the case for a region with intense star formation (e.g., Fabbiano et al. 2004). We note, however that this model is disfavored by the large statistics shown in Table 2 indicating that, if present, the thermal gas emission is likely to be sub-dominant with respect to harder emissions, possibly of nuclear origin. The results from model d must be therefore interpreted as upper limits on thermal gas emission.
3 Discussion
Making use of deep Chandra-ACIS observation and sub-pixel binning in narrow spectral bands we have detected three sources of emission in the 6-7 keV band, with the westernmost and easternmost ones coincident with the IR (W) and radio (E) nuclei of Arp 220 (see Figure 4). The spectral analysis (Section 2.2) showed Fe-K lines with large () EWs and with the rest-frame line energies larger than 6.4 keV of the neutral Fe-K line, and compatible with 6.7 keV Fe xxv emission.
3.1 CT AGN Models
In this section we try to constrain the presence of a dual CT AGN in the Arp 220 nuclei. CT AGNs are characterized in the X rays by a hard high energy continuum, a “reflection” flat continuum in the keV range, and a high EW () keV 6.4 Fe-K line (e.g., Matt et al., 1997, 2000). Examples of this merger-driven evolution are given by the pairs of nuclei discovered in the 6.4 keV Fe-K line with Chandra in the merger infrared (IR) luminous galaxy NGC 6240 (Komossa et al., 2003).
As for NGC 6240 (Komossa et al., 2003), Arp 220 is a highly disturbed system of galaxies engaged in a major merging interaction. The physical projected separation of the CT nuclei is pc in NGC 6240 and pc in Arp 220, suggesting that the latter may be in a more advanced stage of merging.
The spectral analysis of the individual W and E nuclei, results in the detection of Fe emission lines. The rest-frame energy of the line, however, is larger than the 6.4 keV of the K line and suggests a contribution from 6.7 keV shock-ionized Fe xxv line. However, as shown in Figure 7, if we assume that both 6.4 keV and 6.7 keV lines are present in the spectrum, we obtain an acceptable fit to the XMM-Newton data which allow for 40% 6.4 keV contribution. The statistics, however, does not allow us to disentangle the 6.4 and 6.7 keV line contribution to the observed emission in Chandra data.
If we then consider that 40% of the Fe-K line flux we estimate from Chandra spectra is due to Fe-K neutral 6.4 keV emission line, the 2-10 keV emitted luminosities inferred from the Fe-K luminosities are (E) and (W). We note that these corrections are calibrated on “standard” obscured Seyfert galaxies, with an X-ray reflection efficiency of a few percent (Levenson et al., 2006). Hard X-ray observation of ULIRGs have demonstrated that on average this efficiency is much lower for these sources (Teng et al., 2009; Nardini & Risaliti, 2011). Consequently, the intrinsic X-ray luminosity of the two AGN detected here could be significantly higher. Considering the values for a standard reflection efficiency, the inferred X-ray luminosity is at least a factor of 3 higher than that expected from a pure starburst with the bolometric luminosity of Arp 220 (Ranalli et al., 2003).
The two nuclei have radio fluxes of 92.4 (E) and 114.6 (W) mJy at 4.7 GHz (Barcos-Muñoz et al., 2015), and X-ray to optical slopes . From the inferred 2-10 keV emitted luminosities of the two nuclear sources we evaluate bolometric luminosities assuming typical AGN SEDs (Elvis et al., 1994, 2002), and the X-ray reflection efficiency of Seyfert galaxies. The estimated AGN bolometric luminosities, which should be regarded as lower limits, are (E) and (W). These represent only a of Arp 220 bolometric luminosity (Sanders et al., 1988), confirming that, overall, the emission of Arp 220 is dominated by the starburst component. We note that the AGN luminosity evaluated with IR data by Veilleux et al. (2009); Nardini et al. (2010) is much higher than that inferred from our X-ray analysis, which is suggestive of heavy or nearly total obscuration. Lower limits on associated BH masses can be evaluated assuming Eddington limited accretion (with a standard 10% accretion rate to luminosity conversion efficiency), yielding (E) and (W).
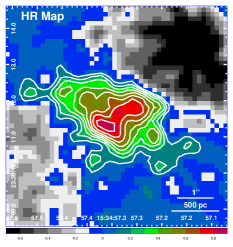
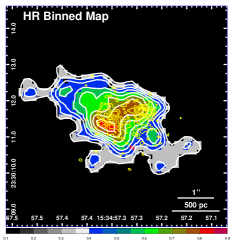
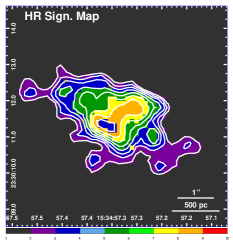
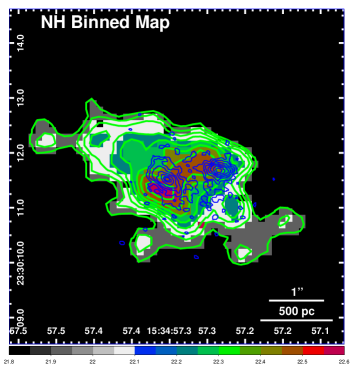
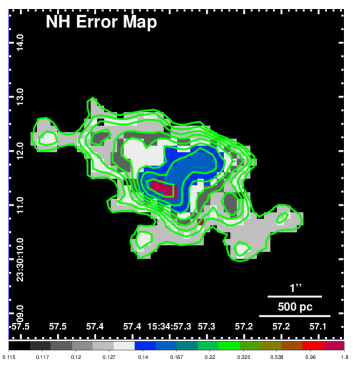
The lack of 6.4 keV emission may result from a limited visibility of the inner torus surrounding the nuclear AGNs, allowing only the emission of ionized gas to be visible (Iwasawa et al., 2005). To test this possibility we produced a hardness ratio (HR) map of the central region of this source (Figure 8, right panel). This map has been obtained from the event maps in the soft (S) 0.3-2 keV and hard (H) 2-8 keV bands with sub-pixel binning 1/4 of the native pixel size, evaluating and then applying a 3X3 pixel FWHM gaussian filter smoothing. The white contours indicate levels of HR from 0.1 to 0.8 with increments of 0.1. We then binned the event maps using these contours, producing the HR binned map presented in the central panel of Figure 8. In this panel we superimpose in yellow the 33 GHz VLA contours from Barcos-Muñoz et al. (2015) to highlight the “bridge” of that connects the two nuclei detected both in radio and X-ray (see Figure 3) and corresponding with X4 source reported by Clements et al. (2002). On the right panel of Figure 8 we present a significance map of the HR binned map, evaluated as the ratio between the uncertainty on the HR and the HR itself, showing that this “bridge” feature is significant at 8 level. We then produced simulated spectra, assuming a power-law spectrum with slope 1.8 (as appropriate for AGN emission) and, in addition to the Galactic absorption, an intrinsic absorption component at the source redshift, and evaluated the observed HR such spectra would yield. In this way we converted the binned HR map to the intrinsic absorption column map presented in the left panel of Figure 9, where the logarithmic values of are presented, with overplotted in blue the 33 GHz VLA contours. On the right panel of Figure 9 we show the map of the corresponding error on evaluated from the uncertainty on the HR. We see that in the region connecting the two nuclei we reach , similar to that obtained from the spectral fitting with model d, but about four order of magnitudes lower than the value of reported by Scoville et al. (2017) for the W nucleus, indicating again that the AGN contribution to X-ray emission represents a sub-dominant component with respect to star formation activity (see next section).
3.2 Star Formation Activity
The nuclear region of Arp 220 is site of an intense star formation with (Baan, 2007; Barcos-Muñoz et al., 2015). The X-ray expected luminosity from X-ray binaries, evaluated using the correlation between the galaxy 2-10 keV luminosity and the SFR provided by the Chandra survey of LIRGs (Lehmer et al., 2010), exceeds the observed luminosity by one order of magnitude. It is however possible, as suggested by the previous discussion, that X-ray binaries in Arp 220 are located in compact star-forming regions buried under thick absorption columns with that dims the emission in the 2-10 keV band (Lehmer et al., 2010).
As discussed before, the Fe xxv emission may be related with the thermal gas from merged SN ejecta and stellar winds present during a starburst, as exemplified by the extended Fe xxv regions of the merger-dual CT AGN NGC 6240 Wang et al. 2014). Extended Fe xxv line emission is also observed in other well-known starburst galaxies like NGC 253 and M82 (e.g., Pietsch et al. 2001; Mitsuishi et al. 2011), the merger-dual CT AGN NGC 6240 Wang et al. 2014, and the integrated spectrum of a number of LIRG/ULIRG systems (Iwasawa et al., 2009), suggesting the existence of similar high temperature plasma.
According to the starburst-driven superwind model, a hot gas bubble of internally shocked wind material with a temperature of several keV forms in the region of intense star formation (Chevalier & Clegg, 1985; Suchkov et al., 1994; Strickland & Heckman, 2007); this hot gas eventually flows outward as a high-speed (few ) wind. As a comparison, we note that the observed diffuse hard X-ray emission in Arp 220 has a luminosity one order of magnitude higher than that observed in the classic superwind system M82 (; Strickland & Heckman 2007). Following the calculation of Wang et al. (2014) we can evaluate the shock velocity (where is the mean mass per particle and is Boltzmann’s constant) from the observed gas temperature , obtaining . Such velocities are unlikely to be due to shocks induced by merging process of galaxies that collide with velocities of the order of hundreds of even in the case of direct collision systems (Braine et al., 2003), and they are as well larger than the velocity estimated from the CO line width of (Sakamoto et al., 2008; Scoville et al., 2017).
To further investigate whether the thermal energy content of the hot gas could be powered by thermalization of SNe shocks, we compare the thermal gas energy with the kinetic energy input from the SNe during the starburst. Using the Fe xxv line emission as a tracer for the extent of the hottest thermal component, and following the method of Richings et al. (2010), from the emission measure we obtain - assuming a filling factor of 1%- the hot gas masses of and for the W and E nuclei, respectively. For solar abundances this yields an iron mass of and for the W and E nuclei, respectively. From the temperatures we get from the spectral fit we obtain a thermal energy of and , for the W and E nuclei, respectively. Assuming a SN rate for Arp 220 of (Lonsdale et al., 2006) and that 10% of the kinetic energy input ( per SN) is converted into thermal energy of the hot gas (Chevalier & Clegg, 1985; Thornton et al., 1998), we obtain that the total energy deposited during the past starburst is . Anantharamaiah et al. (2000) proposed for Arp 220 a star formation model consisting of multiple starbursts of very high SFR () and short duration (). With this starburst period we obtain that the gas thermal energy is comparable with the kinetic energy input from the SNe. On the other hand, the cooling time of this thermal gas is Myr, which is far larger than the starburst duration, allowing the X-ray bright phases to survive once the starburst ceases. Note that such a short starburst can also explain the lack of X-ray point sources, that with a SFR (), would attain a luminosity (Mineo et al., 2012). We can also compare the iron yield SNe over the starburst with the iron mass evaluated from the spectral fitting of the thermal gas emission. Using an ejected iron mass per Type II SN of (Iwamoto et al., 1999), a SN of (Lonsdale et al., 2006) over a starburst of would yield of iron, more than enough to account for the iron mass of and evaluated before for the E and W nuclei, respectively. On the other hand, a continuous SFR of over a period of (Anantharamaiah et al., 2000) would yield a SNe kinetic energy input exceeding the gas thermal energy by two order of magnitudes and a cooling time about three time the starburst duration, with a yield of of iron.
These estimates demonstrate that the observed diffuse thermal gas traced by the highly ionized iron line emission in Arp 220 is consistent with being heated by SNe shocks in the starburst, although high velocity winds from hidden AGNs may also be present.
4 Conclusions
We presented an imaging and spectral analysis of the nuclear region of the ULIRG merger Arp 220 which make use of deep Chandra-ACIS observations that sum to . Narrow-band spectral imaging with sub-pixel resolution of the innermost nuclear region reveals two Fe-K emitting sources, spatially coincident with the infrared and radio emitting nuclear clusters, and separated by 1” ( pc at a distance of 80 Mpc). We estimate Fe-K equivalent width keV or possibly greater for both sources, and observed 2-10 keV luminosities (W) and (E).
In the narrow 6-7 keV band the emission from these regions is dominated by the 6.7 keV Fe xxv emission line, suggesting a contribution from collisionally ionized gas or starburst regions (see also Iwasawa et al., 2005). The nuclear regions appear to be filled with a thermal gas at keV whose energetic content can be accounted for by kinetic energy injection in the interstellar medium by Type II SNe. As NGC 6240 (Wang et al., 2014), the thermal gas surrounding the nuclei and responsible for the hard X-ray emission has a thermal energy comparable with the kinetic energy injected in the surrounding medium by Type II SNe in a short () starburst episode.
The X-ray emission from the eastern nucleus appears morphologically coincident with the disk emission as mapped by 2.6 mm continuum ALMA and CO 2-1 IRAM PdBi data, suggesting starburst dominance in this region. However, Chandra data allow us to constrain the contribution from (possibly dust-obscured) AGNs. In fact, our analysis of the XMM-Newton data confirms the presence of Fe xxv emission line but allows 40% of the narrow-band emitted flux form the neutral 6.4 keV line. Based on the Fe-K detections, we infer lower limits on the bolometric luminosity of the AGNs in Arp 220 of for the E nucleus, and for the W nucleus. These are a few percent of the total ULIRG bolometric luminosity, confirming that overall the emission of this source is dominated by the starburst component, as estimated from the mid-IR spectroscopy (Veilleux et al., 2009; Nardini et al., 2010). Our results are consistent with previous multi-wavelength indications of nuclear activity in Arp 220 (see Section 1), and strengthen the evolutionary association of merging and nuclear activity in galaxies (e.g., Hopkins et al., 2008; Van Wassenhove et al., 2012).
These results have only been possible because of the unmatched Chandra-ACIS spatial resolution coupled with the use of sub-pixel imaging in narrow spectral bands, which allow us to perform narrow-band, high resolution imaging that gives us a clear picture of the nuclear surroundings.
References
- Aalto et al. (2009) Aalto, S., Wilner, D., Spaans, M., et al. 2009, A&A, 493, 481
- Anantharamaiah et al. (2000) Anantharamaiah, K. R., Viallefond, F., Mohan, N. R., Goss, W. M., & Zhao, J. H. 2000, ApJ, 537, 613
- Baan & Haschick (1995) Baan, W. A., & Haschick, A. D. 1995, ApJ, 454, 745
- Baan (2007) Baan, W. A. 2007, IAU Symposium, 242, 437
- Batejat et al. (2012) Batejat, F., Conway, J. E., Rushton, A., et al. 2012, A&A, 542, L24
- Barcos-Muñoz et al. (2015) Barcos-Muñoz, L., Leroy, A. K., Evans, A. S., et al. 2015, ApJ, 799, 10
- Braine et al. (2003) Braine, J., Davoust, E., Zhu, M., et al. 2003, A&A, 408, L13
- Carter et al. (2003) Carter, C., Karovska, M., Jerius, D., Glotfelty, K., & Beikman, S. 2003, Astronomical Data Analysis Software and Systems XII, 295, 477
- Chevalier & Clegg (1985) Chevalier, R. A., & Clegg, A. W. 1985, Nature, 317, 44
- Clements et al. (2002) Clements, D. L., McDowell, J. C., Shaked, S., et al. 2002, ApJ, 581, 974
- Contini (2013) Contini, M. 2013, MNRAS, 429, 242
- Davis (2001) Davis, J. E. 2001, ApJ, 562, 575
- Di Matteo et al. (2005) Di Matteo, T., Springel, V., & Hernquist, L. 2005, Nature, 433, 604
- Downes & Eckart (2007) Downes, D., & Eckart, A. 2007, A&A, 468, L57
- Elvis et al. (1994) Elvis, M., Wilkes, B. J., McDowell, J. C., et al. 1994, ApJS, 95, 1
- Elvis et al. (2002) Elvis, M., Risaliti, G., & Zamorani, G. 2002, ApJ, 565, L75
- Esch et al. (2004) Esch, D. N., Connors, A., Karovska, M., & van Dyk, D. A. 2004, ApJ, 610, 1213
- Fabbiano et al. (2004) Fabbiano, G., Baldi, A., King, A. R., et al. 2004, ApJ, 605, L21
- Fruscione et al. (2006) Fruscione, A., McDowell, J. C., Allen, G. E., et al. 2006, Proc. SPIE, 6270
- Gilli et al. (2007) Gilli, R., Comastri, A., & Hasinger, G. 2007, A&A, 463, 79
- Governato et al. (1994) Governato, F., Colpi, M., & Maraschi, L. 1994, MNRAS, 271
- Harris et al. (2004) Harris, D. E., Mossman, A. E., & Walker, R. C. 2004, ApJ, 615, 161
- Hopkins et al. (2008) Hopkins, A. M., McClure-Griffiths, N. M., & Gaensler, B. M. 2008, ApJ, 682, L13
- Iwamoto et al. (1999) Iwamoto, K., Brachwitz, F., Nomoto, K., et al. 1999, ApJS, 125, 439
- Iwasawa et al. (2001) Iwasawa, K., Matt, G., Guainazzi, M., & Fabian, A. C. 2001, MNRAS, 326, 894
- Iwasawa et al. (2005) Iwasawa, K., Sanders, D. B., Evans, A. S., et al. 2005, MNRAS, 357, 565
- Iwasawa et al. (2009) Iwasawa, K., Sanders, D. B., Evans, A. S., et al. 2009, ApJ, 695, L103
- Karovska et al. (2005) Karovska, M., Schlegel, E., Hack, W., Raymond, J. C., & Wood, B. E. 2005, ApJ, 623, L137
- Karovska et al. (2007) Karovska, M., Carilli, C. L., Raymond, J. C., & Mattei, J. A. 2007, ApJ, 661, 1048
- Kim & Sanders (1998) Kim, D.-C., & Sanders, D. B. 1998, ApJS, 119, 41
- Komossa et al. (2003) Komossa, S., Burwitz, V., Hasinger, G., et al. 2003, ApJ, 582, L15
- König et al. (2012) König, S., García-Marín, M., Eckart, A., Downes, D., & Scharwächter, J. 2012, ApJ, 754, 58
- LaMassa et al. (2011) LaMassa, S. M., Heckman, T. M., Ptak, A., et al. 2011, ApJ, 729, 52
- Levenson et al. (2006) Levenson, N. A., Heckman, T. M., Krolik, J. H., Weaver, K. A., & Życki, P. T. 2006, ApJ, 648, 111
- Lehmer et al. (2010) Lehmer, B. D., Alexander, D. M., Bauer, F. E., et al. 2010, ApJ, 724, 559
- Li et al. (2003) Li, J., Kastner, J. H.,Prigozhin, G. Y., & Schulz, N. S. 2003, ApJ, 590, 586
- Lonsdale et al. (2006) Lonsdale, C. J., Diamond, P. J., Thrall, H., Smith, H. E., & Lonsdale, C. J. 2006, ApJ, 647, 185
- Magorrian et al. (1998) Magorrian, J., Tremaine, S., Richstone, D., et al. 1998, AJ, 115, 2285
- Maiolino et al. (1998) Maiolino, R., Salvati, M., Bassani, L., et al. 1998, A&A, 338, 781
- Matt et al. (1997) Matt, G., Guainazzi, M., Frontera, F., et al. 1997, A&A, 325, L13
- Matt et al. (2000) Matt, G., Fabian, A. C., Guainazzi, M., et al. 2000, MNRAS, 318, 173
- Mayer et al. (2007) Mayer, L., Kazantzidis, S., Madau, P., et al. 2007, Science, 316, 1874
- Mineo et al. (2012) Mineo, S., Gilfanov, M., & Sunyaev, R. 2012, MNRAS, 419, 2095
- Mitsuishi et al. (2011) Mitsuishi, I., Yamasaki, N. Y., & Takei, Y. 2011, ApJ, 742, L31
- Nardini et al. (2010) Nardini, E., Risaliti, G., Watabe, Y., Salvati, M., & Sani, E. 2010, MNRAS, 405, 2505
- Nardini & Risaliti (2011) Nardini, E., & Risaliti, G. 2011, MNRAS, 415, 619
- Paggi et al. (2012) Paggi, A., Wang, J., Fabbiano, G., Elvis, M., & Karovska, M. 2012, ApJ, 756, 39
- Palmeri et al. (2003) Palmeri, P., Mendoza, C., Kallman, T. R., Bautista, M. A., & Meléndez, M. 2003, A&A, 410, 359
- Perlman et al. (2010) Perlman, E. S., Padgett, C. A., Georganopoulos, M., et al. 2010, ApJ, 708, 171
- Pietsch et al. (2001) Pietsch, W., Roberts, T. P., Sako, M., et al. 2001, A&A, 365, L174
- Planck Collaboration et al. (2016) Planck Collaboration, Ade, P. A. R., Aghanim, N., et al. 2016, A&A, 594, A13
- Ranalli et al. (2003) Ranalli, P., Comastri, A., & Setti, G. 2003, A&A, 399, 39
- Rangwala et al. (2011) Rangwala, N., Maloney, P. R., Glenn, J., et al. 2011, ApJ, 743, 94
- Richings et al. (2010) Richings, A. J., Fabbiano, G., Wang, J., & Roberts, T. P. 2010, ApJ, 723, 1375
- Risaliti et al. (1999) Risaliti, G., Maiolino, R., & Salvati, M. 1999, ApJ, 522, 157
- Rots & Budavári (2011) Rots, A. H., & Budavári, T. 2011, ApJS, 192, 8
- Sakamoto et al. (2008) Sakamoto, K., Wang, J., Wiedner, M. C., et al. 2008, ApJ, 684, 957-977
- Sanders & Mirabel (1996) Sanders, D. B., & Mirabel, I. F. 1996, ARA&A, 34, 749
- Sanders et al. (1988) Sanders, D. B., Soifer, B. T., Elias, J. H., et al. 1988, ApJ, 325, 74
- Scoville et al. (1998) Scoville, N. Z., Evans, A. S., Dinshaw, N., et al. 1998, ApJ, 492, L107
- Scoville et al. (2015) Scoville, N., Sheth, K., Walter, F., et al. 2015, ApJ, 800, 70
- Scoville et al. (2017) Scoville, N., Murchikova, L., Walter, F., et al. 2017, ApJ, 836, 66
- Siemiginowska et al. (2007) Siemiginowska, A., Stawarz, Ł., Cheung, C. C., et al. 2007, ApJ, 657, 145
- Soifer et al. (1987) Soifer, B. T., Sanders, D. B., Madore, B. F., et al. 1987, ApJ, 320, 238
- Strickland & Heckman (2007) Strickland, D. K., & Heckman, T. M. 2007, ApJ, 658, 258
- Suchkov et al. (1994) Suchkov, A. A., Balsara, D. S., Heckman, T. M., & Leitherer, C. 1994, ApJ, 430, 511
- Teng et al. (2009) Teng, S. H., Veilleux, S., Anabuki, N., et al. 2009, ApJ, 691, 261
- Thornton et al. (1998) Thornton, K., Gaudlitz, M., Janka, H.-T., & Steinmetz, M. 1998, ApJ, 500, 95
- Tunnard et al. (2015) Tunnard, R., Greve, T. R., Garcia-Burillo, S., et al. 2015, ApJ, 800, 25
- Van Wassenhove et al. (2012) Van Wassenhove, S., Volonteri, M., Mayer, L., et al. 2012, ApJ, 748, L7
- Varenius et al. (2016) Varenius, E., Conway, J. E., Martí-Vidal, I., et al. 2016, A&A, 593, A86
- Veilleux et al. (2009) Veilleux, S., Rupke, D. S. N., Kim, D.-C., et al. 2009, ApJS, 182, 628-666
- Wang et al. (2011a) Wang, J., Fabbiano, G., Risaliti, G., et al. 2011a, ApJ, 729, 75
- Wang et al. (2011b) Wang, J., Fabbiano, G., Elvis, M., et al. 2011b, ApJ, 736, 62
- Wang et al. (2011c) Wang, J., Fabbiano, G., Elvis, M., et al. 2011c, ApJ, 742, 23
- Wang et al. (2014) Wang, J., Nardini, E., Fabbiano, G., et al. 2014, ApJ, 781, 55
| OBSID | DATE | EXPOSURE | PI | 0.5-8 keV COUNTS |
|---|---|---|---|---|
| (ks) | (central 5” region) | |||
| 00869 | 2000-Jun-24 | 57 | Clements | 583 |
| 16092 | 2014-Arp-30 | 170 | Fabbiano | 1390 |
| 16093 | 2014-Jun-24 | 67 | Fabbiano | 543 |
| W region | E region | Central 4.5” | ||||||||||
| Band | Net counts (error) | |||||||||||
| 3-8 keV | 75(9) | 221(15) | 659(26) | |||||||||
| 6-7 keV | 15(3) | 41(6) | 90(10) | |||||||||
| 6-6.4 keV | 6(2) | 11(3) | 25(5) | |||||||||
| 6.4-6.7 keV | 8(3) | 27(5) | 55(7) | |||||||||
| Model parameter | Best-fit value | |||||||||||
| Spectral model (Power-law + lines) | (a) | (b) | (c) | (a) | (b) | (c) | (a) | (b) | (c) | |||
| (keV, rest-frame) | ||||||||||||
| (keV) | ||||||||||||
| (keV, rest-frame) | - | - | - | - | - | - | ||||||
| - | - | - | - | - | - | |||||||
| - | - | - | - | - | - | |||||||
| (keV) | - | - | - | - | - | - | ||||||
| C-stat (d.o.f.) | 34.9(29) | 47.0(30) | 42.3(29) | 86.3(66) | 137.5(67) | 85.5(66) | 288.1(211) | 352.2(212) | 292.3(211) | |||
| Model parameter | Best-fit value | |||||||||||
| Spectral model (APEC) | (d) | (d) | (d) | |||||||||
| () | ||||||||||||
| (keV) | ||||||||||||
| EM | ||||||||||||
| Z | ||||||||||||
| C-stat (d.o.f.) | 111.6(40) | 111.5(39) | 261.6(94) | 247.9(93) | 306.8(310) | 305.7(309) | ||||||