Two-stage electron acceleration by 3D collisionless guide field magnetic reconnection
Abstract
We report a newly found two-stage mechanism of electron acceleration near X-lines of 3D collisionless guide-field magnetic reconnection in the non-relativistic regime typical, e.g., for stellar coronae. We found that after electrons are first pre-accelerated during the linear growth of reconnection, they become additionally accelerated in the course of the nonlinear stage of 3D guide-field magnetic reconnection. This additional acceleration is due to the filamentation of electric and magnetic fields caused by streaming instabilities. In addition to enhanced parallel electric fields, the filamentation leads to additional curvature-driven electron acceleration in the guide-field direction. As a result, part of the the accelerated electron spectra becomes a power law with a spectral index of near the X-line. This second stage of acceleration due to nonlinear reconnection is relevant for the production of energetic electrons in, e.g., thin current sheets of stellar coronae.
I Introduction
One of the unsolved puzzles in the Universe is the acceleration of electrons to high energies in a wide variety of astrophysical objects. They are remotely detected by the high-frequency electromagnetic radiation of, e.g., hard X-rays from the solar chromosphere during solar flares (Zharkova et al., 2011; Vilmer, 2012), or directly observed by in-situ spacecrafts measurements like by the ongoing MMS mission (Burch et al., 2016). The in-site measurements also provides the typical plasma and fields conditions at the acceleration sites (Chen et al., 2016). Common for those observations is the presence of current sheets (CSs) and magnetic reconnection through them. Reconnection can, in principle, accelerate electrons at the expense of the annihilation of magnetic flux and energy (Yamada, Kulsrud, and Ji, 2010).
Mechanisms of efficient acceleration of non-relativistic electrons by guide-field magnetic reconnection typical for, e.g., stellar coronae are, however, still not clear. They were investigated, e.g., by test particle calculations using prescribed reconnection fields usually obtained by MHD simulations (Zhou et al., 2015). Calculations using resistive MHD fields revealed effective electron acceleration mainly by magnetic-field-aligned (parallel) reconnection electric fields () both near single (Gordovskyy, Browning, and Vekstein, 2010) and multiple X-lines (Zhou et al., 2016), in stochastic CSs (Vlahos, Isliker, and Lepreti, 2004), in turbulent fields (Kowal, de Gouveia Dal Pino, and Lazarian, 2012), and also via a two-stage energization process (Dalena et al., 2014). Test particle calculations, however, do not take into account the feedback of the energized electrons to the plasma. In addition, they usually overestimate the electron acceleration since the parallel electric fields obtained by an ad-hoc assumed “anomalous” resistivity, or numerical effects (dissipation), are much larger than in collisionless astrophysical plasmas (Büchner and Elkina, 2006; Kowal, de Gouveia Dal Pino, and Lazarian, 2012). To avoid exaggerated parallel electric fields due to assumed “anomalous” resistivities, or the usually high and not well controlled numerical resistivity of MHD codes, self-consistent kinetic investigations have to be carried out. But those kinetic numerical simulations are, however, usually limited to relatively small spatial scales. Fully-kinetic PIC-code simulations of already relativistic electron-proton plasmas revealed effective electron acceleration by reconnection in 2D- (Melzani et al., 2014; Guo et al., 2016) and 3D- (Totorica, Abel, and Fiuza, 2016) configurations as well as for relativistic pair plasmas (Zenitani and Hoshino, 2001; Cerutti et al., 2014; Sironi and Spitkovsky, 2014; Guo et al., 2015). This way, power-law electron energy spectra were found in magnetically dominated relativistic plasmas, where the energy available for acceleration is orders of magnitude larger than the plasma rest energy. For non-relativistic electron-proton plasmas, however, self-consistent kinetic investigations revealed so far only a weak electron energization by the reconnection electric field near X-lines in 2D configurations, which might be enhanced by mechanisms such as surfing and parallel electric fields in the separatrices (Hoshino et al., 2001; Pritchett, 2006; Wan et al., 2008; Egedal, Daughton, and Le, 2012). In contracting magnetic islands (plasmoids) of long CSs, first order Fermi-type acceleration was detected in 2D (Drake et al., 2006; Dahlin, Drake, and Swisdak, 2014; Li et al., 2015; Dahlin, Drake, and Swisdak, 2016) and also in 3D configurations (Dahlin, Drake, and Swisdak, 2015, 2017). However, power-law energy spectra were not found. Stochastic Fermi acceleration due to the interaction of multiple magnetic islands was observed in the solar wind (Khabarova and Zank, 2017) and found in simulations of turbulent reconnecting plasmas (Hoshino, 2012; Drake, Swisdak, and Fermo, 2013). Fermi acceleration is, however, suppressed in strong guide-field (low plasma-) magnetic reconnection (Dahlin, Drake, and Swisdak, 2016; Wang et al., 2017). On the other hand, the problem of non-relativistic electron acceleration in guide field reconnection is critical to understand, e.g., the observed X-ray spectra in solar and other stellar coronae, which require electron acceleration out of a thermal distribution.
We noted, however, that all the previous research did not take into account the nonlinear evolution of 3D guide-field magnetic reconnection, which in thin current sheets causes a filamentation in the guide-field direction. In fact, we found that this filamentation in strong guide field (, larger than the asymptotic, upstream, reconnection magnetic field ) reconnection causes a so far unknown, second-stage electron acceleration, which generates power-law electron spectra at single X-lines.
II Method
We describe the nonlinear evolution of guide-field reconnection and the consequent 3D structure formation by fully-kinetic, relativistic PIC-code simulations using the code ACRONYM (Kilian, Burkart, and Spanier, 2012). To allow periodic boundary conditions in all three directions, we initialize two force-free equilibrium sheets of currents flowing in opposite directions and sufficiently separated, avoiding their interaction at short time-scales (Muñoz et al., 2015). We focus on the investigation of single X-line reconnection in one of the current sheets. For this sake, we carried out 3D kinetic simulations with various parameters. We illustrate our findings by simulations results obtained for an ion-electron mass ratio , equal electron and ion temperatures , a plasma beta , a ratio of the electron thermal speed to the speed of light of and a relative guide field strength . is the initially constant total magnetic field and the CS half-width is , where is the ion inertial length and is the ion plasma frequency. The initial ion and electron number densities are constant and equal (). All other parameters and quantities can be obtained from those, given above. Absolute values can be deduced by choosing, as usual, the electron plasma frequency or density for the plasmas of interest (solar corona, solar wind, Earth’s magnetosphere, etc).
The simulation box covers a relatively small physical domain . The numerical mesh is spanned over grid points. We intentionally choose a simulation domain short enough in the -direction in order to avoid multiple magnetic islands formation and contraction, and thus to investigate the two-stage electron acceleration process at a single X-line. The plasma is represented by 200 macro-particles per cell (PPC; 100 per specie), which corresponds to a total of particles in the simulation box. To verify the convergence of our results, we ran simulations with smaller and larger number of PPC. We found that for less than 25 PPC, numerical collisions due to the PIC shot noise start slow down the electrons numerically, causing heating instead of electron acceleration (see also May et al. (2014)). Reconnection is triggered by a 3D perturbation of the magnetic field narrowly localized in the current direction () and with a long (most unstable) tearing-Eigenmode wavelength in the -direction.
III Two-stage acceleration
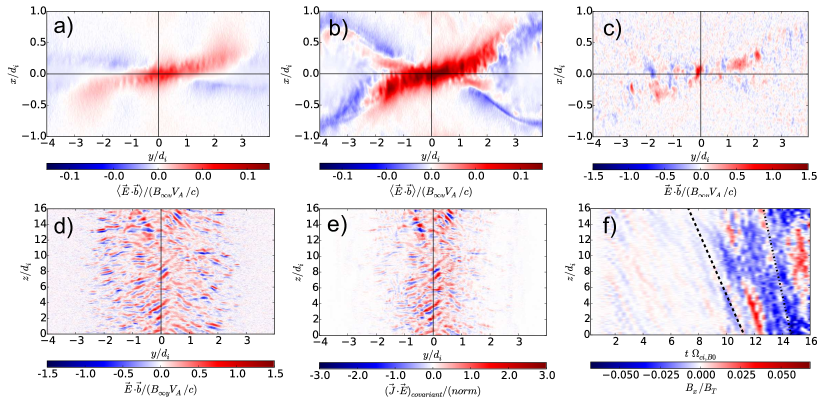
In three-dimensions a local perturbation triggers a wave of quasi-2D reconnection in the plane perpendicular to the guide field, propagating in the guide-field direction (Büchner and Kuska, 1999; Huba and Rudakov, 2002; Lapenta et al., 2006; Jain and Büchner, 2017). Figs. 1a)-b) show the resulting , the parallel electric field averaged over the direction in the plane , at two characteristic times: during the linear growth of reconnection () and in the middle of the nonlinear evolution (). As usual, all PIC-quantities are time-averaged over to remove the high-frequency PIC shot noise. Note the alignment of the average parallel electric field along the low-density separatrix (see Fig. 5), where the density and also the current density are smaller than the other separatrix due to the asymmetry introduced by the guide field.
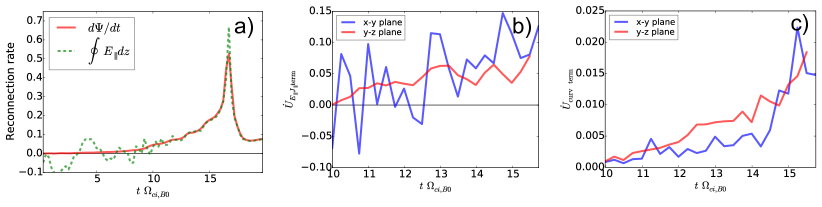
The maximum grows as the reconnection rate, becoming at and at , respectively ( and is the Alfvén speed on ). Fig. 2a) shows the reconnection rate (normalized to ), calculated both as the rate of change of magnetic flux between the X and O lines (red line) and independently calculated as a path integral of the parallel electric field in a rectangle containing the X- and O- lines (green dashed line). Before , reconnection is at its linear growth stage. still exhibits a typical 2D structure. It only mildly accelerates electrons and it does not generate power-law spectrum of energetic electrons. After , however, the reconnection rate is strongly enhanced during the nonlinear growth of reconnection as a result of the CS thinning. A peak value of the reconnection rate (above ) is reached at . It is due to the depletion of the available magnetic flux because of the periodic boundary conditions in the direction, which later let the CSs to influence each other when the magnetic island around the O-line starts to influence the the X-line region of the first CS. This saturation by technical limitations causes the reconnection to drastically reduce because the available magnetic flux is exhausted. As a result, reconnection is a non-stationary transient process, lasting as long as new flux is available, as it is typically observed by energetic particles. A longer duration or even steady-state reconnection can be reached only if more magnetic flux is provided, but that is not an issue for the short-time scale acceleration, described here.
During the nonlinear stage of reconnection, thinning CSs can develop streaming and shear-flow-driven instabilities. At their nonlinear stage, the resulting plasma waves cause a filamentation of the electromagnetic fields along the guide-field direction (see Muñoz, Büchner, and Kilian (2017) for details about the evolution of the instabilities, turbulence and structure formation). In the reconnection plane –, the filamentation of appears in patchy structures, different at each slice/plane along . For example, Fig. 1c) shows in the plane at , while Fig. 1d) shows in the plane (the CS center) also at . The signs of alternate as indicated by red/blue colors. The maximum absolute value of the parallel electric field is . This exceeds the average parallel electric field by a factor of ten. Note that similar filamentary structures were obtained before by other PIC-code simulations near X-lines (Drake et al., 2003; Che, Drake, and Swisdak, 2011; Wendel et al., 2013) and near the separatrices of reconnection (Pritchett, Mozer, and Wilber, 2012; Roytershteyn et al., 2012; Markidis et al., 2012). Meanwhile they were observed in-situ in the Earth’s magnetosphere (Khotyaintsev et al., 2010; Mozer and Pritchett, 2010; Ergun et al., 2016).
The work done by the electromagnetic field on the particles is given by . The prime (’) indicates that it is calculated in the electron frame of reference and with an extra compensating factor due to the charge separation (see Zenitani et al. (2011)). This is significant in this regime where the plasma frequency is of the same order as the electron cyclotron frequency . The quantity is also spatially filamented, as one can see in Fig.1e). Positive values () indicate local dissipation (transfer of energy from the electromagnetic fields to particle heating), while negative values () mean the opposite: a local transfer of energy from particles to the electromagnetic field. On (spatial) average, however, there is a net energy transfer from the electromagnetic fields to the particles ().
The time evolution of the filamentary structures is illustrated by Fig. 1f). The Figure shows a time series of line cuts of the magnetic field perturbation along for , the center of the X-line, stacked sequentially for each time. The dashed and dotted lines correspond to the initial (current-carrying) electron drift speed () and twice that value (), respectively. They demonstrate that the filamentary structures propagate at the instantaneous electron drift speed. The latter increases in the course of the CS thinning, reaching a speed of at . This spreading of localized reconnection was previously investigated by two-fluid investigations (Shepherd and Cassak, 2012), in experiments (Dorfman et al., 2014), in Hall-MHD (Huba and Rudakov, 2002), EMHD- (Jain and Büchner, 2017) and fully-kinetic CSs simulations (Büchner and Kuska, 1999; Lapenta et al., 2006). Reconnection spreads at the electron drift speed (, our case) or at the speed of shear Alfvén waves in the guide field (), whatever is the fastest.
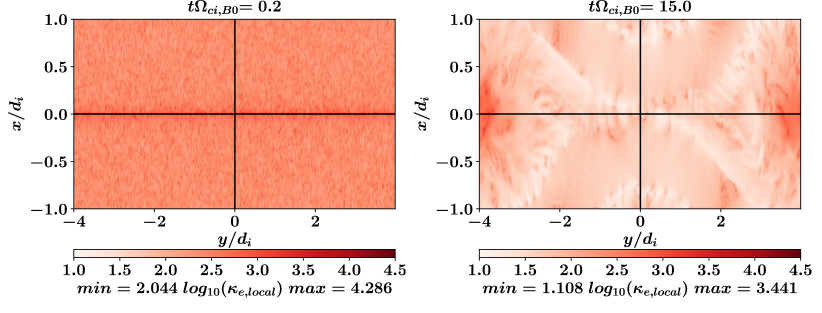
As long as the electrons are fully magnetized, their motion can be described in the guiding-center approximation. This is the case when the electron gyroradius stays smaller than the typical spatial scales of the magnetic field variation. In the guide-field reconnection case, considered here, the maximum electron gyroradius always satisfies this condition: the parameter (Büchner and Zelenyi, 1989; Büchner, Kuznetsova, and Zelenyi, 1991), defined as the ratio of the curvature radius of magnetic field lines and electron gyroradius, stays always above . A more detailed discussion about the validity of this approximation is given in Appendix C.
Changes of the electron energy can be quantified in the guiding-center approximation as (Northrop, 1963; Dahlin, Drake, and Swisdak, 2014):
| (1) | ||||
Here is the electron kinetic energy density, is the drift speed, / are the parallel/perpendicular components of the electron pressure, is the parallel electron bulk flow velocity and is the curvature of the magnetic field lines, a vector different from the aforementioned curvature parameter . The first term on the right-hand side (r.h.s.) of Eq. (1) describes the effect of parallel electric fields, the second is due to the magnetic field curvature . The third term arises due to magnetic field inhomogeneities.
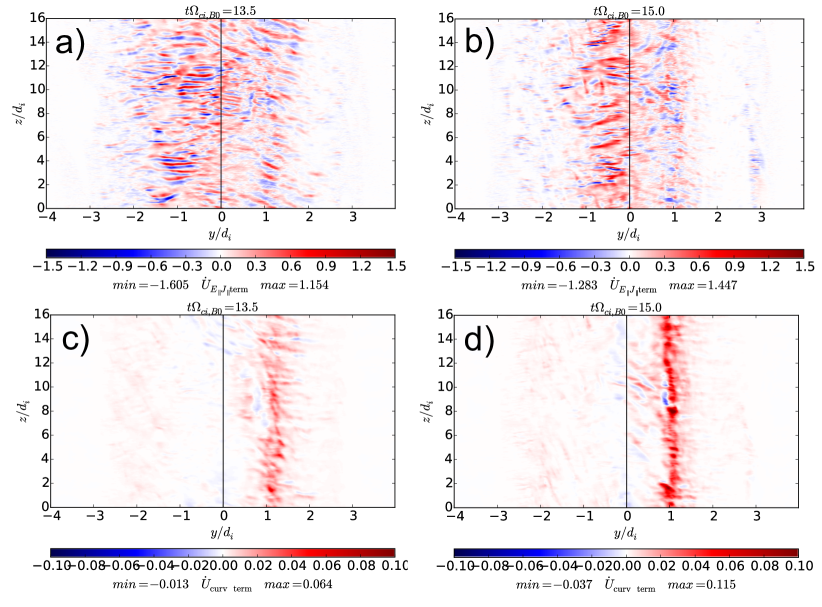
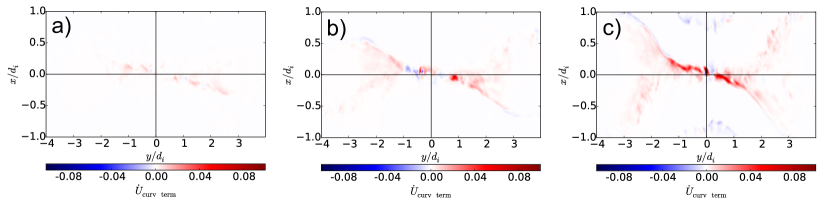
Figs. 3 shows the spatial distribution of the main contributions to the acceleration of all electrons (top and bottom rows) in a plane , slightly off the CS midplane (), at two different times. In this Figure, all the quantities are normalized to , where and . The contribution of the third term in the r.h.s. of Eq. (1) is not shown in the Figure because it is negligible, staying always an order of magnitude smaller compared to the other two terms. Panels a)-b) and c)-d) in Fig. 3 clearly show that the parallel electric field term can locally energizes electrons more efficiently than the curvature-driven acceleration. But it can also decelerate particles, while the curvature acceleration almost always energizes the electrons. The maximum normalized energy gain due to the curvature term is at , increasing up to at , reached near and always with positive values. Fig. 4 illustrates (in the – plane) that off the CS center and near the high-density separatrix, curvature-driven acceleration is stronger than at the very X-line. This is in contrast to the parallel electric field acceleration, which decreases away from the X-line and it is stronger in the low-density rather in the high-density separatrix (see Figs. 1b)-c)).
Another comparison of parallel-electric-field and curvature-driven acceleration is shown in Figs. 2b)-c). The Figures display the evolution of two averages of the main contributions to the acceleration with time. The blue line is obtained by calculating the acceleration in a rectangular region in the plane – (at a particular -slice), containing the bottom left high-density separatrix (see Fig. 4, below the CS midplane and between ). The red line in Fig. 2c) is calculated in a rectangle located in the plane – between and all along for the same -slice used in Figs. 3c)-d)). The two averages illustrate that the electrons are not accelerated homogeneously all over, but in the filamentary structures. There, the curvature-driven acceleration is the strongest, in particular in the dynamically changing region of the high-density separatrix close to the X-line (see also some typical particle trajectories in Figs. 5-6). Thus, the blue line in Fig. 2c) shows that the area in which curvature-driven energization takes place is strongly enhanced after (the average jumps by a factor of 4). The red line, on the other hand, demonstrates that the magnitude of its contribution to the energization increases steadily until , becoming enhanced by a factor of two afterwards. A similar diagnostic for the parallel acceleration is shown by the blue line in Fig. 2b). It indicates the highly oscillatory nature of the parallel acceleration in the plane –, with alternating signs before . It slightly increases later, but with maximum values of the same order as the amplitude of the oscillations around the average. The red line in Fig. 2b) shows a steady increase up to and later some oscillations around a given mean value. The mean value reaches about three times the maximum average obtained by curvature-driven acceleration. Diagnostics for other planes – or – reveal a similar behavior of curvature-driven or parallel-electric-field contributions to the electron acceleration, just at slightly different levels. This comparison indicates that the parallel electric field contribution to the electron energization is still dominant at the nonlinear stage of reconnection, but the curvature-driven acceleration starts playing an important role. It is better correlated with the localized particle acceleration in the high-density separatrix, contributing, thus, to the energization. The increase of the curvature-driven acceleration coincides with the most efficient electron acceleration after (see Figs. 5-6). On the contrary, the average of the parallel electric field contribution is not related (it is stronger at the X-line and oriented towards the low-density separatrix) and it does not change significantly at the nonlinear stage of reconnection.
Note that the nonlinear filamentation process is essential for the efficiency of the curvature-driven acceleration, the second stage of acceleration. This type of acceleration is efficient in sufficiently thin current sheets, in which thermal electrons are preaccelerated by parallel electric fields during the first stage of acceleration. In thicker CSs, reconnection stays laminar and filamentation does not take place. In them, the curvature driven-acceleration, even though it contributes to a positive net electron acceleration, is practically negligible (for details, see Appendix A). To demonstrate this, we carried out a numerical experiment using the same simulation (with the same CS thickness), but stopping the evolution of electromagnetic fields before the filamentary structures are formed (see Appendix B). This approach is equivalent to a test-particle method, without the particle feedback to the electromagnetic fields. It demonstrates that, in this way, heated distributions and beam-like structures are formed but without developing clear power-laws. Therefore, only a self-consistent consideration of the electromagnetic field feedback is necessary for the two-stage acceleration.
IV Electron trajectories and energy spectra
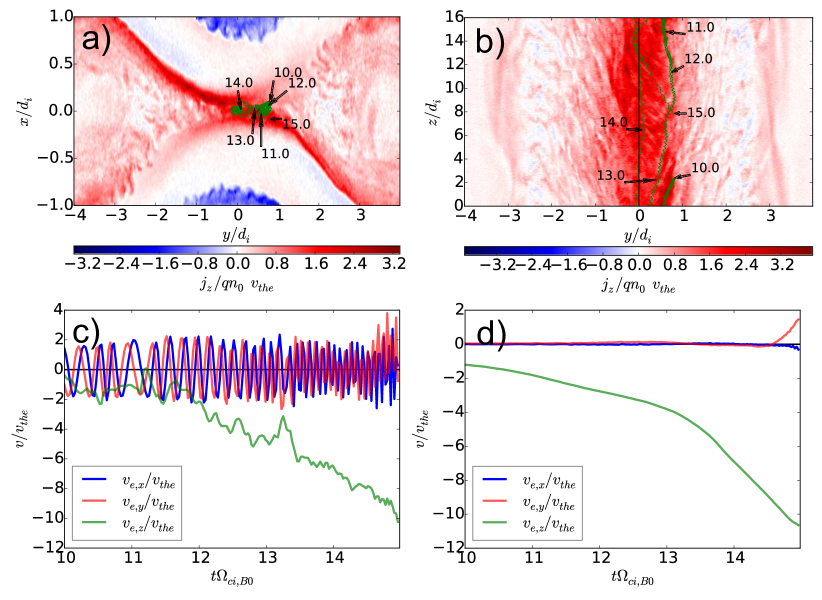
In order to demonstrate the mechanism of the two-stage acceleration, Figs. 5a)-b) depict projections of a typical trajectory of one self-consistently calculated by the PIC code strongly accelerated electron. Fig. 5c) shows the temporal evolution of its (four-)velocity components. Red and blue lines indicate gyration in the magnetic field, while the green line shows the different efficiencies of the electron acceleration during the two stages: a mild pre-acceleration until , and the second acceleration stage after the onset of the filamentation. For every individual electron the additional acceleration starts earlier or later, depending on the motion phase of the electrons at the moment in which they enter the filaments. Note that only pre-accelerated electrons can participate in the second-stage energization due to the filamentation during the nonlinear evolution of reconnection. The described two-stage acceleration mechanism is sequential: only electrons already previously accelerated can participate in the additional curvature-driven energization after the filamentary structures starts to develop during the nonlinear stage of reconnection. Fig. 5d) illustrate this by showing the time evolution of the average velocities components of the most energetic electrons diagnosed in a small domain near the X-line (depicted in Fig. 7a)) at . It shows that the strongest acceleration takes place during the nonlinear stage of guide-field reconnection, after filamentation has started (). Out of the initially non-relativistic thermal distribution, the fastest electrons now reach mildly relativistic energies: the maximum four-velocity component corresponds to a particle speed of , i.e., to a relativistic Lorentz factor of . This corresponds to an increase of the electron kinetic energy by two orders of magnitude.
The electron energization can be characterized by an effective electric field () which would cause the observed increase of the average velocity of these fastest electrons. In the pre-acceleration phase (up to , see Fig. 5d)), a linear fit of reveals . At the nonlinear stage of reconnection, however, becomes as large as . This quantity exceeds several times even the maximum value of near the X-line (about ).
Note that the periodic boundary conditions in the guide field direction , used in the simulations, do not significantly affect the acceleration of even the most energetic electrons: those with energies beyond the high energy end of the power-law part of the spectrum cross the -boundaries of the simulation domain no more than two or three times within the considered acceleration time. Most of the electrons accelerated into the power law part of the spectrum, however, do not even cross the –boundaries at all. This can be seen in Fig. 6, which shows the trajectories and velocity components of two other electrons accelerated to higher energies in a similar format to Fig. 5. The electron in the top row (Figs. 6a1-b1-c1)) approaches the X-line through the low-density separatrix (top right quadrant in the plot). It becomes efficiently accelerated in the direction only after it interacts with the fully developed filaments This provides enhanced net curvature-driven acceleration mostly along the high-density separatrix (bottom left quadrant in the plot). After , the particle escapes from the X-line towards the high-density separatrix region, converting part of the kinetic energy in the component to the and components. The electron in the bottom row of Figs. 6a2-b2-c2)) starts close enough to the X-line, approaching the low-density separatrix. It then reverses its direction toward the other high-density separatrix (top left quadrant in the plot), where it is additionally accelerated. Each jump of the velocity component corresponds to the electron entering the filaments. Note that both electrons do not cross the whole simulation box more than once during its period of maximum acceleration (up to ).
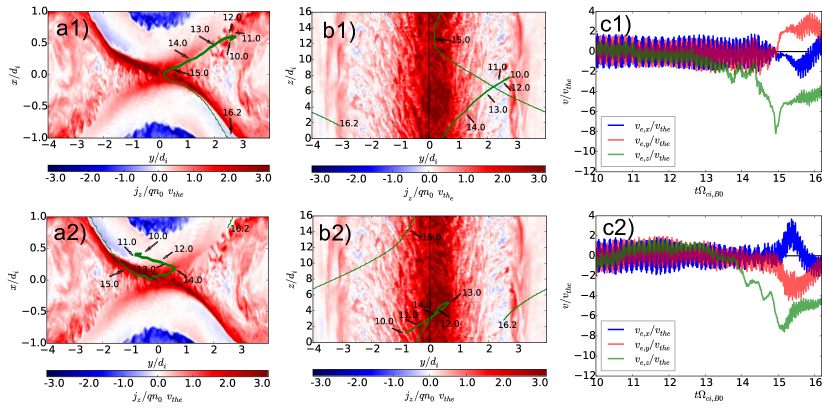
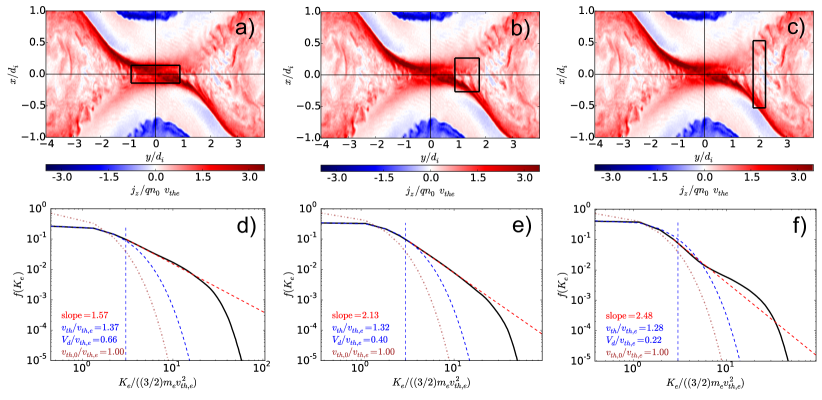
Fig. 7d) shows the electron spectrum at the saturated nonlinear stage of reconnection (), obtained for a region (box) near the X-line (displayed in Fig. 7a)) extending along , along , and the full length in (). The Maxwellian fit of the thermal part of the spectrum (blue dashed line) indicates an electron heating by up to above the initial temperature. The non-thermal tail of the electron distribution is best fitted by a power-law , with the electron kinetic energy . Simulations with more than 25 PPC reveal a stable spectral index , independent on any further increase on the number of particles per cell. The power-law part of the spectrum (red dashed line) ranges over more than an order of magnitude above the initial thermal energy. Note that there is an exponential cutoff at higher energies as predicted (solving simplified equations for the particle trajectories) and also observed in simulations of relativistic pair plasmas (Bessho and Bhattacharjee, 2012; Werner et al., 2015).
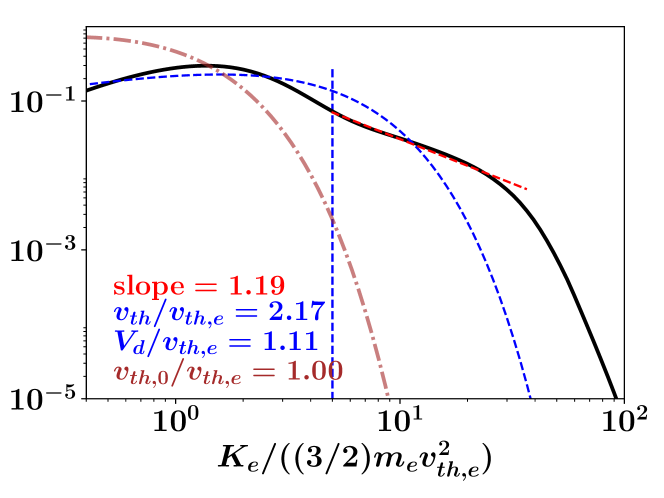
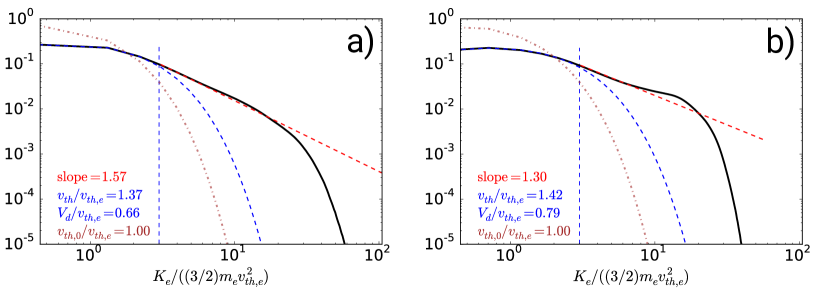
As discussed previously for Fig. 6, away from the X-line, the fast electrons are decelerated and thermalized in the exhaust regions of reconnection. In them, the local electron energy spectra becomes thermalized with the distance from the X-line, the power-laws parts become steeper (softer energy spectra). Fig. 7e) demonstrates this result by showing the spectra obtained for electrons in a region along and along displayed in Fig. 7b). The chosen box is twice as large along and half sized along compared to the box chosen in Fig. 7a), in order to not only consider approximately the same number of particles but to capture the separatrices as well. The resulting (off-center) spectrum (Fig. 7e) exhibits a steeper power-law section with an index of , indicating less energetic, already thermalized electrons. Further away from the X-line, the electron distribution is even more thermalized (Fig. 7f)), while the power-law section is very short and steeper than those observed closer to the X-line. The latter electron distribution was obtained in the region shown in Fig. 7c) for a doubled box size along and halved size along compared to the boxes used for Fig. 7b). We point out that the electron energy spectra depends on the distance from the X-line. This effect was probably overlooked in previous investigations which, due to the smaller number of particles used were not able to diagnose the dependence of the electron spectra on the distance from the X-line. Spectra as they were obtained by averaging over the whole simulation boxes do not show the formation of a significant power-law spectra. We demonstrate this by showing a spectra obtained by averaging over the whole simulation box. As one can see in Fig. 8, such averaging hides the electrons energization by the two-stage acceleration, overlaying a large number of thermal electrons decelerated and thermalized away from the X-line. There is mainly a heated component at low energies left after such averages, while for higher energies only a very short power-law is seen.
Note that the spectra shown in Fig. 8 do not allow to immediately distinguish easily which part of the spectra is due to the acceleration processes at the X-point. In particular because the mechanisms leading to a slow down of particles away from the X-line are usually exaggerated by using too small simulation domains. The periodicity along the boundaries causes the particles spending most of the time close to the boundaries. There, the counter-streaming plasma flows of the reconnection exhaust interact, creating turbulence. This slows down energetic electrons in the simulation, but not in reality. This is another reason, why averaging over the full simulation domains is not appropiate for comparison with observations. Previous simulations sometimes use extended domains mainly along the direction, in order to study Fermi acceleration in contracting magnetic islands (see, e.g., Ref. Dahlin, Drake, and Swisdak (2014)). This way only a portion of the total particle number is affected by periodicity. On the other hand, simulations with open boundary conditions along the direction can avoid that issue, but they are still uncommon.
V Conclusions and Discussion
We have shown that collisionless 3D guide-field magnetic reconnection in a non-relativistic electron-proton plasma accelerates electrons very efficiently via a two-stage mechanism even at single X-lines, and even without contracting magnetic islands as discussed, e.g., by Drake et al. (2006); Dahlin, Drake, and Swisdak (2014); Li et al. (2015); Dahlin, Drake, and Swisdak (2016, 2015, 2017). The first stage of pre-acceleration is due to the parallel electric fields rising during the linear growth phase of reconnection. It mildly pre-heats the electrons. The second stage takes place during the nonlinear phase of reconnection, which is characterized by a filamentation of the thinning current sheet. At this stage the acceleration is enhanced by curvature-driven acceleration. The electron energy spectrum is characterized by electron heating and the rise of a power-law with a spectral index of up to near the X-line. Such power-law spectra were meanwhile observed at reconnection sites by in-situ observations in the Earth’s magnetosphere (Turner et al., 2016). In the solar corona the electron spectra, deduced from hard X-ray emission of flares, also indicate such power law electron energy spectra (Holman et al., 2003; Kontar et al., 2014). While our findings do not explain the heating of the solar coronal plasma to temperatures of millions of . Instead, they show that in addition to heating thin current sheets, reconnection causes power-law electron spectra in stellar coronae and other astrophysical environments. Those electrons might further act, e.g., as seed particles required for Fermi-type acceleration processes in collisionless shocks.
Note that some features of the second acceleration stage resemble aspects of first (Fermi, 1949) and second order (Davis, 1956; Parker and Tidman, 1958) Fermi acceleration. It is, however, neither characterized by bulk plasma flows nor by a stochastic electron motion. Instead it is due to the filamentation of electromagnetic fields by reconnection in thin current sheets, with contributions of curvature-driven and parallel -field acceleration, while Fermi acceleration usually depends on elastic particles bounces (Balogh and Treumann, 2013; Pisokas et al., 2017), different from the dissipative processes present in filamented current sheets.
The extent of the power-law section of the electron spectra caused by the two-stage acceleration extends with the length of the X-line. As usual, the high energy cutoff of a power-law distribution depends on the loss mechanism. For acceleration in current sheets, this is mainly the electron escape time from the reconnection region. After the electrons escape from the X-line region, they are thermalized along the separatrices and in the exhaust regions of reconnection. While the pitch-angle scattering is weak in strong guide fields, the resulting thermalization steepens the energy spectra thermalizing the distribution with the distance from the X-line. This is the reason why electron energy spectra obtained by averaging over large domains do not reveal the power-law spectra by mixing the two-stage accelerated electrons with electrons thermalized away from the X-line.
The two-stage acceleration by reconnection is due to the filamentation of thin current sheets in a low-beta plasma, which is due to streaming and shear flow instabilities. Such streaming instabilities, in particular the Buneman instability, take place only in thin current sheets. While the relative electron-ion streaming in them is initially inversely proportional to the current sheet thickness, in the course of the nonlinear evolution of reconnection, the relative streaming starts to significantly exceed the electron thermal speed for the relatively cold electrons in a low beta-plasma.
Previous 3D PIC simulation studies of current sheet filamentation, did not analyze the resulting electron acceleration (e.g., Che, Drake, and Swisdak (2011)). Other simulations of similar filamentations reported strong electric fields in the separatrices (see, e.g., Pritchett (2013)). However, there the two-stage acceleration does not properly work, since the electric field is too weak or vanishes completely. Hence, the first stage of electron pre-acceleration is missing.
Other investigations of electron acceleration by reconnection usually analyze ion-skin-depth (thick) current sheets (e.g., Daughton et al. (2011); Pritchett (2013)). But these current sheets usually do not thin down to scales at which filamentation take place. We verified this point by investigating thicker current sheets (see Appendix. A) and we showed that such current sheets do not filament and do not form power-law energy spectra. We also showed that without feedback of the particles to the plasma, no filamentation and curvature energization take place (see Appendix. A).
It is well known that, although parallel -field acceleration takes place near X-lines, it is not efficient in producing power-law spectra per se. Plasmoid reconnection studies did not find filamentation along the X-lines, but direct efficient acceleration by Fermi-type acceleration in contracting magnetic islands/flux ropes (see, e.g., Dahlin, Drake, and Swisdak (2015, 2017)). A comparison of acceleration in plasmoids and the two-stage acceleration in filaments can be addressed only by studies using much larger simulation boxes. The two-stage mechanism is efficient in thin electron current sheets. This can be shown only by simulations using a sufficient scale separation of electrons and ions, with large simulation boxes in the direction of the reconnection plane and in the out-of-plane directions, which makes them computationally very expensive. In sufficiently large systems, with well-resolved thin current sheets, the two-stage acceleration process efficiently accelerates the electrons near the reconnection X-line. As soon as the electrons move towards the separatrices or into the exhaust, they become decelerated and thermalized. After entering magnetic islands, they can be accelerated by Fermi-type processes in contracting islands. As a result, most energetic electrons are found near X-lines and inside plasmoids, accelerated by different mechanisms. The relative efficiency of the two mechanisms should depend on the macroscopic plasma parameters.
Fully-kinetic PIC-codes simulate relatively small spatial domains compared to MHD-fluid treatments. Nevertheless, with the box sizes and number of particles used, we were able to fully reproduce the two-stage electron acceleration and spectrum formation by guide-field magnetic reconnection through thin current sheets. Further changes of the box size of our PIC code-simulations did not practically affect the results anymore, the described acceleration is local compared to the system size. The domain size has only an indirect influence on the acceleration since it determines the duration of the reconnection process limited by the amount of magnetic flux available. But the two-stage acceleration takes place, anyways, at short time scales. Therefore, a longer duration of the reconnection process does not change the principal conclusions about the efficiency of the two-stage electron acceleration and power-law formation, only the maximum energy obtained by the accelerated particles. In very large domains and over longer lasting reconnection processes, electrons could be further accelerated, extending the range of the power-law section of the spectrum to higher energies, but not changing the power-law index. This corresponds to the well-known results about particle acceleration also by collisionless shocks.
Further, note that PIC-code simulations results of non-relativistic phenomena are controlled by dimensionless parameter ratios rather than by the absolute values of the physical quantities (Ryutov et al., 2012). Absolute values are, therefore, of no fundamental importance but can rather be chosen to match the particular physical scenario of interest by applying the appropriate scalings.
Acknowledgements.
We acknowledge the developers of the ACRONYM code (Verein zur Förderung kinetischer Plasmasimulationen e.V.). In particular, we are most grateful to Patrick Kilian for his helpful discussions and valuable comments. We further acknowledge the Max-Planck-Princeton Center for Plasma Physics and the DFG Priority Program “Planetary Magnetism” SPP 1488 for funding. Computational resources were kindly provided by the PRACE project prj.1602-008 in the Beskow cluster at the PDC/KTH, Sweden. We also used the Hydra cluster of the Max Planck Computing and Data Facility (MPCDF, formerly known as RZG) at Garching, Germany. We also thank the referees for their comments and suggestions that allowed us to make our investigation results better verified and proven.Appendix A Influence of the current sheet thickness
In order to compare the inefficient acceleration without filamentary structure formation by magnetic reconnection, we simulated thicker current sheets that do not sufficiently thin down to trigger streaming instabilities. Let us demonstrate this by results obtained for a current sheet two times thicker than the ones in which filamentation takes place. The simulation domain is doubled along the direction, in order to keep the same relative separation between the two current sheets as in the original run. For the results see Fig. 9.
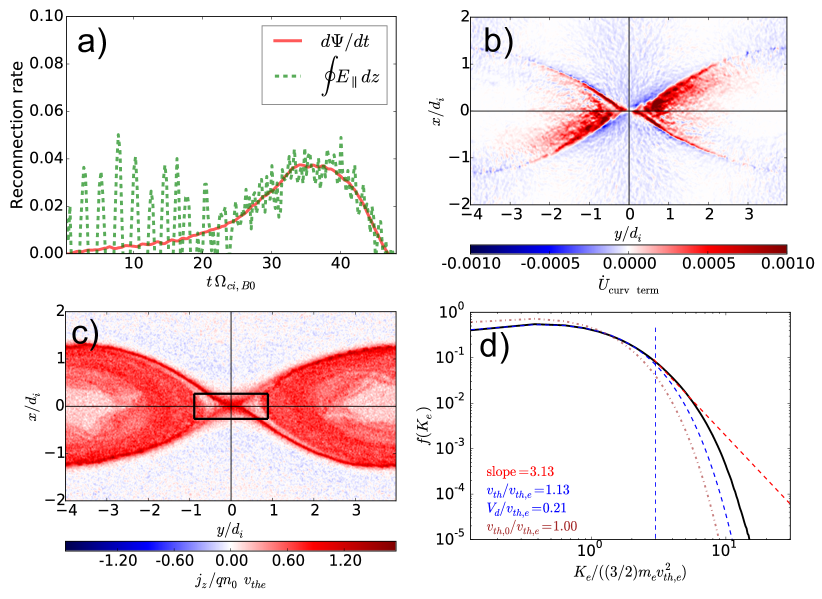
Fig. 9a) shows the normalized reconnection rate for this simulation run. The maximum values are close to , i.e., much smaller than the values over from the main simulation run reported in this paper with a thinner current sheet (Fig. 2a). Because of the lower efficiency of energy conversion, reconnection stays practically laminar (see in Fig. 9c), and the second current sheet does not grow fast enough to interact with the first one during the time period considered here. As a result, there is a longer period during which reconnection can be considered quasi-stationary (), i.e., before the magnetic flux is exhausted and reconnection stops. Thicker current sheets do not develop filamentary structures in them, streaming instabilities are not triggered. The resulting acceleration is very weak. The maximum values of the curvature acceleration (see Fig. 9b)), are, e.g., two orders of magnitude smaller than in the case of the thinner current sheet discussed in the paper (compare with Figs. 4). The resulting electron energy spectrum near the X-line stays thermal, departing only by a small amount from the initial energy spectrum (Fig. 9d). There is, therefore, no efficient acceleration near X-lines of laminar reconnection if no filamentary structures develop in the guide-field (current) direction.
Appendix B Energy spectra in static electromagnetic fields
In order to prove that without current sheet thinning and filamentation, in the absence of efficient curvature acceleration, the resulting energy spectra becomes unrealistic, we carried out another investigation. Different from the previous simulation described in Appendix A, we use the same physical parameters but switching off at the electromagnetic field solver. The particles then continue to move in static electromagnetic fields, without feedback to the plasma. This corresponds to a test particle method. We choose to stop the simulation at that time in order to avoid the filamentation and enhanced curvature energization during the nonlinear stage of reconnection (). We let the particles evolve until .
Following the same procedure as in Fig. 7d), the energy spectra are calculated in a region close to the X-point. Fig. 10 compares the results of this test run with the one shown before. Fig. 10b) shows the following differences: first, a heating at lower energies, followed by a “bump” at higher energies, while the electron energy spectra drops very steeply instead of developing a power law. The electrons attain less energy compared to the correct self-consistent consideration of the feedback. The “bump” indicates a lack of particle feedback, as is commonly seen in test particles simulations of magnetic reconnection (Kowal, de Gouveia Dal Pino, and Lazarian, 2012; Ripperda et al., 2017; Zhou et al., 2018). It is an indication of bulk acceleration of a large number of particles to a certain energy by parallel electric fields. This forms a beam drifting at a continuously increasing unlimited speed due to the lack of feedback due to plasma instabilities. The result is an artificial beam acceleration, without the formation of power-laws.
Hence, if the curvature acceleration is artificially suppressed, no significant power law is formed. Instead, only heating takes place and run-away beam formation by parallel electric fields. Due to the lack of feedback of the particles to the electromagnetic fields, the drift speed of the beam is continuously increasing. Curvature-type acceleration is, therefore, an essential element for the formation of power-laws in a two-stage acceleration process.
Appendix C Validity of the guiding center approximation
The guiding center approximation is only valid when the particles are fully adiabatic (fully magnetized). These conditions were discussed by, e.g., Northrop (1963). In case of a low-plasma- (due to the large guide field) the electron thermal gyro-radius in the total magnetic field, , can be much smaller than the typical scales of the plasma and magnetic field variation (between and ). In our case thin current sheet with , we initially have . The electron gyroradius in the total magnetic field is just resolved by the grid cell size. Hence, no structures are formed at scales smaller than that length in our investigations.
The adiabaticity condition is fulfilled all the way in the course of electron acceleration since their thermal gyroradii increase only by small amounts. Let us demonstrate this by means of the calculation of the parameter, introduced in Büchner and Zelenyi (1989) for antiparallel reconnection and generalized in Büchner, Kuznetsova, and Zelenyi (1991); Büchner and Zelenyi (1991) for guide-field reconnection geometries:
| (2) |
where is the maximum gyro-frequency in the minimum magnetic field strength region, the curvature radius of the magnetic field lines, is the unit vector in the direction of the local magnetic field, is the electron Larmor radius in the total local magnetic field , and is the trace of the temperature tensor. The minimum is taken along the magnetic fields lines. corresponds to meandering orbits, while to weakly magnetized but chaotic electrons. Finally indicates fully magnetized electrons. We measured a global minimum from, initially , to at (see Fig. 11). This is much larger than the value of indicating fully-magnetized electrons. Note that two contradicting tendencies influence during the current sheet evolution: the formation of small scale structures decreases the magnetic field curvature (small ), while the electron gyroradius increases due to the electron heating. The first effect dominates, resulting in an overall decrease of . Its minimum value decreases over one order of magnitude during the current sheet evolution.
Those are the values calculated for thermal particles. For energetic particles, mainly the parallel velocity is enhanced, while the perpendicular velocity components do not vary significantly (see, e.g., Fig. 5c). Therefore, their gyroradii do not change significantly as well until pitch angle scattering takes place, which is weak in the strong guide field limit.
These large values of indicate the remaining magnetization of the electrons (adiabaticity) and the validity of the guiding-center approximation throughout the acceleration process.
References
- Zharkova et al. (2011) V. V. Zharkova, K. Arzner, A. O. Benz, P. Browning, C. Dauphin, A. G. Emslie, L. Fletcher, E. P. Kontar, G. Mann, M. Onofri, V. Petrosian, R. Turkmani, N. Vilmer, and L. Vlahos, “Recent Advances in Understanding Particle Acceleration Processes in Solar Flares,” Space Sci. Rev. 159, 357–420 (2011), arXiv:1110.2359 .
- Vilmer (2012) N. Vilmer, “Solar flares and energetic particles,” Philos. Trans. R. Soc. A Math. Phys. Eng. Sci. 370, 3241–3268 (2012).
- Burch et al. (2016) J. L. Burch, R. B. Torbert, T. D. Phan, and {et. al.}, “Electron-scale measurements of magnetic reconnection in space,” Science (80-. ). 352, aaf2939 (2016).
- Chen et al. (2016) L.-J. Chen, M. Hesse, S. Wang, D. Gershman, R. Ergun, C. Pollock, R. Torbert, N. Bessho, W. Daughton, J. Dorelli, B. Giles, R. Strangeway, C. Russell, Y. Khotyaintsev, J. Burch, T. Moore, B. Lavraud, T. Phan, and L. Avanov, “Electron energization and mixing observed by MMS in the vicinity of an electron diffusion region during magnetopause reconnection,” Geophys. Res. Lett. 43, 6036–6043 (2016).
- Yamada, Kulsrud, and Ji (2010) M. Yamada, R. M. Kulsrud, and H. Ji, “Magnetic reconnection,” Rev. Mod. Phys. 82, 603–664 (2010).
- Zhou et al. (2015) X. Zhou, J. Büchner, M. Bárta, W. Gan, and S. Liu, “Electron Acceleration By Cascading Reconnection In The Solar Corona. I. Magnetic Gradient And Curvature Drift Effects,” Astrophys. J. 815, 6 (2015), arXiv:1504.06486v1 .
- Gordovskyy, Browning, and Vekstein (2010) M. Gordovskyy, P. K. Browning, and G. E. Vekstein, “Particle acceleration in a transient magnetic reconnection event,” Astron. Astrophys. 519, A21 (2010).
- Zhou et al. (2016) X. Zhou, J. Büchner, M. Bárta, W. Gan, and S. Liu, “Electron Acceleration By Cascading Reconnection in the Solar Corona. Ii. Resistive Electric Field Effects,” Astrophys. J. 827, 94 (2016).
- Vlahos, Isliker, and Lepreti (2004) L. Vlahos, H. Isliker, and F. Lepreti, “Particle Acceleration in an Evolving Network of Unstable Current Sheets,” Astrophys. J. 608, 540–553 (2004), arXiv:0402645 [astro-ph] .
- Kowal, de Gouveia Dal Pino, and Lazarian (2012) G. Kowal, E. M. de Gouveia Dal Pino, and A. Lazarian, “Particle Acceleration in Turbulence and Weakly Stochastic Reconnection,” Phys. Rev. Lett. 108, 241102 (2012), arXiv:1202.5256 .
- Dalena et al. (2014) S. Dalena, A. F. Rappazzo, P. Dmitruk, A. Greco, and W. H. Matthaeus, “Test-Particle Acceleration in a Hierarchical Three-Dimensional Turbulence Model,” Astrophys. J. 783, 143 (2014).
- Büchner and Elkina (2006) J. Büchner and N. Elkina, “Anomalous resistivity of current-driven isothermal plasmas due to phase space structuring,” Phys. Plasmas 13, 082304 (2006).
- Melzani et al. (2014) M. Melzani, R. Walder, D. Folini, C. Winisdoer, and J. M. Favre, “The energetics of relativistic magnetic reconnection : ion-electron repartition and particle distribution hardness,” Astron. Astrophys. 570, A112 (2014), arXiv:1405.2938v1 .
- Guo et al. (2016) F. Guo, X. Li, H. Li, W. Daughton, B. Zhang, N. Lloyd-Ronning, Y.-H. Liu, H. Zhang, and W. Deng, “Efficient Production of High-Energy Nonthermal Particles During Magnetic Reconnection in a Magnetically Dominated Ion–Electron Plasma,” Astrophys. J. 818, L9 (2016).
- Totorica, Abel, and Fiuza (2016) S. R. Totorica, T. Abel, and F. Fiuza, “Non-Thermal Electron Energization from Magnetic Reconnection in Laser-Driven Plasmas,” Phys. Rev. Lett. 116, 095003 (2016), arXiv:1601.05845 .
- Zenitani and Hoshino (2001) S. Zenitani and M. Hoshino, “The Generation of Nonthermal Particles in the Relativistic Magnetic Reconnection of Pair Plasmas,” Astrophys. J. 562, L63–L66 (2001).
- Cerutti et al. (2014) B. Cerutti, G. R. Werner, D. A. Uzdensky, and M. C. Begelman, “Three-Dimensional Relativistic Pair Plasma Reconnection With Radiative Feedback in the Crab Nebula,” Astrophys. J. 782, 104 (2014), arXiv:1311.2605 .
- Sironi and Spitkovsky (2014) L. Sironi and A. Spitkovsky, “Relativistic reconnection: an efficient source of non-thermal particles,” Astrophys. J. 783, L21 (2014), arXiv:1401.5471 .
- Guo et al. (2015) F. Guo, Y.-H. Liu, W. Daughton, and H. Li, “Particle Acceleration and Plasma Dynamics During Magnetic Reconnection in the Magnetically Dominated Regime,” Astrophys. J. 806, 167 (2015).
- Hoshino et al. (2001) M. Hoshino, T. Mukai, T. Terasawa, and I. Shinohara, “Suprathermal electron acceleration in magnetic reconnection,” J. Geophys. Res. Sp. Phys. 106, 25979–25997 (2001).
- Pritchett (2006) P. L. Pritchett, “Relativistic electron production during guide field magnetic reconnection,” J. Geophys. Res. 111, A10212 (2006).
- Wan et al. (2008) W. Wan, G. Lapenta, G. L. Delzanno, and J. Egedal, “Electron acceleration during guide field magnetic reconnection,” Phys. Plasmas 15, 032903 (2008).
- Egedal, Daughton, and Le (2012) J. Egedal, W. Daughton, and A. Le, “Large-scale electron acceleration by parallel electric fields during magnetic reconnection,” Nat. Phys. 8, 321–324 (2012).
- Drake et al. (2006) J. F. Drake, M. Swisdak, H. Che, and M. A. Shay, “Electron acceleration from contracting magnetic islands during reconnection,” Nature 443, 553–556 (2006).
- Dahlin, Drake, and Swisdak (2014) J. T. Dahlin, J. F. Drake, and M. Swisdak, “The Mechanisms of Electron Heating and Acceleration during Magnetic Reconnection,” Phys. Plasmas 21, 092304 (2014), arXiv:1406.0831 .
- Li et al. (2015) X. Li, F. Guo, H. Li, and G. Li, “Nonthermally Dominated Electron Acceleration During Magnetic Reconnection in a Low-beta Plasma,” Astrophys. J. 811, L24 (2015), arXiv:arXiv:1505.02166v1 .
- Dahlin, Drake, and Swisdak (2016) J. T. Dahlin, J. F. Drake, and M. Swisdak, “Parallel electric fields are inefficient drivers of energetic electrons in magnetic reconnection,” Phys. Plasmas 23, 120704 (2016), arXiv:1607.03857 .
- Dahlin, Drake, and Swisdak (2015) J. T. Dahlin, J. F. Drake, and M. Swisdak, “Electron acceleration in three-dimensional magnetic reconnection with a guide field,” Phys. Plasmas 22, 100704 (2015), arXiv:1503.02218 .
- Dahlin, Drake, and Swisdak (2017) J. T. Dahlin, J. F. Drake, and M. Swisdak, “The role of three-dimensional transport in driving enhanced electron acceleration during magnetic reconnection,” Phys. Plasmas 24, 092110 (2017), arXiv:1706.00481 .
- Khabarova and Zank (2017) O. V. Khabarova and G. P. Zank, “Energetic Particles of keV-MeV Energies Observed near Reconnecting Current Sheets at 1 au,” Astrophys. J. 843, 4 (2017).
- Hoshino (2012) M. Hoshino, “Stochastic Particle Acceleration in Multiple Magnetic Islands during Reconnection,” Phys. Rev. Lett. 108, 135003 (2012), arXiv:1201.0837 .
- Drake, Swisdak, and Fermo (2013) J. F. Drake, M. Swisdak, and R. Fermo, “The Power-Law Spectra of Energetic Particles During Multi-Island Magnetic Reconnection,” Astrophys. J. 763, L5 (2013).
- Wang et al. (2017) H. Wang, Q. Lu, C. Huang, and S. Wang, “Electron acceleration in a secondary magnetic island formed during magnetic reconnection with a guide field,” Phys. Plasmas 24, 052113 (2017).
- Kilian, Burkart, and Spanier (2012) P. Kilian, T. Burkart, and F. Spanier, “The Influence of the Mass Ratio on Particle Acceleration by the Filamentation Instability,” in High Perform. Comput. Sci. Eng. ’11, edited by W. E. Nagel, D. B. Kröner, and M. M. Resch (Springer Berlin Heidelberg, Berlin, Heidelberg, 2012) pp. 5–13.
- Muñoz et al. (2015) P. A. Muñoz, D. Told, P. Kilian, J. Büchner, and F. Jenko, “Gyrokinetic and kinetic particle-in-cell simulations of guide-field reconnection. I. Macroscopic effects of the electron flows,” Phys. Plasmas 22, 082110 (2015), arXiv:1504.01351 .
- May et al. (2014) J. May, J. Tonge, I. Ellis, W. B. Mori, F. Fiuza, R. A. Fonseca, L. O. Silva, and C. Ren, “Enhanced stopping of macro-particles in particle-in-cell simulations,” Phys. Plasmas 21, 052703 (2014), arXiv:1401.1198 .
- Büchner and Kuska (1999) J. Büchner and J. Kuska, “Sausage mode instability of thin current sheets as a cause of magnetospheric substorms,” Ann. Geophys. 17, 604–612 (1999).
- Huba and Rudakov (2002) J. D. Huba and L. I. Rudakov, “Three-dimensional Hall magnetic reconnection,” Phys. Plasmas 9, 4435 (2002).
- Lapenta et al. (2006) G. Lapenta, D. Krauss-Varban, H. Karimabadi, J. D. Huba, L. I. Rudakov, and P. Ricci, “Kinetic simulations of x-line expansion in 3D reconnection,” Geophys. Res. Lett. 33, L10102 (2006).
- Jain and Büchner (2017) N. Jain and J. Büchner, “Spreading of electron scale magnetic reconnection with a wave number dependent speed due to the propagation of dispersive waves,” Phys. Plasmas 24, 082304 (2017).
- Muñoz, Büchner, and Kilian (2017) P. A. Muñoz, J. Büchner, and P. Kilian, “Turbulent transport in 2D collisionless guide field reconnection,” Phys. Plasmas 24, 022104 (2017), arXiv:1610.04565 .
- Drake et al. (2003) J. F. Drake, M. Swisdak, C. Cattell, M. A. Shay, B. N. Rogers, and A. Zeiler, “Formation of Electron Holes and Particle Energization During Magnetic Reconnection,” Science (80-. ). 299, 873–877 (2003).
- Che, Drake, and Swisdak (2011) H. Che, J. F. Drake, and M. Swisdak, “A current filamentation mechanism for breaking magnetic field lines during reconnection,” Nature 474, 184–187 (2011).
- Wendel et al. (2013) D. E. Wendel, D. K. Olson, M. Hesse, N. Aunai, M. Kuznetsova, H. Karimabadi, W. Daughton, and M. L. Adrian, “The relation between reconnected flux, the parallel electric field, and the reconnection rate in a three-dimensional kinetic simulation of magnetic reconnection,” Phys. Plasmas 20, 122105 (2013).
- Pritchett, Mozer, and Wilber (2012) P. L. Pritchett, F. S. Mozer, and M. Wilber, “Intense perpendicular electric fields associated with three-dimensional magnetic reconnection at the subsolar magnetopause,” J. Geophys. Res. 117, A06212 (2012).
- Roytershteyn et al. (2012) V. Roytershteyn, W. Daughton, H. Karimabadi, and F. S. Mozer, “Influence of the Lower-Hybrid Drift Instability on Magnetic Reconnection in Asymmetric Configurations,” Phys. Rev. Lett. 108, 185001 (2012).
- Markidis et al. (2012) S. Markidis, G. Lapenta, A. Divin, M. Goldman, D. Newman, and L. Andersson, “Three dimensional density cavities in guide field collisionless magnetic reconnection,” Phys. Plasmas 19, 032119 (2012).
- Khotyaintsev et al. (2010) Y. V. Khotyaintsev, A. Vaivads, M. André, M. Fujimoto, A. Retinò, and C. J. Owen, “Observations of Slow Electron Holes at a Magnetic Reconnection Site,” Phys. Rev. Lett. 105, 165002 (2010).
- Mozer and Pritchett (2010) F. S. Mozer and P. L. Pritchett, “Spatial, temporal, and amplitude characteristics of parallel electric fields associated with subsolar magnetic field reconnection,” J. Geophys. Res. Sp. Phys. 115, A04220 (2010).
- Ergun et al. (2016) R. E. Ergun, J. C. Holmes, K. A. Goodrich, and {et. al.}, “Magnetospheric Multiscale observations of large-amplitude, parallel, electrostatic waves associated with magnetic reconnection at the magnetopause,” Geophys. Res. Lett. 43, 5626–5634 (2016).
- Zenitani et al. (2011) S. Zenitani, M. Hesse, A. Klimas, and M. Kuznetsova, “New Measure of the Dissipation Region in Collisionless Magnetic Reconnection,” Phys. Rev. Lett. 106, 195003 (2011), arXiv:1104.3846 .
- Shepherd and Cassak (2012) L. S. Shepherd and P. A. Cassak, “Guide field dependence of 3-D X-line spreading during collisionless magnetic reconnection,” J. Geophys. Res. Sp. Phys. 117, A10101 (2012).
- Dorfman et al. (2014) S. Dorfman, H. Ji, M. Yamada, J. Yoo, E. Lawrence, C. Myers, and T. D. Tharp, “Experimental observation of 3-D, impulsive reconnection events in a laboratory plasma,” Phys. Plasmas 21, 012109 (2014).
- Büchner and Zelenyi (1989) J. Büchner and L. M. Zelenyi, “Regular and chaotic charged particle motion in magnetotaillike field reversals: 1. Basic theory of trapped motion,” J. Geophys. Res. 94, 11821 (1989).
- Büchner, Kuznetsova, and Zelenyi (1991) J. Büchner, M. Kuznetsova, and L. M. Zelenyi, “Sheared field tearing mode instability and creation of flux ropes in the Earth magnetotail,” Geophys. Res. Lett. 18, 385–388 (1991).
- Northrop (1963) T. G. Northrop, “Adiabatic charged-particle motion,” Rev. Geophys. 1, 283 (1963).
- Bessho and Bhattacharjee (2012) N. Bessho and A. Bhattacharjee, “Fast Magnetic Reconnection and Particle Acceleration in Relativistic Low-density Electron-Positron Plasmas without Guide Field,” Astrophys. J. 750, 129 (2012).
- Werner et al. (2015) G. R. Werner, D. A. Uzdensky, B. Cerutti, K. Nalewajko, and M. C. Begelman, “The extent of power-law energy spectra in collisionless relativistic magnetic reconnection in pair plasmas,” Astrophys. J. 816, L8 (2015), arXiv:1409.8262 .
- Turner et al. (2016) D. L. Turner, J. F. Fennell, J. B. Blake, and {et. al.}, “Energy limits of electron acceleration in the plasma sheet during substorms: A case study with the Magnetospheric Multiscale (MMS) mission,” Geophys. Res. Lett. 43, 7785–7794 (2016).
- Holman et al. (2003) G. D. Holman, L. Sui, R. A. Schwartz, and A. G. Emslie, “Electron Bremsstrahlung Hard X-Ray Spectra, Electron Distributions, and Energetics in the 2002 July 23 Solar Flare,” Astrophys. J. 595, L97–L101 (2003).
- Kontar et al. (2014) E. P. Kontar, N. H. Bian, A. G. Emslie, and N. Vilmer, “Turbulent Pitch-Angle Scattering and Diffusive Transport of Hard X-Ray-Producing Electrons in Flaring Coronal Loops,” Astrophys. J. 780, 176 (2014).
- Fermi (1949) E. Fermi, “On the Origin of the Cosmic Radiation,” Phys. Rev. 75, 1169–1174 (1949).
- Davis (1956) L. Davis, “Modified Fermi Mechanism for the Acceleration of Cosmic Rays,” Phys. Rev. 101, 351–358 (1956).
- Parker and Tidman (1958) E. N. Parker and D. A. Tidman, “Suprathermal Particles,” Phys. Rev. 111, 1206–1211 (1958).
- Balogh and Treumann (2013) A. Balogh and R. A. Treumann, Physics of Collisionless Shocks (Springer New York, New York, NY, 2013).
- Pisokas et al. (2017) T. Pisokas, L. Vlahos, H. Isliker, V. Tsiolis, and A. Anastasiadis, “Stochastic Fermi Energization of Coronal Plasma during explosive magnetic energy release,” Astrophys. J. 835, 1–30 (2017), arXiv:1612.04246 .
- Pritchett (2013) P. L. Pritchett, “The influence of intense electric fields on three-dimensional asymmetric magnetic reconnection,” Phys. Plasmas 20, 061204 (2013).
- Daughton et al. (2011) W. Daughton, V. Roytershteyn, H. Karimabadi, L. Yin, B. J. Albright, B. Bergen, and K. J. Bowers, “Role of electron physics in the development of turbulent magnetic reconnection in collisionless plasmas,” Nat. Phys. 7, 539–542 (2011).
- Ryutov et al. (2012) D. D. Ryutov, N. L. Kugland, H. S. Park, C. Plechaty, B. A. Remington, and J. S. Ross, “Basic scalings for collisionless-shock experiments in a plasma without pre-imposed magnetic field,” Plasma Phys. Control. Fusion 54, 105021 (2012).
- Ripperda et al. (2017) B. Ripperda, O. Porth, C. Xia, and R. Keppens, “Reconnection and particle acceleration in interacting flux ropes I. Magnetohydrodynamics and test particles in 2.5D,” Mon. Not. R. Astron. Soc. 3298, 3279–3298 (2017), arXiv:arXiv:1611.09966v2 .
- Zhou et al. (2018) X. Zhou, J. Büchner, F. Widmer, and P. A. Muñoz, “Electron acceleration by turbulent plasmoid reconnection,” Phys. Plasmas 25, 042904 (2018).
- Büchner and Zelenyi (1991) J. Büchner and L. M. Zelenyi, “Regular and chaotic particle motion in sheared magnetic field reversals,” Adv. Sp. Res. 11, 177–182 (1991).