reception date \Acceptedacception date \Publishedpublication date
early universe — galaxies: formation — galaxies: high-redshift
SILVERRUSH. III. Deep Optical and Near-Infrared
Spectroscopy for Ly and UV-Nebular Lines of
Bright Ly Emitters at
Abstract
We present Ly and UV-nebular emission line properties of bright Ly emitters (LAEs) at with a luminosity of identified in the 21-deg2 area of the SILVERRUSH early sample developed with the Subaru Hyper Suprime-Cam (HSC) survey data. Our optical spectroscopy newly confirm 21 bright LAEs with clear Ly emission, and contribute to make a spectroscopic sample of 96 LAEs at in SILVERRUSH. From the spectroscopic sample, we select 7 remarkable LAEs as bright as Himiko and CR7 objects, and perform deep Keck/MOSFIRE and Subaru/nuMOIRCS near-infrared spectroscopy reaching the -flux limit of erg s-1 for the UV-nebular emission lines of He ii, C iv, and O iii]. Except for one tentative detection of C iv, we find no strong UV-nebular lines down to the flux limit, placing the upper limits of the rest-frame equivalent widths () of Å for C iv, He ii, and O iii] lines. Here we also investigate the VLT/X-SHOOTER spectrum of CR7 whose detection of He ii is claimed by Sobral et al. Although two individuals and the ESO-archive service carefully re-analyze the X-SHOOTER data that are used in the study of Sobral et al., no He ii signal of CR7 is detected, supportive of weak UV-nebular lines of the bright LAEs even for CR7. Spectral properties of these bright LAEs are thus clearly different from those of faint dropouts at that have strong UV-nebular lines shown in the various studies. Comparing these bright LAEs and the faint dropouts, we find anti-correlations between the UV-nebular line and UV-continuum luminosity, which are similar to those found at .
1 Introduction
Bright Ly-emitting galaxies are important objects in the studies of the early Universe and galaxy formation. The bright Ly emission with is expected to be reproduced in various physical mechanisms (e.g., [Fisher et al. (2014), Pallottini et al. (2015b)]). Very young and metal-free stars (Population III; Pop III) hosted in galaxies would emit the substantially strong Ly radiation with a narrow He ii line ( km s-1) and a Ly equivalent width (EW) enhancement. On the other hand, active galactic nuclei (AGNs) would also produce the bright Ly emission with high ionization metal lines such as N v and C iv due to the strong UV radiation from the central ionizing source. In addition, the highly-complex Ly radiative transfer in the interstellar medium (ISM) makes it difficult to understand the Ly emitting mechanism (e.g., [Neufeld (1991), Hansen & Oh (2006)]).
Ly emitters (LAEs) have been surveyed by imaging observations with dedicated narrow-band (NB) filters. During the last decades, a wide FoV of Subaru/Suprime-Cam (SCam) has allowed us to identify LAE candidates at the bright-end of Ly luminosity functions (LFs; e.g., [Taniguchi et al. (2005), Shimasaku et al. (2006), Murayama et al. (2007), Ota et al. (2008), Ouchi et al. (2008), Ouchi et al. (2010), Hu et al. (2010), Kashikawa et al. (2006), Kashikawa et al. (2011), Konno et al. (2014), Matthee et al. (2015)]). Follow-up optical spectroscopic observations have confirmed several bright LAEs at (e.g., Himiko: [Ouchi et al. (2009)]; CR7 and MASOSA: [Sobral et al. (2015)]; COLA1: [Hu et al. (2016)]; [Bagley et al. (2017)]), and at ([Mallery et al. (2012)]).
However, subsequent multi-band observations find the heterogeneity in the nature of these bright LAEs. Zabl et al. (2015) have reported no detections of He ii nor C iv from Himiko with VLT/X-SHOOTER. A deep ALMA observation reveals that Himiko has no strong C iim line and dust continuum emission (Ouchi et al., 2013). Combined with morphological properties, the bright Ly emission of Himiko is probably caused by intense star formation in a galaxy merger. On the other hand, Sobral et al. (2015) have claimed that a narrow He ii line is detected at the significance level from CR7 based on a deep VLT/X-SHOOTER near-infrared (NIR) spectroscopy. The He ii detection might suggest that CR7 host Pop III stellar populations. Recently, a number of theoretical studies interpret the strong He ii emission from CR7 (e.g., Pallottini et al. (2015a); Agarwal et al. (2016); Hartwig et al. (2016); Johnson & Dijkstra (2016); Dijkstra et al. (2016); Smidt et al. (2016); Smith et al. (2016); Visbal et al. (2016); Pacucci et al. (2017); Visbal et al. (2017)). In contrast to the claim of the He ii detection, CR7 clearly includes old stellar population found from analyses for photometric data (Bowler et al. (2016)), suggesting that this system would not be truly young. These studies indicate that the nature of bright LAEs has become a hot topic of debate.
Even in the substantial observational and theoretical efforts, the diversity of the bright LAEs has not been unveiled yet due to the small statistics. In this paper, we present the results of our optical and NIR spectroscopic observations for bright LAEs selected with data of a new wide-FoV camera, Hyper Suprime-Cam (HSC), on the Subaru Telescope. In our spectroscopic observations, we newly identify 21 bright LAEs with , which have enlarged the spectroscopic sample of bright LAEs by a factor of four.
This is the third paper in our ongoing HSC research project for Ly-emitting objects, Systematic Identification of LAEs for Visible Exploration and Reionization Research Using Subaru HSC (SILVERRUSH). In this project, we study various properties of high- LAEs, e.g., LAE clustering (Ouchi et al. (2017)), photometric properties of Ly line EW and Ly spatial extent (Shibuya et al. (2017)), spectroscopic properties of bright LAEs (this study), Ly LFs (Konno et al. (2017)), and LAE overdensity (R. Higuchi et al. in preparation). This program is one of the twin programs. Another program is the study for dropouts, Great Optically Luminous Dropout Research Using Subaru HSC (GOLDRUSH), that is detailed in Ono et al. (2017) and Harikane et al. (2017). Source catalogs for the LAEs and dropouts will be presented on our project webpage at http://cos.icrr.u-tokyo.ac.jp/rush.html.
This paper has the following structure. In Section 2, we describe the HSC data and target selections of bright LAEs for our optical and NIR spectroscopy. Section 3 presents details of the spectroscopic observations for the bright LAEs and the data reduction. In Section 4, we investigate physical properties for bright LAEs at using our statistical sample of bright LAEs. In Section 5, we discuss the implications for galaxy formation and evolution. We summarize our findings in Section 6.
2 Targets for Spectroscopy
2.1 Imaging Data
In March 2014, the Subaru telescope has started a large-area NB survey with HSC in a Subaru strategic program (SSP; Aihara et al. (2017b)). This survey will construct a sample of LAEs at , and with four NB filters of , , , and . The statistical LAE sample allows us to study the LAE evolution and physical processes of the cosmic reionization.
In this study, we use the HSC SSP S16A broadband (BB; Kawanomoto (2017)) and and data that are obtained in 2014-2016. Note that this HSC SSP S16A data is significantly larger than the first-released data in Aihara et al. (2017a).
The HSC images were reduced with the HSC pipeline, hscPipe 4.0.2 (Bosch et al. (2017)) which is a code from the Large Synoptic Survey Telescope (LSST) software pipeline (Ivezic et al. (2008); Axelrod et al. (2010); Jurić et al. (2015)). The photometric calibration is carried out with the PanSTARRS1 processing version 2 imaging survey data (Magnier et al. (2013); Schlafly et al. (2012); Tonry et al. (2012)). The details of the data reduction are provided in Aihara et al. (2017a); Bosch et al. (2017); Aihara et al. (2017a).
The () filter has a central wavelength of Å (Å) and an FWHM of 135Å (113Å), which traces the redshifted Ly emission line at (). The transmission curves and the detailed specifications of these NB filters are presented in Ouchi et al. (2017). The method of the transmission curve measurements is given by Kawanomoto (2017).
The HSC SSP S16A and data cover a total survey area of and deg2, respectively. The survey area consists of two Ultradeep (UD) fields: UD-COSMOS, and UD-SXDS, and three Deep (D) fields: D-ELAIS-N1, D-DEEP2-3, and D-COSMOS. The FWHM of the typical seeing size is . The NB limiting magnitudes for the UD and D fields are typically and mag in a -diameter aperture, respectively. The details of the HSC NB data are presented in Shibuya et al. (2017). This HSC and data provide the largest NB survey area for LAEs even before the completion of the SSP observation.
2.2 Selection of Bright LAEs
Using the HSC NB data, we select targets of bright LAE candidates with for follow-up spectroscopic observations. The details of the LAE selection are given in Shibuya et al. (2017), but we provide a brief description as follows. To identify objects with an NB magnitude excess in the HSC catalog, we apply the magnitude and color selection criteria similar to those of Ouchi et al. (2008) and Ouchi et al. (2010). To remove spurious sources such as satellite trails and cosmic rays, we perform visual inspections to multi-band HSC images of and for the objects selected in the magnitude and color selection criteria. We have also checked multi-epoch images to remove transients and asteroid-like moving objects. In total, photometric candidates of and LAEs at and are identified in the HSC- and fields, respectively. Finally, we select bright LAE candidates with an NB magnitude of mag corresponding to .
3 Spectroscopic Data
We carried out optical and NIR spectroscopic observations for the bright LAE candidates at selected with the HSC NB data. These optical and NIR observations mainly 1) make spectroscopic confirmations through Ly and 2) investigate properties of ionizing sources (e.g., the presence of metal-poor galaxies and AGN activity), respectively, for bright LAEs. Table 3.2.1 summarizes the instruments, the exposure time and line flux limits of our spectroscopic observations for each target.
In the following sections of Sections 3.1 and 3.2, we describe the details of optical and NIR spectroscopic data, respectively.
3.1 Optical Spectroscopic Data
We performed optical follow-up spectroscopy for bright LAE candidates at to detect Ly emission lines. The choice of the targets depends on the target visibility during the allocated time for individual spectroscopic observations. Basically, we selected the brightest LAE candidates as the targets in each observing run.
3.1.1 Subaru/FOCAS
We used the Faint Object Camera and Spectrograph (FOCAS; Kashikawa et al. (2002)) on the Subaru telescope to observe 16 LAE candidates. Out of the 16 objects, we observed 15 LAEs on 2016 June 21-22 and September 8 (S16A-060N and S16B-029N, PI: T. Shibuya), and one as a filler target of a FOCAS observation in 2015 December (S15B-059 in PI: S. Yuma; see Yuma et al. (2017)). These observations were made with the VPH900 grism with the O58 order-cut filter, giving spectral coverage of Å with a dispersion of Å pix-1. The -wide slit used gave a spectroscopic resolution of which is sufficient to distinguish O ii doublet lines from low- galaxy contaminants at . The observing nights were photometric, with good seeing of . The Multi-Object Spectroscopy (MOS) mode was used to align securely the slits on our high- sources. Each of the minute exposures was taken by dithering the telescope pointing along the slit by . The standard star Feige34 was taken at the beginning and end of each observed night (Massey & Gronwall, 1990).
Our FOCAS spectra were reduced in a standard manner with the IRAF111http:iraf.noao.edu package (e.g., Kashikawa et al. (2006); Shibuya et al. (2012)). First, we performed flat-fielding with flat images, corrected for the image distortion, calibrated wavelengths with sky OH lines, and rejected sources illuminated by the cosmic ray injections. Next, we subtracted the sky background. After the sky background subtraction, we stacked the two-dimensional (2D) spectra. From each 2D data, we then extracted one-dimensional (1D) spectra using an extraction width of in the spatial direction of the slits. The extraction width is determined based on the extent of targets and the seeing conditions during the observations. Similarly, these extraction widths are used for the data obtained from the other optical and NIR spectrographs (Sections 3.1 and 3.2). Finally, we carried out flux calibrations for the 1D spectra using the data of standard stars.
The slit loss of the emission line flux has automatically been corrected in the flux calibration. This is because we observe the standard stars in the observing configuration (i.e. slit-width) and sky condition that are the same as those for our main targets. Note that our high- main targets are point source-like objects whose slit loss is the same as that of the standard stars. For this reason, we do not perform data reduction procedures for the slit loss correction for our optical and NIR spectra in Sections 3.1 and 3.2.
3.1.2 Magellan/LDSS3
We also used the Low Dispersion Survey Spectrograph 3 (LDSS3) on the Magellan II (Clay) telescope in October 2016 (PI: M. Rauch) to take spectroscopy for two bright LAE candidates. The seeing was . We set the instrumental configuration to observe wavelength ranges of Å. The spatial pixel scale was pix-1, and the spectral dispersion was Å pix-1. The slit width is .
3.1.3 Magellan/IMACS
In addition to the Subaru/FOCAS and Magellan/LDSS3 observations, we use spectroscopic data obtained with the Inamori-Magellan Areal Camera & Spectrograph (IMACS; Dressler et al. (2011)) on the Magellan I Baade Telescope. The observations were conducted for high- galaxies in the SXDS field in 2007 - 2011 (PI: M. Ouchi; R. Higuchi et al in preparation). In the HSC LAE and IMACS catalog matching, we obtained optical spectra for eight bright LAEs.
3.1.4 LAE Spectroscopic Confirmations
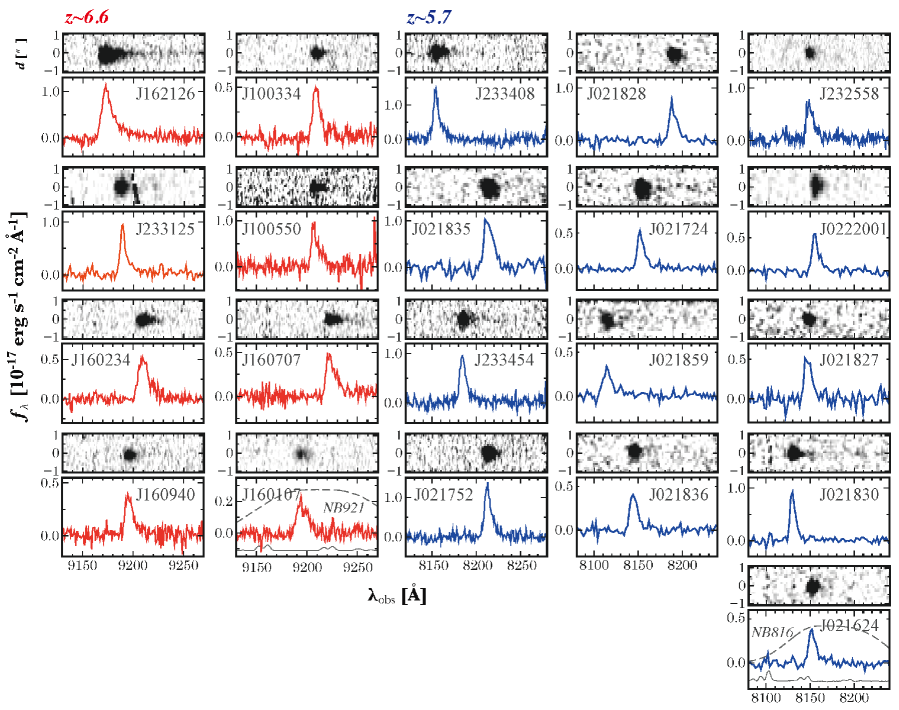
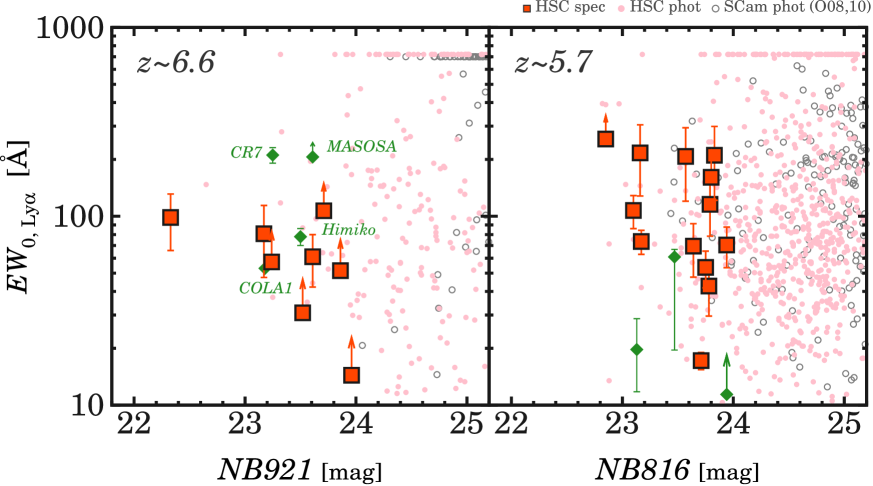
In total, we newly confirm 21 bright LAEs with a clear Ly emission line in our Subaru/FOCAS and Magellan/LDSS3 observations and our Magellan/IMACS data. The 1D and 2D optical spectra of the 21 bright LAEs are shown in Figure 1. A prominent asymmetric emission line is found at Å and Å for each LAE at and , respectively. These emission lines are detected at the significance levels. No other emission line feature is found in the range of observed wavelengths. We obtain the redshift of the bright LAEs by fitting the symmetric Gaussian profile to the observed Ly emission lines in the wavelength ranges where the flux drops to % of its peak value (Shibuya et al. (2014b)). Figure 2 shows the NB magnitude and Ly EW which is obtained in Section 4.1. As shown in Figure 2, our newly confirmed bright LAEs are as bright as e.g., Himiko and CR7.
We also check whether our LAEs selected with the HSC data, HSC LAEs, are spectroscopically confirmed in previous studies for the COSMOS and SXDS fields (Murayama et al. (2007); Taniguchi et al. (2009); Ouchi et al. (2008, 2010); Mallery et al. (2012); Sobral et al. (2015); Hu et al. (2016)). In spectroscopic samples obtained by the previous studies, we find that 7 bright LAEs with mag and 69 faint ones with mag. In total, 96 LAEs are confirmed in our spectroscopic observations and the previous studies. Table 4.1 summarizes the number of the spectroscopically confirmed HSC LAEs.
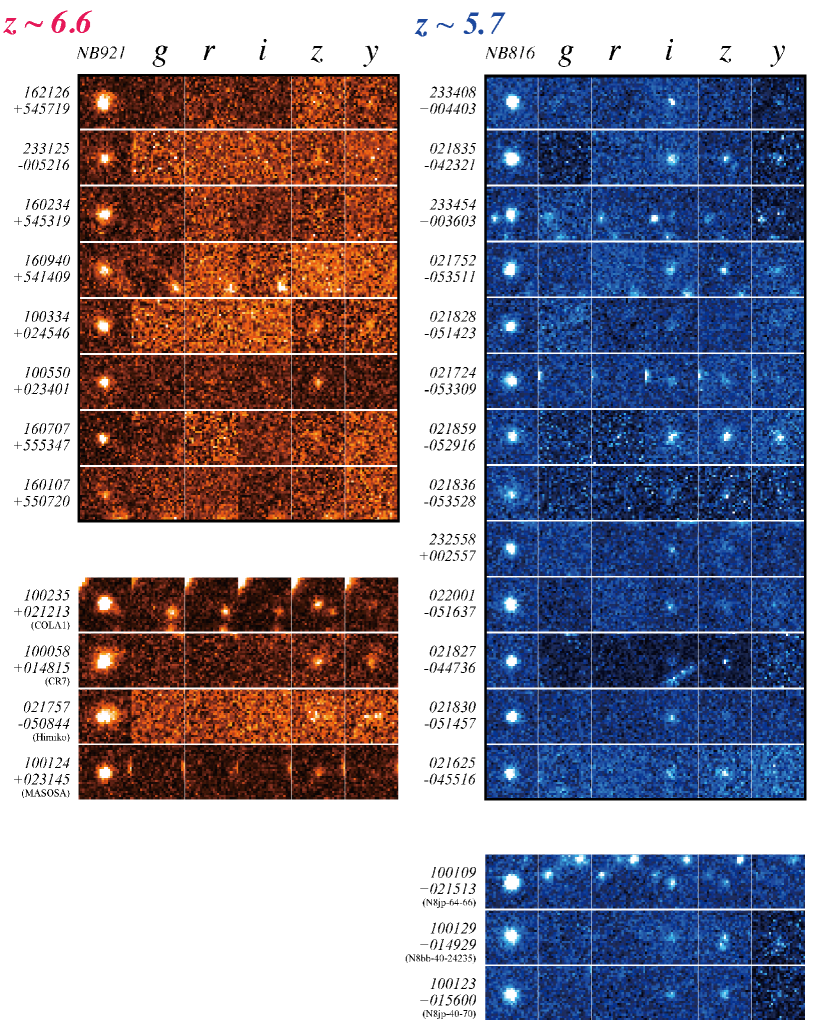
The photometric properties and the HSC images for the bright LAEs in Table 4.2 and Figure 3, respectively. Although most of the bright LAEs are not detected in blue bands of and , COLA1 is marginally detected in the -band image at .
Combining our 21 newly identified and the 7 previously confirmed bright LAEs (i.e., Himiko, CR7, MASOSA, COLA1, and three \authorcite2012ApJ…760..128M’s objects), we construct a sample of 28 bright LAEs. The HSC data and our observations have enlarged a spectroscopic sample of bright LAEs by a factor of four. The large sample allows for a statistical study on physical properties of bright LAEs with .
3.1.5 Contamination Rates in the LAE Candidates
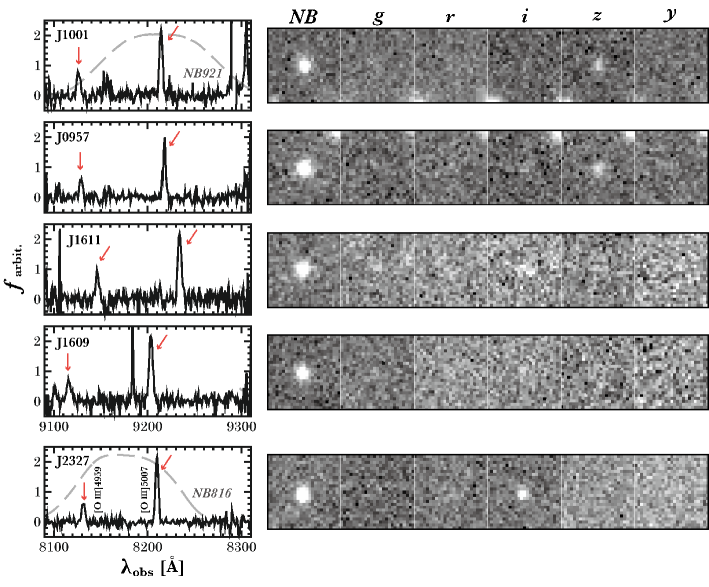
We estimate contamination rates, , in the HSC LAE candidates using the spectroscopic data. In our Subaru/FOCAS and Magellan/LDSS3 observations for 12 and 6 bright LAE candidates with mag, we identify 4 and 1 low- contaminants, respectively. Figure 4 presents the spectra and HSC cutout images for the low- contaminants. All of the 5 contaminants are strong [O iii] emitters at with faint BB magnitudes. The H and H emission lines are not significantly detected in the short integration time (i.e. minutes) of the FOCAS and LDSS3 observations. The photometric properties of these low- contaminants are listed in Table 4.2. We find that % () and % () for bright LAE candidates with mag at and , respectively.
We also calculate in the HSC LAE candidates including our Magellan/IMACS spectroscopic data (Section 3.1.3). This spectroscopic sample includes faint HSC LAE candidates with mag. Combining our Subaru/FOCAS and Magellan/LDSS3 data and the cross-matching of the Magellan/IMACS spectroscopic catalogs, we find that 28 and 53 HSC LAE candidates at and are spectroscopically observed. In total, we find that 4 out of 28 (4 out of 53) HSC LAE candidates are low- contaminants, and estimate to be % and % for the samples of and LAEs, respectively.
In these estimates with the spectroscopic data, we find that %. Table 4.1 summarizes the contamination rates. These values are used for the contamination correction for e.g., LAE clustering (Ouchi et al. (2017)), Ly LFs (Konno et al. (2017)), and LAE overdensity (R. Higuchi et al. in prep.).
3.2 NIR Spectroscopic Data
We performed deep NIR spectroscopy to investigate whether the rest-frame UV-nebular emission lines (i.e., C iv, He ii, and O iii]) exist in bright LAEs. As a first attempt, we observed seven out of the spectroscopically confirmed 21 bright LAEs. The LAEs observed by NIR spectrographs are listed in Table 3.2.1. The choice of the targets depends on the target visibility during the allocated time for individual spectroscopic observations. Basically, we have selected the brightest LAEs as the targets in each observing run.
3.2.1 Keck/MOSFIRE
We used the Multi-Object Spectrometer For Infra-red Exploration (MOSFIRE; McLean et al. (2012)) on the Keck I telescope to observe 4 LAEs on 2016 September 9 (S16B-029N, PI: T. Shibuya) and an LAE on 2015 January 3-4 as a filler target (S15B-075, PI: M. Ouchi). Similar to the Subaru/FOCAS observations, the MOS mode was utilized to align securely the slits on our high- sources. We used the Y and J band filters for LAEs at and , respectively. The seeing size was -. The -wide slit was used, giving a spectral resolution of .
The data of objects and standard stars were reduced using the MOSFIRE data reduction pipeline.222https://keck-datareductionpipelines.github.ioMosfireDRP We conducted standard reduction processes for the MOSFIRE spectra with sets of default pipeline parameters (see e.g., Kojima et al. (2016)). Using -spectral type stars which were taken in this observing run, we performed flux calibrations for the spectra of the target LAEs.
*7c
Our Optical and NIR Spectroscopic Observations for Bright LAEs
Object ID Opt. Inst. NIR. Inst.
(minutes) (erg s-1 cm-2) (minutes) (erg s-1 cm-2)
(1) (2) (3) (4) (5) (6) (7)
\endfirsthead\endhead\endfoot(1) Object ID. Sorted by the NB magnitude.
(2) Instrument for optical spectroscopy.
(3) Integration time for optical spectroscopy.
(4) The line flux sensitivity near Ly emission lines.
(5) Instrument for NIR spectroscopy.
(6) Integration time for NIR spectroscopy.
(7) Average values of the line flux sensitivity at the expected wavelengths of C iv, He ii, and O iii].
a Spectroscopically confirmed with Magellan/IMACS. See Section 3.1.3.
\endlastfootHSC J162126545719 FOCAS 60 MOSFIRE 120
HSC J233125005216 LDSS3 90 — — —
HSC J160234545319 FOCAS 60 nuMOIRCS 180
HSC J160940541409 FOCAS 60 nuMOIRCS 300
HSC J100334024546 FOCAS 100 — — —
HSC J100550023401 FOCAS 60 MOSFIRE 120
HSC J160707555347 FOCAS 60 — — —
HSC J160107550720 FOCAS 60 — — —
HSC J233408004403 FOCAS 60 MOSFIRE 120
HSC J021835042321a — — — MOSFIRE 120
HSC J233454003603 FOCAS 60 MOSFIRE 120
HSC J021752053511 FOCAS 60 — — —
HSC J232558002557 FOCAS 60 — — —
HSC J022001051637 LDSS3 45 — — —
3.2.2 Subaru/nuMOIRCS
We used the upgraded version of the Multi-Object InfraRed Camera and Spectrograph (nuMOIRCS; Ichikawa et al. (2006); Suzuki et al. (2008); Fabricius et al. (2016); Walawender et al. (2016)) on the Subaru telescope on 2016 June 21-22 to observe 2 LAEs at (S16A-060N, PI: T. Shibuya). The MOS mode was used to align securely the slits on our high- sources. There were thin sky cirrus, but the weather condition was photometric. The seeing size was -. The width of each slit in the MOS masks is . We used the VPH-J grism, giving the spectral resolution of . The standard star HIP115119 was observed on each night for flux calibrations.
We reduced the nuMOIRCS spectra with IRAF in the manner similar to the FOCAS data reduction (Section 3.1.1). We performed bias subtraction, flat fielding, image distortion correction, cosmic ray rejection, wavelength calibration, sky subtraction, and flux calibration.
4 Results
4.1 Physical Properties
We present physical quantities related to the Ly emission: Ly flux, , Ly luminosity, , and the rest-frame Ly EW, , for the bright LAEs with a spectroscopic redshift. To obtain these quantities, we scale the observed Ly spectra to match the NB and BB magnitudes. Here we assume the rest-frame UV spectral slope of . The parameter is defined by where is a galaxy spectrum at Å. The lower limits of ()-band magnitudes are used for () LAEs whose UV continuum emission is not detected. For HSC J162126545719 whose UV continuum is detected in the spectroscopic data (see Figure 1), we use the UV continuum flux density in the spectra to measure the and values. Table 4.2 presents the quantities of , , and for our 21 bright LAEs including a sample of 7 LAEs identified by previous studies (Ouchi et al. (2009); Mallery et al. (2012); Sobral et al. (2015); Hu et al. (2016)). Figure 2 shows as a function of NB magnitude. The value ranges from Å to Å.
Table 4.2 also shows whether the bright LAEs are spatially extended or not in Ly based on our measurements of isophotal areas, (see Shibuya et al. (2017)). We find that only 5 out of the 28 bright LAEs show the spatially extended Ly emission. The measurements indicate that Ly emission of the bright LAEs is typically compact.
Number of Spectroscopically Confirmed HSC LAEs at .
Sample
Spec. Obs. or Sample
(1)
(2)
(3)
Bright ()
13
FOCAS, LDSS3
Bright ()
8
IMACS
Bright ()
7
Literaturea
Faint ()b
68
LDSS3, IMACS, Literaturea
Total
96
—
{tabnote}
(1) LAE sample. (2) Number of spectroscopically confirmed LAEs. (3) Instruments for observations and spectroscopic samples.
a Murayama et al. (2007); Taniguchi et al. (2009); Ouchi et al. (2008, 2010); Mallery et al. (2012); Sobral et al. (2015); Hu et al. (2016).
b See Tables 7 and 7.
Contamination Rates in the HSC LAE Candidates
Redshift
Spec. Obs.
(1)
(2)
(3)
(4)
(5)
Bright ()
6.6
12
4
0.33
FOCASa, LDSS3a
5.7
6
1
0.17
FOCASa, LDSS3a
All
6.6
28
4
0.14
FOCASa, LDSS3ab, IMACSc
5.7
53
4
0.08
FOCASa, LDSS3a, IMACSc
{tabnote}
(1) Redshift of the LAE sample. (2) Number of spectroscopically observed HSC LAEs. (3) Number of low- contaminants. (4) Contamination rates. (5) Spectroscopic follow-up observations. Only for the observations whose and are found.
a This study.
b Y. Harikane et al. in preparation.
c R. Higuchi in preparation.
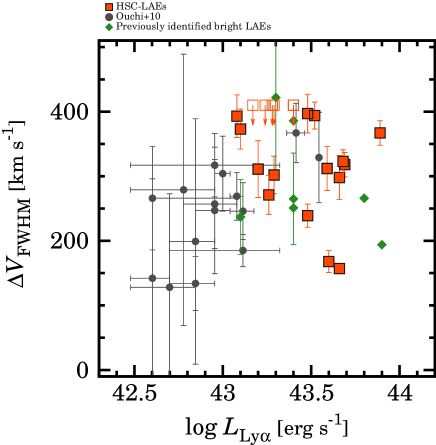
4.2 Ly Line Width
To quantify the Ly line profiles, we measure the FWHM velocity width, . We fit the symmetric Gaussian profile to the Ly emission lines, and obtain the observed FWHM velocity width, in the same manner as that in Ouchi et al. (2010) for consistency. We correct for the instrumental broadening of line profile, and obtain by , where and are FWHM velocity widths for the observed Ly lines and the instrumental resolution, respectively. We use the uncertainties in the minimization fitting as the errors. The values are listed in Table 4.2.
Figure 5 presents as a function of . We find that the bright LAEs have km s-1 similar to faint LAEs with (Ouchi et al. (2010)). The narrow Ly emission lines of km s-1 indicate that the bright LAEs are not broad-line AGNs.
To quantify the relation between and in Figure 5, we carry out Spearman rank correlation tests. In this test, we find a marginal correlation at the significance level, possibly suggesting that increases with increasing .
*8c
Photometric Properties of Bright LAEs with Spectroscopic Redshifts
Object ID NB i z y
(mag) (mag) (mag) (mag)
(1) (2) (3) (4) (5) (6) (7) (8)
\endfirsthead\endhead\endfoot(1) Object ID.
(2) Right ascension.
(3) Declination.
(4) Spectroscopic redshift of Ly emission line.
(5) Total magnitudes of and for and LAEs, respectively.
(6)-(8) Total magnitudes of i-, z-, and y-band.
(6)-(8) limiting magnitudes for undetected bands.
a Spectroscopically confirmed with Magellan/IMACS. See Section 3.1.3.
b COLA1 in Hu et al. (2016).
c CR7 in Sobral et al. (2015).
d Himiko in Ouchi et al. (2009).
e MASOSA in Sobral et al. (2015).
f Spectroscopically confirmed in Mallery et al. (2012).
\endlastfoot ()
HSC J162126545719 16:21:26.51 54:57:19.14 6.545
HSC J233125005216 23:31:25.36 00:52:16.36 6.559
HSC J160234545319 16:02:34.77 54:53:19.95 6.576
HSC J160940541409 16:09:40.25 54:14:09.04 6.564
HSC J100334024546 10:03:34.66 02:45:46.56 6.575
HSC J100550023401 10:05:50.97 02:34:01.51 6.573
HSC J160707555347 16:07:07.48 55:53:47.90 6.586
HSC J160107550720 16:01:07.45 55:07:20.63 6.563
()
HSC J233408004403 23:34:08.79 00:44:03.78 5.707
HSC J021835042321a 02:18:35.94 04:23:21.62 5.757
HSC J233454003603 23:34:54.95 00:36:03.99 5.732
HSC J021752053511 02:17:52.63 05:35:11.78 5.756
HSC J021828051423a 02:18:28.87 05:14:23.01 5.737
HSC J021724053309a 02:17:24.02 05:33:09.61 5.707
HSC J021859052916a 02:18:59.92 05:29:16.81 5.674
HSC J021836053528a 02:18:36.37 05:35:28.07 5.700
HSC J232558002557 23:25:58.43 00:25:57.53 5.703
HSC J022001051637 02:20:01.10 05:16:37.51 5.708
HSC J021827044736a 02:18:27.44 04:47:36.98 5.703
HSC J021830051457a 02:18:30.53 05:14:57.81 5.688
HSC J021624045516a 02:16:24.70 04:55:16.55 5.706
Previously identified bright LAEs
HSC J100235021213b 10:02:35.38 02:12:13.96 6.593
HSC J100058014815c 10:00:58.00 01:48:15.14 6.604
HSC J021757050844d 02:17:57.58 05:08:44.63 6.595
HSC J100124023145e 10:01:24.79 02:31:45.38 6.541
HSC J100109021513f 10:01:09.72 02:15:13.45 5.712
HSC J100129014929f 10:01:29.07 01:49:29.81 5.707
HSC J100123015600f 10:01:23.84 01:56:00.46 5.726
*10c
Low- Contamination Sources
Object ID NB g r i z y
(mag) (mag) (mag) (mag) (mag) (mag)
(1) (2) (3) (4) (5) (6) (7) (8) (9) (10)
\endfirsthead\endhead\endfoot(1) Object ID.
(2) Right ascension.
(3) Declination.
(4) Spectroscopic redshift.
(5) Total magnitudes of and for and LAEs, respectively.
(6)-(10) Total magnitudes of g-, r-, i-, z-, and y-band.
(6)-(10) limiting magnitudes for undetected bands.
\endlastfoot
HSC J10010229 10:01:44.34 02:29:09.96 23.64 26.78 25.10
HSC J09570306 09:57:16.07 03:06:30.31 23.73 25.15
HSC J16115541 16:11:30.34 55:41:00.39 23.82 26.37 25.47
HSC J16095620 16:09:18.03 56:20:50.89 23.96 25.52
HSC J23270054 23:27:48.16 00:54:20.84 23.18 25.31
*7c
Physical Properties of Bright LAEs with Spectroscopic Redshifts
Object ID Extended?a
(erg s-1 cm-2) (erg s-1) (Å) (km s-1) (mag)
(1) (2) (3) (4) (5) (6) (7)
\endfirsthead\endhead\endfoot(1) Object ID.
(2) Ly flux in units of erg s-1 cm-2.
(3) Ly luminosity.
(4) Ly EW.
(5) Velocity FWHM of the Ly emission line.
(6) Absolute UV magnitude.
(7) Flag of the Ly spatial extent.
a If the column is Y, the object is spatially extended in Ly. See Shibuya et al. (2017).
b Spectroscopically confirmed with Magellan/IMACS. See Section 3.1.3.
c Physical quantities in the columns (2)-(5) are obtained from literature.
d COLA1 in Hu et al. (2016).
e CR7 in Sobral et al. (2015).
f Himiko in Ouchi et al. (2009).
g MASOSA in Sobral et al. (2015).
h Spectroscopically confirmed in Mallery et al. (2012).
i These values are calculated from the rest-frame UV continuum emission detected in the spectroscopic data.
\endlastfoot ()
HSC J162126545719
HSC J233125005216
HSC J160234545319
HSC J160940541409 Y
HSC J100334024546
HSC J100550023401
HSC J160707555347
HSC J160107550720
()
HSC J233408004403
HSC J021835042321b
HSC J233454003603
HSC J021752053511
HSC J021828051423b
HSC J021724053309b
HSC J021859052916b
HSC J021836053528b
HSC J232558002557
HSC J022001051637
HSC J021827044736b
HSC J021830051457b
HSC J021624045516b
Previously identified bright LAEsc
HSC J100235021213d 43.9 53 194
HSC J100058014815e 43.8 211 266 Y
HSC J021757050844f 43.4 78 251 Y
HSC J100124023145g 43.4 386
HSC J100109021513h Y
HSC J100129014929h Y
HSC J100123015600h
*9c
UV Nebular Emission Lines of Bright LAEs
Object ID Flux () ( upper limits) Line flux ratio relative to Ly
(R.A.) N v C iv He ii O iii] N v C iv He ii O iii]
/Ly /Ly /Ly /Ly
( erg s-1 cm-2) (Å)
(1) (2) (3) (4) (5) (6) (7) (8) (9)
\endfirsthead\endhead\endfoot(1) Object ID.
(2)-(5) Flux and flux upper limits of the C iv, He ii, and O iii] emission lines.
The number in the parentheses is the EW and limits of the C iv, He ii, and O iii] emission lines.
(6)-(9) Line flux ratios of the UV-nebular emission lines relative to Ly.
\endlastfootJ162126
J233125 … … … … … …
J160234
J160940
J100334 … … … … … …
J100550
J160707 … … … … … …
J160107 … … … … … …
J233408
J021835
J233454
J201752 … … … … … …
J021828 … … … … … …
J021724 … … … … … …
J021859 … … … … … …
J021836 … … … … … …
J232558 … … … … … …
J022001 … … … … … …
J021827 … … … … … …
J021830 … … … … … …
J021624 … … … … … …
4.3 X-ray, Mid-IR, and Radio Detectability
We check X-ray, mid-IR (MIR), and radio data to investigate whether the bright LAEs have a signature of AGN activities. Such X-ray, MIR, and radio data are available in the UD fields, UD-COSMOS and UD-SXDS. In UD-COSMOS, an object (i.e. HSC J100334024546) is covered by MIR and radio data. In UD-SXDS, all the 10 objects are observed in X-ray, MIR, and radio. For the X-ray data, we use the XMM-Newton source catalog whose sensitivity limit is erg cm-2 s-1 (Ueda et al. (2008)). For the MIR data, we use Spitzer/MIPS source catalogs for UD-COSMOS (Sanders et al. (2007)) and UD-SXDS (the SpUDS survey, PI: J. Dunlop). These Spitzer/MIPS images reach sensitivity limits of 21.2 mag and 18.0 mag in UD-COSMOS and UD-SXDS, respectively. For the radio data, we check the Very Large Array (VLA) 1.4 GHz source catalogs of Schinnerer et al. (2007) for UD-COSMOS, and Simpson et al. (2006) for UD-SXDS. The typical r.m.s noise level of the VLA data is Jy beam-1.
We find that there are no counterparts in the X-ray, MIR, and radio data. The no X-ray, MIR, and radio counterparts indicate that there is no clear signature of AGN activities based on the multi-wavelength data. By considering the typical SED of AGNs (e.g., Elvis et al. (1994); Telfer et al. (2002); Richards et al. (2003)), the rest-frame UV luminosity of LAEs, and the sensitivity limits of these multi-wavelength data, we rule out, at least, the possibility that the LAEs have radio-loud AGNs.
4.4 UV Nebular Line Flux
Here we investigate whether the rest-frame UV-nebular lines of N v, C iv, He ii, and O iii] are detected from the bright LAEs. First, we check the detectability of N v emission line which is a coarse indicator of AGN presence. The wavelengths of N v are covered by the FOCAS, LDSS3, and IMACS optical spectra for both of the and LAE samples. In order to estimate the flux limits, we sample the 1D spectra in Å bins (comparable to the Ly line FWHM) around the expected wavelengths of N v. We then obtain the flux limit by using the flux distribution over a Å range of the expected wavelengths of N v. We find that there are no N v emission lines for all the 21 bright LAEs. The flux limits for the N v emission lines are listed in Table 4.2. The line flux ratio of N v to Ly is typically %.
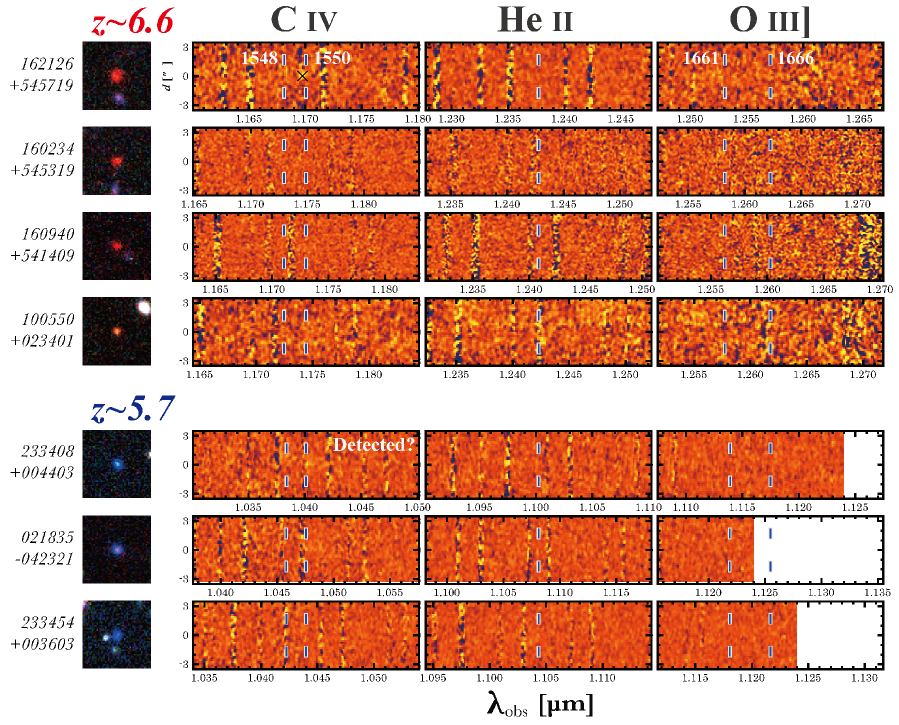
Next, we search for the UV-nebular emission lines of C iv, He ii, and O iii] for the seven bright LAEs whose NIR spectra are obtained (Section 3.2). Figure 6 presents the NIR spectra for the seven LAEs. Even in the deep NIR spectra with a line flux sensitivity limit of erg s-1 cm-2, we find no significant emission features at the expected wavelengths of redshifted He ii, C iv, and O iii] lines, except for a tentative C iv detection from a LAE, HSC J233408004403 (see below in this section). The flux limits for the C iv, He ii, and O iii] emission lines are estimated in the same manner as that for N v. To estimate the detection limits, we assume a single emission line even for the C iv and O iii] doublets which are resolved in the spectral resolution of MOSFIRE and nuMOIRCS. The flux limits for individual UV-nebular emission lines are listed in Table 4.2.
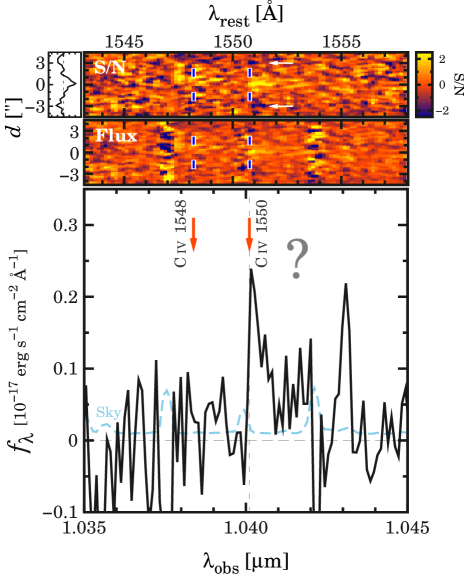
Our deep NIR spectroscopy indicates that there are no significant detections of the UV-nebular emission lines for bright LAEs. By our visual inspections for the NIR spectra, we find a tentative detection of C iv emission line from the brightest LAE in the sample, HSC J233408004403. Figure 7 shows the NIR spectra around the wavelengths of the C iv emission line doublet for HSC J233408004403. The C iv emission line is tentatively detected at the significance level. The significance of the line detection depends on the wavelength range of flux integration. We also identify two negative C iv emission lines which could be originated from the slit dithering processes in the MOSFIRE observation. Moreover, the tentative C iv detection might explain a possible magnitude excess in the -band covering the C iv wavelength (see Figure 3). The line flux is erg cm-2 s-1. The emission line has a velocity width of km s-1 which is marginally resolved in the MOSFIRE spectral resolution. We do not detect the C iv1548 component of the C iv doublet from HSC J233408004403. The single C iv emission line at Å may be formed by a combination of absorption and emission lines that could be originated from stellar winds and ISM. Such a C iv line profile has been found for galaxies (e.g., Shapley et al. (2003); Erb et al. (2010); Du et al. (2016)). We discuss the emission line properties of the C iv emitter in Section 5.3.
4.5 Re-analysis of CR7 Spectra
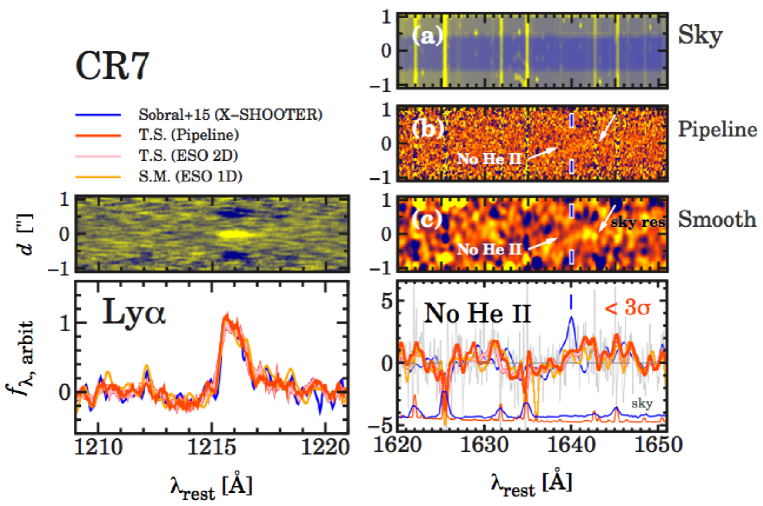
We investigate the VLT/X-SHOOTER spectrum of CR7 whose detection of He ii is claimed by Sobral et al. (2015). Two individuals of the authors in this paper and the ESO-archive service re-analyze the VLT/X-SHOOTER data that are used in the study of Sobral et al. (2015). We apply three methods to our re-analysis: (1) reducing the raw data with the X-SHOOTER reduction pipeline ESO REFLEX (Pipeline), (2) stacking of each 2D 1-exposure spectrum reduced by ESO (ESO 2D), and (3) stacking of each 1D 1-exposure spectrum reduced by ESO (ESO 1D). We smooth our reduced X-SHOOTER spectra with a kernel of Å width which corresponds to that of Sobral et al. (2015).
Figure 8 presents our reduced X-SHOOTER data of the optical (the left panel) and NIR (the right panel) arms for CR7 with the 1D spectrum obtained by Sobral et al. (2015). As shown in the left panel of Figure 8, we clearly identify a Ly emission line at Å. The Ly line profiles of our data are in good agreement with that of the \authorcite2015ApJ…808..139S’s optical spectrum. However, we find no signal at Å where Sobral et al. (2015) find the emission line feature (the right panel of Figure 8). The detection significance is at Å in our NIR spectra. Instead, our NIR spectra show a feature of two possible peaks at Å which is redder than the He ii wavelength of Sobral et al. (2015) by Å corresponding to the redshift difference of . If we regard the two possible peaks as He ii, we obtain a detection significance of . This significance value is inconsistent with the detection of Sobral et al. (2015). Moreover, the red component of the two possible peaks appears to be made by sky subtraction residuals, as shown in the panel (a) of Figure 8. In the case that this red component is masked for the line flux calculation, the detection significance decreases to . To obtain all the values of detection significance and noise levels, we use OH sky line-free regions.
In our careful re-analysis for the X-SHOOTER data, we find that no He ii signal of CR7 is detected. The no He ii detection supports weak UV-nebular lines of the bright LAEs even for CR7. Based on our -based re-analysis and the flux error from Sobral et al. (2015), we obtain the upper limits of He ii flux and EW for CR7, erg s-1 cm-2 and Å, respectively. 333Recently, the He ii/Ly line flux ratio for CR7 has been updated based on the flux recalibration of the X-SHOOTER spectrum in Matthee et al. (2017) and Sobral et al. (2017).
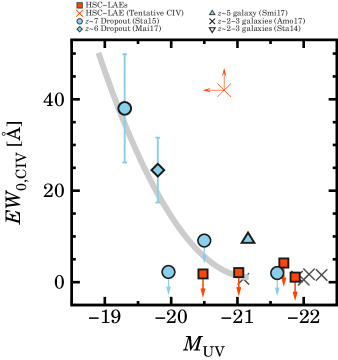
; cyan filled diamond: dropout in Mainali et al. (2017); cyan filled triangle: Smit et al. (2017)). The gray symbols indicate galaxies (gray crosses: Amorín et al. (2017); gray open inverse-triangle: Stark et al. (2014)). The gray curves represent the best-fit quadratic functions to the data points of dropouts in Stark et al. (2014) and Mainali et al. (2017) and our LAEs. The data points without a UV-nebular line detection indicate upper limits.
4.6 Line Flux Ratios
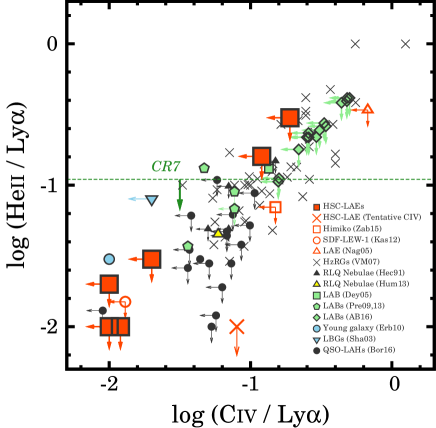
Figure 9 represents the line flux ratios of He ii/Ly and C iv/Ly for our bright LAEs and several Ly-emitting populations such as LAEs (Zabl et al. (2015); Kashikawa et al. (2012); Nagao et al. (2005)), spatially extended Ly blobs (LABs; Dey et al. (2005); Prescott et al. (2009, 2013); Arrigoni Battaia et al. (2015)), metal-poor and star-forming galaxies (Shapley et al. (2003); Erb et al. (2010)), AGNs, QSOs, and radio galaxies (Villar-Martín et al. (2007); Heckman et al. (1991); Humphrey et al. (2013); Borisova et al. (2016)). 444Note that the C iv doublet is not spectroscopically resolved for some of the previous studies. The flux upper limit for such an unresolved C iv doublet would be higher than that of resolved C iv lines. But, the systematics of the C iv flux upper limits are as small as dex in a flux ratio of , which could not affect the main conclusion. We add CR7 with our updated He ii/Ly constraint in Section 4.5. The UV-nebular lines of C iv, He ii, and O iii] are not detected from all of our 7 bright LAEs even for CR7 except for a tentative C iv detection (Section 5.3). Albeit with only upper limits on the line flux ratios, we find that our bright LAEs typically have flux ratios of He ii/Ly and C iv/Ly lower than those of AGNs, QSOs, radio galaxies, and LABs, but similar to those of star forming galaxies in Shapley et al. (2003) and Erb et al. (2010). Interestingly, the UV-nebular lines are extremely faint for several of our bright LAEs. For such objects, the flux ratio of the UV-nebular lines relative to Ly, i.e. , is below the order of 1 %.
5 Discussion
5.1 Properties of Bright LAEs at
We summarize the properties of the bright LAEs which have been revealed in our statistical study (Section 4).
-
•
The Ly equivalent widths, , range from Å to Å.
-
•
The Ly line widths are km s-1.
-
•
There are no detections of X-ray, MIR, and radio emission.
-
•
The N v emission line is not detected down to a N v/Ly flux ratio of %.
-
•
Most of the bright LAEs have the compact Ly emission. Only 5 objects out of the 28 bright LAEs show Ly emission which are significantly extended compared to the PSF FWHM size of in the ground-based HSC NB images.
-
•
The UV-nebular lines of C iv, He ii, and O iii] are not detected from all of our 7 bright LAEs even for CR7 except for a tentative C iv detection (Section 5.3). The flux ratio of the UV-nebular lines relative to Ly is %.
Here we discuss the physical origins of bright LAEs with . The bright Ly emission could be reproduced by several mechanisms: (1) gas photo-ionizaiton by a hidden AGN, (2) strong UV radiation from Pop III stellar populations, (3) gas shock heating by strong outflows from central galaxies, and (4) intense starbursts by galaxy mergers.
Firstly, we discuss the possibility of AGNs. For , Konno et al. (2016) have identified a significant hump of LAE number density at the Ly LF bright-end of . All of the LAEs in the bright-end hump are detected in X-ray, UV, or radio data, suggesting that the bright Ly emission is produced by the central AGN activity. Similarly, there is a possibility that AGNs enhance the Ly luminosity for bright LAEs at . However, we find no clear signatures of AGNs according to the narrow Ly line widths of km s-1 and no detections of N v line, X-ray, MIR, nor radio emission. Thus, the bright LAEs at do not host broad-line AGNs, regardless of the bright Ly emission.
Secondly, we discuss the possibility of Pop III stellar populations. There is a possibility that strong UV radiation from Pop III stellar populations enhance the Ly luminosity (e.g., Schaerer (2002)). In our deep NIR spectroscopy, we find that there are no detections of He ii emission line from CR7, Himiko, nor our 7 bright LAEs which are observed with NIR spectrographs. Moreover, the Ly EW does not significantly exceed the value of Å for the bright LAEs. The no He ii detection and the small values might indicate that the bright LAEs do not host Pop III stellar populations. The no Pop III stellar populations in bright LAEs might be supported by theoretical studies. According to a recent theoretical study of Yajima & Khochfar (2017), Pop III-dominated galaxies at have a Ly luminosity of erg s-1 which is slightly lower than that of our bright LAEs. However, we cannot obtain the conclusion that Pop III stellar populations exist in bright LAEs from the current data of He ii measurements. The detectability of He ii emission line would largely depend on the stellar initial mass function of galaxies (see Section 5.4). To examine whether bright LAEs host Pop III stellar populations, we require NIR spectra whose depth is deeper than the current NIR flux limits.
Thirdly, we discuss the possibility that strong outflows enhance the Ly luminosity (e.g., Dijkstra & Wyithe (2010)). If strong outflows exist, expelling high velocity clouds could make Ly lines broad and Ly emission spatially extended. Our spectroscopy reveals that bright LAEs have a narrow Ly emission line of km s-1. Our measurements also indicate that most of our bright LAEs show the spatially compact Ly emission (see Section 4.1 and Table 4.2). The narrow Ly line width and the spatially compact Ly emission might suggest no strong gaseous outflow from the bright LAEs. However, we cannot conclude the presence of gaseous outflow based on our current data of optical spectra and NB images due to the resonance nature of Ly photons. To investigate the presence of gaseous outflow, we have to directly measure velocity shifts of low-ionization metal lines with deep NIR spectra for the rest-frame UV continuum emission (e.g., Shibuya et al. (2014b); Erb et al. (2014); Erb (2015); Trainor et al. (2015); Sugahara et al. (2017)).
Finally, we discuss the possibility that intense starbursts driven by galaxy mergers produce the large Ly luminosity. High spatial resolution imaging observations with Hubble WFC3 have been conducted for two objects out of the 28 bright LAEs, Himiko and CR7, both of which show multiple subcomponents in the rest-frame UV continuum emission (Sobral et al. (2015); Ouchi et al. (2013)). These multiple subcomponents could be indicative of galaxy mergers (e.g., Jiang et al. (2013); Shibuya et al. (2014a); Kobayashi et al. (2016)). However, the galaxy morphology has been unclear for the other 26 bright LAEs in the ground-based and seeing-limited HSC images.
In summary, the physical origins of bright LAEs have still been unknown. At least we can conclude that the bright Ly emission is not originated from broad-line AGNs. To obtain the definitive conclusion, we need to systematically perform deep NIR spectroscopy and high spatial resolution imaging observations for a large number of bright LAEs.
5.2 Relation between UV-nebular Line EW and UV-continuum Luminosity
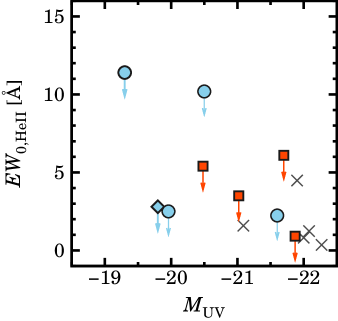
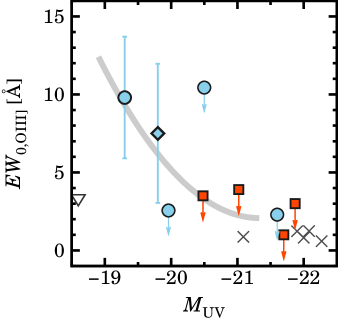
Combining samples of our bright LAEs and faint dropouts at , we examine the relation between the UV-nebular line EWs of C iv, He ii, and O iii] and UV-continuum luminosity. Figure 10 presents the rest-frame EW of C iv, He ii, and O iii] as a function of for our bright LAEs and dropouts in literature (e.g., Stark et al. (2015); Mainali et al. (2017); Smit et al. (2017)). Here we plot four UV continuum-detected objects out of our 7 bright LAEs whose UV-nebular line EW can be constrained. The EW upper limits of our bright LAEs are typically , , and Å for C iv, He ii, and O iii] lines, respectively. On the other hand, faint dropouts with emit strongly C iv and O iii] lines with Å and Å, respectively.
As shown in Figure 10, we find a trend that EWs of C iv and O iii] increase towards faint . Such a trend is similar to recent study results for galaxies showing that UV-nebular lines are predominantly detected in faint sources (Stark et al. (2014); Amorín et al. (2017); see also Du et al. (2017) for C iii]). On the other hand, we do not find a clear trend for He ii due to no He ii detection from all of our bright LAEs nor dropouts. For the clarity of the and relations, we fit a quadratic function to the data points of dropouts in Stark et al. (2015) and Mainali et al. (2017) and our LAEs. In the fitting, we use the values of EW upper limits for the objects without a UV-nebular line detection. We exclude the LAE with a tentative C iv detection and a dropout with a weak constraint in Stark et al. (2015) for the fitting (see Section 5.3). The best-fit quadratic functions are shown in Figure 10.
In contrast to the gravitationally lensed and faint dropouts of Stark et al. (2015), Mainali et al. (2017), and Smit et al. (2017), our bright LAEs have a moderately bright UV magnitude ranging from to . The no UV-nebular line detections from the bright sources could suggest that such a high value is a characteristic of low-mass galaxies. The high UV-nebular line EW in low-mass galaxies would be due to a hard ionizing spectrum (i.e. , the number of LyC photons per UV luminosity; e.g., Nakajima et al. (2016); Bouwens et al. (2016)). Moreover, recent studies for galaxies report that high-ionization UV-nebular lines highly depend on the gas-phase metallicity (e.g., Senchyna et al. (2017)). Our possible correlation may also suggest a dependence of UV-nebular line EW on metallicity for galaxies via the mass-metallicity relation.
5.3 A Tentative Detection of C iv Emission Line
In this section, we discuss the EW and UV-nebular line ratios for the LAE whose C iv is tentatively detected (Section 4.4). We estimate the C iv EW, , by using the upper limits of the rest-frame UV continuum flux density. We obtain Å, which is comparable to that of a dropout in Stark et al. (2015). The value might be too high according to the anti-correlation between and UV-continuum luminosity in Section 5.2. However, it should be noted that the UV continuum is not detected for HSC J233408004403. In the case that the UV magnitude is fainter than , the value would be comparable to the trend that is high at a high UV-continuum luminosity.
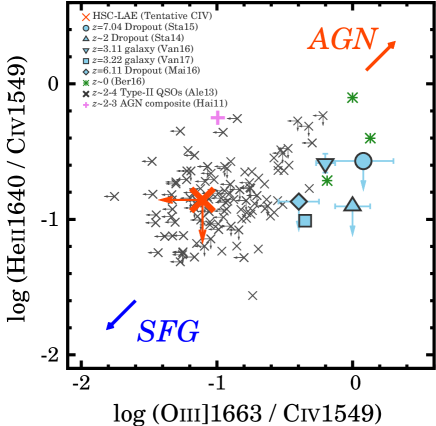
Assuming that the C iv emission line is detected in HSC J233408004403, we compare the He ii/C iv and O iii]/C iv line flux ratios of HSC J233408004403 with those of star-forming galaxies at and AGNs/QSOs (Vanzella et al. (2016, 2017); Mainali et al. (2017); Stark et al. (2014); Berg et al. (2016); Alexandroff et al. (2013); Hainline et al. (2011)). Figure 11 shows the line flux ratios of He ii/C iv and O iii]/C iv for HSC J233408004403 and star-forming galaxies and AGNs/QSOs. As shown in Figure 11, HSC J233408004403 has a flux ratio limit of log(He ii/C iv) similar to that of star-forming galaxies at .
We compare the limits of flux ratios with those of photoionization models of star-forming galaxies and AGNs in Feltre et al. (2016). The comparison suggests that the constraints on the line flux ratios for HSC J233408004403 are more comparable to star-forming galaxies as ionizing sources than AGNs predicted by the model predictions, supporting the results of no clear signatures of AGN activity in Sections 4.2 and 4.3.
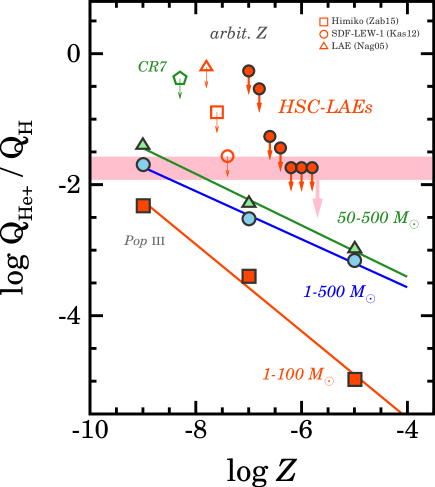
5.4 Spectral Hardness of Bright LAEs
We investigate the spectral hardness of bright LAEs at based on the upper limits on the He ii/Ly line flux ratios (Section 4.4). Figure 12 presents the spectral hardness, , as a function of metallicity, , for our bright LAEs and LAEs in previous studies (Himiko in Zabl et al. (2015); SDF-LEW-1 in Kashikawa et al. (2012); SDF J132440.6273607 in Nagao et al. (2005)). Here we use which is more model-independent than physical quantities of e.g., . The value is calculated with an equation of
| (1) |
where, and are the flux of He ii and Ly emission line, respectively. and are the emitted number of hydrogen and helium ionizing photons, respectively. The traces the energy range between 54.4 and 13.6 eV. The factor of depends on the electron temperature, here taken to be kK (Schaerer (2002)). The upper limits calculated from the He ii/Ly line flux ratios (Table 4.2) ranges from to . For five objects of our bright LAEs, we put strong upper limits of .
Figure 12 also shows the the model spectral hardness predicted from initial mass functions (IMFs) with different stellar mass ranges of M⊙, M⊙, and M⊙(Schaerer (2003)). The metallicity of bright LAEs has not been constrained yet. If we assume that bright LAEs are extremely metal poor below , top-heavy IMFs with M⊙ might be ruled out by our constraints for LAEs.
6 Summary and Conclusions
We present Ly and UV-nebular emission line properties of bright LAEs at with a luminosity of identified in the 21-deg2 area of the SILVERRUSH early sample developed with the Subaru/HSC survey data (Ouchi et al. (2017); Shibuya et al. (2017)).
Our findings are summarized as follows:
-
•
Our optical spectroscopy newly confirm 21 bright LAEs with clear Ly emission, and contribute to make a spectroscopic sample of 97 LAEs at in SILVERRUSH. Our observations enlarge a spectroscopic sample of bright LAEs by a factor of four, allowing for a statistical study on bright LAEs. We find that all the bright LAEs have a narrow Ly line width of km s-1, and do not have X-ray, MIR, radio, nor N v emissions regardless of the large Ly luminosity. The narrow Ly line widths and no X-ray, MIR, radio, nor N v detections suggest that the bright LAEs are not broad-line AGNs.
-
•
From the spectroscopic sample, we select 7 remarkable LAEs as bright as Himiko and CR7 objects, and perform deep Keck/MOSFIRE and Subaru/nuMOIRCS NIR spectroscopy reaching the -flux limit of erg s-1 for the UV-nebular emission lines of He ii, C iv, and O iii]. Except for one tentative detection of C iv, we find no strong UV-nebular lines down to the flux limit, placing the upper limits of of , , and Å for He ii, C iv, and O iii] lines, respectively.
-
•
We investigate the VLT/X-SHOOTER spectrum of CR7 whose detection of He ii is claimed by Sobral et al. (2015). Although two individuals of the authors in this paper and the ESO-archive service carefully re-analyze the X-SHOOTER data that are used in the study of Sobral et al. (2015), no He ii signal of CR7 is detected, supportive of weak UV-nebular lines of the bright LAEs even for CR7.
-
•
Spectral properties of these bright LAEs are clearly different from those of faint dropouts at that have strong UV-nebular lines shown in the various studies (e.g., Stark et al. (2015)). Comparing these bright LAEs and the faint dropouts, we find anti-correlations between the UV-nebular line and UV-continuum luminosity, which are similar to those found at .
The high spatial resolution imaging and deep spectroscopic observations with Hubble Space Telescope and James Webb Space Telescope will reveal the morphology, ISM properties, and the origins of bright LAEs.
7 Appendix
Tables 7 and 7 present faint spectroscopically confirmed HSC LAEs at and , respectively. See Section 3.1.4 for more details.
*7c
Spectroscopically confirmed LAEs with mag
Object ID y Reference
(mag) (mag)
(1) (2) (3) (4) (5) (6) (7)
\endfirsthead\endhead\endfoot(1) Object ID.
(2) Right ascension.
(3) Declination.
(4) Spectroscopic redshift of Ly emission line.
(5)-(6) Total magnitudes of and -bands.
(7) Reference (O10: Ouchi et al. (2010); Hari: Y. Harikane in prep.; H: R. Higuchi in prep.).
Note that the magnitudes are values directly obtained from the HSC catalog.
\endlastfoot ()
HSC J021843050915 02:18:43.62 05:09:15.63 6.510 24.33 24.87 Hari
HSC J021703045619 02:17:03.46 04:56:19.07 6.589 24.45 25.42 O10
HSC J021827043507 02:18:27.01 04:35:07.92 6.511 24.56 25.32 O10
HSC J021844043636 02:18:44.64 04:36:36.21 6.621 24.63 27.34 H
HSC J021702050604 02:17:02.56 05:06:04.61 6.545 24.64 26.35 O10
HSC J021826050726 02:18:27.00 05:07:26.89 6.554 24.69 — O10
HSC J021819050900 02:18:19.39 05:09:00.65 6.563 24.73 26.04 O10
HSC J021654045556 02:16:54.54 04:55:56.94 6.617 24.82 25.67 O10
*7c
Spectroscopically confirmed LAEs with mag
Object ID z Reference
(mag) (mag)
(1) (2) (3) (4) (5) (6) (7)
\endfirsthead\endhead\endfoot(1) Object ID.
(2) Right ascension.
(3) Declination.
(4) Spectroscopic redshift of Ly emission line.
(5)-(6) Total magnitudes of and -bands.
(7) Reference (O08: Ouchi et al. (2008); H: R. Higuchi in prep.).
Note that the magnitudes are values directly obtained from the HSC catalog.
\endlastfoot ()
HSC J095952013723 09:59:52.13 01:37:23.24 5.724 24.07 25.76 M12
HSC J021758043030 02:17:58.91 04:30:30.42 5.689 24.07 25.56 H
HSC J095933024955 09:59:33.44 02:49:55.92 5.724 24.10 27.25 M12
HSC J021749052854 02:17:49.11 05:28:54.17 5.694 24.10 26.77 O08
HSC J021704052714 02:17:04.30 05:27:14.30 5.686 24.11 26.29 H
HSC J095952015005 09:59:52.03 01:50:05.95 5.744 24.11 25.10 M12
HSC J021737043943 02:17:37.96 04:39:43.02 5.7547 24.11 25.63 H
HSC J100015020056 10:00:15.66 02:00:56.04 5.718 24.15 26.08 M12
HSC J021734044558 02:17:34.57 04:45:58.95 5.702 24.20 25.44 H
HSC J100131023105 10:01:31.08 02:31:05.77 5.690 24.23 26.15 M12
HSC J100301020236 10:03:01.15 02:02:36.04 5.682 24.24 24.58 M12
HSC J021654052155 02:16:54.60 05:21:55.52 5.712 24.24 26.49 H
HSC J021748053127 02:17:48.46 05:31:27.02 5.690 24.25 25.67 O08
HSC J100127023005 10:01:27.77 02:30:05.83 5.696 24.28 25.61 M12
HSC J021745052936 02:17:45.24 05:29:36.01 5.688 24.30 27.26 O08
HSC J021725050737 02:17:25.90 05:07:37.59 5.704 24.35 26.21 H
HSC J100208015444 10:02:08.80 01:54:44.99 5.676 24.36 25.65 M12
HSC J095954021039 09:59:54.77 02:10:39.26 5.662 24.38 25.63 M12
HSC J095950025406 09:59:50.09 02:54:06.16 5.726 24.39 26.59 M12
HSC J022013045109 02:20:13.33 04:51:09.40 5.744 24.40 25.88 O08
HSC J100126014430 10:01:26.88 01:44:30.29 5.686 24.41 25.96 M12
HSC J095919020322 09:59:19.74 02:03:22.02 5.704 24.41 26.84 M12
HSC J095954021516 09:59:54.52 02:15:16.50 5.688 24.43 25.95 M12
HSC J021849052235 02:18:49.00 05:22:35.35 5.719 24.45 25.64 H
HSC J100005020717 10:00:05.06 02:07:17.01 5.704 24.46 26.64 M12
HSC J021830052950 02:18:30.75 05:29:50.34 5.707 24.46 28.89 H
HSC J100306014742 10:03:06.13 01:47:42.69 5.680 24.52 26.54 M12
HSC J021804052147 02:18:04.17 05:21:47.25 5.7338 24.54 25.20 H
HSC J100022024103 10:00:22.51 02:41:03.25 5.661 24.55 25.34 M12
HSC J021848051715 02:18:48.23 05:17:15.45 5.741 24.56 25.45 H
HSC J021750050203 02:17:50.86 05:02:03.24 5.708 24.57 26.48 H
HSC J021526045229 02:15:26.22 04:52:29.93 5.655 24.62 24.95 H
HSC J021636044723 02:16:36.44 04:47:23.68 5.718 24.63 26.57 H
HSC J100030021714 10:00:30.41 02:17:14.73 5.695 24.65 26.70 M12
HSC J021558045301 02:15:58.49 04:53:01.75 5.718 24.68 26.55 H
HSC J021719043150 02:17:19.13 04:31:50.64 5.735 24.68 27.87 H
HSC J021822042925 02:18:22.91 04:29:25.89 5.697 24.68 27.65 H
HSC J100131014320 10:01:31.11 01:43:20.50 5.728 24.70 26.45 M12
HSC J095944020050 09:59:44.07 02:00:50.74 5.688 24.71 26.18 M12
HSC J021709050329 02:17:09.77 05:03:29.18 5.709 24.74 26.52 H
HSC J021803052643 02:18:03.87 05:26:43.45 5.747 24.75 27.66 H
HSC J100309015352 10:03:09.81 01:53:52.36 5.705 24.76 26.61 M12
HSC J021805052704 02:18:05.17 05:27:04.06 5.746 24.77 31.43 H
HSC J021739043837 02:17:39.25 04:38:37.21 5.720 24.79 27.00 H
HSC J100040021903 10:00:40.24 02:19:03.70 5.719 24.81 26.96 M12
HSC J021857045648 02:18:57.32 04:56:48.88 5.681 24.85 27.11 H
HSC J021745044129 02:17:45.74 04:41:29.24 5.674 24.86 27.34 H
HSC J021639051346 02:16:39.89 05:13:46.75 5.702 24.87 26.98 H
HSC J021805052026 02:18:05.28 05:20:26.90 5.742 24.87 26.10 H
HSC J021755043251 02:17:55.40 04:32:51.54 5.691 24.91 27.26 H
HSC J100058013642 10:00:58.41 01:36:42.89 5.688 24.91 27.97 M12
HSC J100029015000 10:00:29.58 01:50:00.78 5.707 24.97 26.80 M12
HSC J021911045707 02:19:11.03 04:57:07.48 5.704 25.00 27.46 H
HSC J021551045325 02:15:51.34 04:53:25.44 5.710 25.02 26.76 H
HSC J021625045237 02:16:25.64 04:52:37.18 5.728 25.07 — H
HSC J021751053003 02:17:51.14 05:30:03.64 5.712 25.10 26.99 O08
HSC J021628050103 02:16:28.05 05:01:03.85 5.692 25.17 27.23 H
HSC J021943044914 02:19:43.91 04:49:14.30 5.684 25.17 26.86 H
HSC J100029024115 10:00:29.13 02:41:15.70 5.735 25.22 28.30 M12
HSC J100107015222 10:01:07.35 01:52:22.88 5.668 25.33 26.42 M12
We would like to thank Masayuki Akiyama, Mark Dijkstra, Richard Ellis, Tadayuki Kodama, Jorryt Matthee, David Sobral, Daniel Stark, Yuma Sugahara, and Zheng Zheng for useful discussion and comments. We also thank Kentaro Aoki and Ichi Tanaka for their supports of the FOCAS and MOIRCS observations. We thank the anonymous referee for constructive comments and suggestions. This work is based on observations taken by the Subaru Telescope and the Keck telescope which are operated by the National Observatory of Japan. This work was supported by World Premier International Research Center Initiative (WPI Initiative), MEXT, Japan, KAKENHI (15H02064), (23244025), and (21244013) Grant-in-Aid for Scientific Research (A) through Japan Society for the Promotion of Science (JSPS), and an Advanced Leading Graduate Course for Photon Science grant. NK is supported by JSPS grant 15H03645.
The Hyper Suprime-Cam (HSC) collaboration includes the astronomical communities of Japan and Taiwan, and Princeton University. The HSC instrumentation and software were developed by the National Astronomical Observatory of Japan (NAOJ), the Kavli Institute for the Physics and Mathematics of the Universe (Kavli IPMU), the University of Tokyo, the High Energy Accelerator Research Organization (KEK), the Academia Sinica Institute for Astronomy and Astrophysics in Taiwan (ASIAA), and Princeton University. Funding was contributed by the FIRST program from Japanese Cabinet Office, the Ministry of Education, Culture, Sports, Science and Technology (MEXT), the Japan Society for the Promotion of Science (JSPS), Japan Science and Technology Agency (JST), the Toray Science Foundation, NAOJ, Kavli IPMU, KEK, ASIAA, and Princeton University.
This paper makes use of software developed for the Large Synoptic Survey Telescope. We thank the LSST Project for making their code available as free software at http://dm.lsst.org
The Pan-STARRS1 Surveys (PS1) have been made possible through contributions of the Institute for Astronomy, the University of Hawaii, the Pan-STARRS Project Office, the Max-Planck Society and its participating institutes, the Max Planck Institute for Astronomy, Heidelberg and the Max Planck Institute for Extraterrestrial Physics, Garching, The Johns Hopkins University, Durham University, the University of Edinburgh, Queen’s University Belfast, the Harvard-Smithsonian Center for Astrophysics, the Las Cumbres Observatory Global Telescope Network Incorporated, the National Central University of Taiwan, the Space Telescope Science Institute, the National Aeronautics and Space Administration under Grant No. NNX08AR22G issued through the Planetary Science Division of the NASA Science Mission Directorate, the National Science Foundation under Grant No. AST-1238877, the University of Maryland, and Eotvos Lorand University (ELTE) and the Los Alamos National Laboratory.
References
- Agarwal et al. (2016) Agarwal, B., Johnson, J. L., Zackrisson, E., Labbe, I., van den Bosch, F. C., Natarajan, P., & Khochfar, S. 2016, MNRAS, 460, 4003
- Aihara et al. (2017a) Aihara, H., et al. 2017a, arXiv:1702.08449
- Aihara et al. (2017b) —. 2017b, arXiv:1704.05858
- Alexandroff et al. (2013) Alexandroff, R., et al. 2013, MNRAS, 435, 3306
- Amorín et al. (2017) Amorín, R., et al. 2017, Nature Astronomy, 1, 0052
- Arrigoni Battaia et al. (2015) Arrigoni Battaia, F., Hennawi, J. F., Prochaska, J. X., & Cantalupo, S. 2015, ApJ, 809, 163
- Axelrod et al. (2010) Axelrod, T., Kantor, J., Lupton, R. H., & Pierfederici, F. 2010, An open source application framework for astronomical imaging pipelines
- Bagley et al. (2017) Bagley, M. B., et al. 2017, ApJ, 837, 11
- Berg et al. (2016) Berg, D. A., Skillman, E. D., Henry, R. B. C., Erb, D. K., & Carigi, L. 2016, ApJ, 827, 126
- Borisova et al. (2016) Borisova, E., et al. 2016, ApJ, 831, 39
- Bosch et al. (2017) Bosch, J., et al. 2017, to be submitted to PASJ
- Bouwens et al. (2016) Bouwens, R. J., Smit, R., Labbé, I., Franx, M., Caruana, J., Oesch, P., Stefanon, M., & Rasappu, N. 2016, ApJ, 831, 176
- Bowler et al. (2016) Bowler, R. A. A., McLure, R. J., Dunlop, J. S., McLeod, D. J., Stanway, E. R., Eldridge, J. J., & Jarvis, M. J. 2016, ArXiv e-prints
- Dey et al. (2005) Dey, A., et al. 2005, ApJ, 629, 654
- Dijkstra et al. (2016) Dijkstra, M., Gronke, M., & Sobral, D. 2016, ApJ, 823, 74
- Dijkstra & Wyithe (2010) Dijkstra, M., & Wyithe, J. S. B. 2010, MNRAS, 408, 352
- Dressler et al. (2011) Dressler, A., et al. 2011, PASP, 123, 288
- Du et al. (2016) Du, X., Shapley, A. E., Martin, C. L., & Coil, A. L. 2016, ApJ, 829, 64
- Du et al. (2017) —. 2017, ApJ, 838, 63
- Elvis et al. (1994) Elvis, M., et al. 1994, ApJS, 95, 1
- Erb (2015) Erb, D. K. 2015, Nature, 523, 169
- Erb et al. (2010) Erb, D. K., Pettini, M., Shapley, A. E., Steidel, C. C., Law, D. R., & Reddy, N. A. 2010, ApJ, 719, 1168
- Erb et al. (2014) Erb, D. K., et al. 2014, ApJ, 795, 33
- Fabricius et al. (2016) Fabricius, M., et al. 2016, in Proc. SPIE, Vol. 9908, Society of Photo-Optical Instrumentation Engineers (SPIE) Conference Series, 990828
- Feltre et al. (2016) Feltre, A., Charlot, S., & Gutkin, J. 2016, MNRAS, 456, 3354
- Fisher et al. (2014) Fisher, D. B., et al. 2014, Nature, 505, 186
- Hainline et al. (2011) Hainline, K. N., Shapley, A. E., Greene, J. E., & Steidel, C. C. 2011, ApJ, 733, 31
- Hansen & Oh (2006) Hansen, M., & Oh, S. P. 2006, mnras, 367, 979
- Harikane et al. (2017) Harikane, Y., et al. 2017, arXiv:1704.06535
- Hartwig et al. (2016) Hartwig, T., et al. 2016, MNRAS, 462, 2184
- Heckman et al. (1991) Heckman, T. M., Lehnert, M. D., Miley, G. K., & van Breugel, W. 1991, ApJ, 381, 373
- Hu et al. (2010) Hu, E. M., Cowie, L. L., Barger, A. J., Capak, P., Kakazu, Y., & Trouille, L. 2010, ApJ, 725, 394
- Hu et al. (2016) Hu, E. M., Cowie, L. L., Songaila, A., Barger, A. J., Rosenwasser, B., & Wold, I. G. B. 2016, ApJ, 825, L7
- Humphrey et al. (2013) Humphrey, A., Binette, L., Villar-Martín, M., Aretxaga, I., & Papaderos, P. 2013, MNRAS, 428, 563
- Ichikawa et al. (2006) Ichikawa, T., et al. 2006, in Proc. SPIE, Vol. 6269, Society of Photo-Optical Instrumentation Engineers (SPIE) Conference Series, 626916
- Ivezic et al. (2008) Ivezic, Z., et al. 2008, ArXiv e-prints
- Jiang et al. (2013) Jiang, L., et al. 2013, ApJ, 773, 153
- Johnson & Dijkstra (2016) Johnson, J. L., & Dijkstra, M. 2016, ArXiv e-prints
- Jurić et al. (2015) Jurić, M., et al. 2015, ArXiv e-prints
- Kashikawa et al. (2002) Kashikawa, N., et al. 2002, PASJ, 54, 819
- Kashikawa et al. (2006) —. 2006, ApJ, 648, 7
- Kashikawa et al. (2011) —. 2011, ApJ, 734, 119
- Kashikawa et al. (2012) —. 2012, ApJ, 761, 85
- Kawanomoto (2017) Kawanomoto, S. 2017, to be submitted to PASJ
- Kobayashi et al. (2016) Kobayashi, M. A. R., et al. 2016, ApJ, 819, 25
- Kojima et al. (2016) Kojima, T., Ouchi, M., Nakajima, K., Shibuya, T., Harikane, Y., & Ono, Y. 2016, ArXiv e-prints
- Konno et al. (2016) Konno, A., Ouchi, M., Nakajima, K., Duval, F., Kusakabe, H., Ono, Y., & Shimasaku, K. 2016, ApJ, 823, 20
- Konno et al. (2014) Konno, A., et al. 2014, apj, 797, 16
- Konno et al. (2017) —. 2017, arXiv:1705.01222
- Magnier et al. (2013) Magnier, E. A., et al. 2013, ApJS, 205, 20
- Mainali et al. (2017) Mainali, R., Kollmeier, J. A., Stark, D. P., Simcoe, R. A., Walth, G., Newman, A. B., & Miller, D. R. 2017, ApJ, 836, L14
- Mallery et al. (2012) Mallery, R. P., et al. 2012, ApJ, 760, 128
- Massey & Gronwall (1990) Massey, P., & Gronwall, C. 1990, ApJ, 358, 344
- Matthee et al. (2017) Matthee, J., Sobral, D., Darvish, B., Santos, S., Mobasher, B., Paulino-Afonso, A., Röttgering, H., & Alegre, L. 2017, ArXiv e-prints
- Matthee et al. (2015) Matthee, J., Sobral, D., Santos, S., Röttgering, H., Darvish, B., & Mobasher, B. 2015, mnras, 451, 400
- McLean et al. (2012) McLean, I. S., et al. 2012, in Proc. SPIE, Vol. 8446, Ground-based and Airborne Instrumentation for Astronomy IV, 84460J
- Murayama et al. (2007) Murayama, T., et al. 2007, ApJS, 172, 523
- Nagao et al. (2005) Nagao, T., Motohara, K., Maiolino, R., Marconi, A., Taniguchi, Y., Aoki, K., Ajiki, M., & Shioya, Y. 2005, ApJ, 631, L5
- Nakajima et al. (2016) Nakajima, K., Ellis, R. S., Iwata, I., Inoue, A. K., Kusakabe, H., Ouchi, M., & Robertson, B. E. 2016, ApJ, 831, L9
- Neufeld (1991) Neufeld, D. A. 1991, ApJl, 370, L85
- Oke & Gunn (1983) Oke, J. B., & Gunn, J. E. 1983, ApJ, 266, 713
- Ono et al. (2017) Ono, Y., et al. 2017, arXiv:1704.06004
- Ota et al. (2008) Ota, K., et al. 2008, ApJ, 677, 12
- Ouchi et al. (2008) Ouchi, M., et al. 2008, ApJs, 176, 301
- Ouchi et al. (2009) —. 2009, ApJ, 696, 1164
- Ouchi et al. (2010) —. 2010, ApJ, 723, 869
- Ouchi et al. (2013) —. 2013, ApJ, 778, 102
- Ouchi et al. (2017) —. 2017, arXiv:1704.07455
- Pacucci et al. (2017) Pacucci, F., Pallottini, A., Ferrara, A., & Gallerani, S. 2017, MNRAS, 468, L77
- Pallottini et al. (2015a) Pallottini, A., et al. 2015a, MNRAS, 453, 2465
- Pallottini et al. (2015b) —. 2015b, ArXiv e-prints
- Planck Collaboration et al. (2016) Planck Collaboration et al. 2016, A&A, 594, A13
- Prescott et al. (2009) Prescott, M. K. M., Dey, A., & Jannuzi, B. T. 2009, ApJ, 702, 554
- Prescott et al. (2013) —. 2013, ApJ, 762, 38
- Richards et al. (2003) Richards, G. T., et al. 2003, AJ, 126, 1131
- Sanders et al. (2007) Sanders, D. B., et al. 2007, ApJS, 172, 86
- Schaerer (2002) Schaerer, D. 2002, A&A, 382, 28
- Schaerer (2003) —. 2003, A&A, 397, 527
- Schinnerer et al. (2007) Schinnerer, E., et al. 2007, ApJS, 172, 46
- Schlafly et al. (2012) Schlafly, E. F., et al. 2012, ApJ, 756, 158
- Senchyna et al. (2017) Senchyna, P., et al. 2017, ArXiv e-prints
- Shapley et al. (2003) Shapley, A. E., Steidel, C. C., Pettini, M., & Adelberger, K. L. 2003, ApJ, 588, 65
- Shibuya et al. (2012) Shibuya, T., Kashikawa, N., Ota, K., Iye, M., Ouchi, M., Furusawa, H., Shimasaku, K., & Hattori, T. 2012, ApJ, 752, 114
- Shibuya et al. (2014a) Shibuya, T., Ouchi, M., Nakajima, K., Yuma, S., Hashimoto, T., Shimasaku, K., Mori, M., & Umemura, M. 2014a, ApJ, 785, 64
- Shibuya et al. (2014b) Shibuya, T., et al. 2014b, apj, 788, 74
- Shibuya et al. (2017) —. 2017, ArXiv e-prints:1704.08140
- Shimasaku et al. (2006) Shimasaku, K., et al. 2006, PASJ, 58, 313
- Simpson et al. (2006) Simpson, C., et al. 2006, MNRAS, 372, 741
- Smidt et al. (2016) Smidt, J., Wiggins, B. K., & Johnson, J. L. 2016, ApJ, 829, L6
- Smit et al. (2017) Smit, R., Swinbank, A. M., Massey, R., Richard, J., Smail, I., & Kneib, J.-P. 2017, MNRAS, 467, 3306
- Smith et al. (2016) Smith, A., Bromm, V., & Loeb, A. 2016, MNRAS, 460, 3143
- Sobral et al. (2015) Sobral, D., Matthee, J., Darvish, B., Schaerer, D., Mobasher, B., Röttgering, H. J. A., Santos, S., & Hemmati, S. 2015, apj, 808, 139
- Sobral et al. (2017) Sobral, D., et al. 2017, in preparation
- Stark et al. (2014) Stark, D. P., et al. 2014, MNRAS, 445, 3200
- Stark et al. (2015) —. 2015, MNRAS, 454, 1393
- Sugahara et al. (2017) Sugahara, Y., Ouchi, M., Lin, L., Martin, C. L., Ono, Y., Harikane, Y., Shibuya, T., & Yan, R. 2017, ArXiv e-prints:1703.01885
- Suzuki et al. (2008) Suzuki, R., et al. 2008, PASJ, 60, 1347
- Taniguchi et al. (2005) Taniguchi, Y., et al. 2005, PASJ, 57, 165
- Taniguchi et al. (2009) —. 2009, ApJ, 701, 915
- Telfer et al. (2002) Telfer, R. C., Zheng, W., Kriss, G. A., & Davidsen, A. F. 2002, ApJ, 565, 773
- Tonry et al. (2012) Tonry, J. L., et al. 2012, ApJ, 750, 99
- Trainor et al. (2015) Trainor, R. F., Steidel, C. C., Strom, A. L., & Rudie, G. C. 2015, ApJ, 809, 89
- Ueda et al. (2008) Ueda, Y., et al. 2008, ApJS, 179, 124
- Vanzella et al. (2016) Vanzella, E., et al. 2016, ApJ, 821, L27
- Vanzella et al. (2017) —. 2017, ApJ, 842, 47
- Villar-Martín et al. (2007) Villar-Martín, M., Humphrey, A., De Breuck, C., Fosbury, R., Binette, L., & Vernet, J. 2007, MNRAS, 375, 1299
- Visbal et al. (2017) Visbal, E., Bryan, G. L., & Haiman, Z. 2017, ArXiv e-prints
- Visbal et al. (2016) Visbal, E., Haiman, Z., & Bryan, G. L. 2016, MNRAS, 460, L59
- Walawender et al. (2016) Walawender, J., et al. 2016, in Proc. SPIE, Vol. 9908, Society of Photo-Optical Instrumentation Engineers (SPIE) Conference Series, 99082G
- Yajima & Khochfar (2017) Yajima, H., & Khochfar, S. 2017, MNRAS, 467, L51
- Yuma et al. (2017) Yuma, S., Ouchi, M., Drake, A. B., Fujimoto, S., Kojima, T., & Sugahara, Y. 2017, ArXiv e-prints
- Zabl et al. (2015) Zabl, J., Nørgaard-Nielsen, H. U., Fynbo, J. P. U., Laursen, P., Ouchi, M., & Kjærgaard, P. 2015, mnras, 451, 2050