Quasi one-dimensional metallic band dispersion in the commensurate charge density wave of -TaS2
Abstract
The commensurate charge density wave (CDW) in the layered compound -TaS2 has hitherto mostly been treated as a quasi two-dimensional phenomenon. Recent band structure calculations have, however, predicted that the CDW coexists with a nearly one-dimensional metallic dispersion perpendicular to the crystal planes. Using synchrotron radiation based angle-resolved photoemission spectroscopy, we show that this metallic band does in fact exist. Its occupied band width is in excellent agreement with predictions for a simple stacking order of the CDW between adjacent layers and its periodicity in the direction is .
The polytype of TaS2 is one of the most studied layered transition metal dichalcogenides (TMDCs). Its rich electronic phase diagram involves several charge density wave (CDW) transitions driven by strong electronic correlations and electron-phonon coupling Wilson et al. (1975); Rossnagel (2011). Particular focus has been on the ground state below 180 K which is a commensurate CDW phase with a so-called Star of David reconstruction that is rotated by against the lattice. In this phase, the large-scale periodic lattice distortion is thought to coexist with a Mott insulating ground state arising from the single electron localized on the centre atom of the Star of David Wilson et al. (1975); Fazekas and Tosatti (1979). While the research on CDWs in layered TMDCs is more than 40 years old, renewed interest has been driven by the possibility to elucidate transitions between different CDW states using ultrafast techniques Perfetti et al. (2006, 2008); Hellmann et al. (2010); Eichberger et al. (2010); Petersen et al. (2011); Stojchevska et al. (2014); by the observation of metastable “hidden states” Stojchevska et al. (2014); and by the experimental accessibility of metallic TMDCs as single layers Ugeda et al. (2016); Sanders et al. (2016).
The realization that CDWs could be different in single layer TMDCs than in analogous bulk materials has drawn attention to the fact that viewing the bulk materials’ electronic properties as essentially two-dimensional might be an oversimplification. While reduced dimensionality has a significant impact on electronic instabilities, due to increased electronic correlations and electron-phonon coupling, interlayer coupling also appears to be essential for a full understanding of the electronic properties of these materials Bovet et al. (2003); Rossnagel et al. (2005); Freericks et al. (2009); Darancet et al. (2014); Ritschel et al. (2015); Lazar et al. (2015). Specifically, several calculations predict a one-dimensional metallic band formation along the direction of the Brillouin zone in the ground state CDW of -TaS2 (i.e., perpendicular to the planes). This is found in density functional theory calculations Bovet et al. (2003); Ritschel et al. (2015); Lazar et al. (2015), even when electronic correlations are taken into account Darancet et al. (2014); Freericks et al. (2009). While the metallic band along is universally found in all calculations, the details of the dispersion depend on the stacking order of the CDW unit cell between adjacent planes Darancet et al. (2014); Ritschel et al. (2015).
Angle-resolved photoemission spectroscopy (ARPES) is an experimental technique capable of determining the three-dimensional band structure of crystalline solids, and numerous ARPES studies have been performed on -TaS2 (for a review see Ref. Rossnagel (2011)). However, very little attention has been paid to the possibly three-dimensional character of the band structure. In this Letter, we report a systematic determination of the band structure perpendicular to the planes of -TaS2 from high-quality crystals in the commensurate CDW phase, with special focus on the possible metallicity of the compound in this direction. We do observe the theoretically predicted one-dimensional metallic band. The occupied band width and the observed periodicity agree with a simple stacking order of the CDW—i.e., a stacking in which the center atoms of the Stars of David are placed directly on top of each other in adjacent layers.
The -TaS2 crystals were grown from high purity elements by chemical vapor transport using iodine as a transport agent; for details see Ref. Haupt et al. (2016). The crystals were cleaved at 30 K in ultra-high vacuum, and ARPES data were collected on the SGM-3 end station of ASTRID2 Hoffmann et al. (2004). The energy resolution varied from 50 to 130 meV for the lowest and highest photon energies, respectively. The angular resolution was better than 0.2∘. The temperature during the ARPES experiments was 30 K.
A first suggestion of the three-dimensional character of the -TaS2 band structure in the commensurate CDW is given in Fig. 1, which shows the photoemission intensity along high-symmetry directions in the surface Brillouin zone for two different photon energies (96 and 75 eV for Fig. 1(a) and (b), respectively). Assuming free-electron final states and using a procedure outlined below SMA , the photon energies have been chosen such that data are collected approximately in the plane and plane of the bulk Brillouin zone for (a) and (b), respectively. For a definition of the high-symmetry points see Fig. 1(c). Note, however, that only the parallel component of the crystal momentum is conserved in the photoemission process. The high-symmetry points of the surface Brillouin zone are reached exactly. The and points in the bulk Brillouin are also reached rather precisely, but the points at finite only approximately SMA .
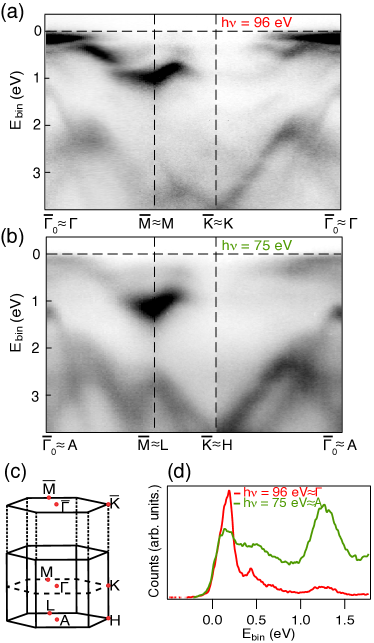
At first glance, the dispersions are very similar to each other and in good agreement with previous ARPES results Pillo et al. (1999); Arita et al. (2004); Bovet et al. (2004); Perfetti et al. (2005); Rossnagel et al. (2005); Clerc et al. (2006); Ritschel et al. (2015). The states close to the Fermi energy are broad due to the strongly correlated character of the material, with a lack of any clear Fermi level crossings. However, upon closer inspection, some differences between Fig. 1(a) and (b) can be noted. The deeper lying, sulphur 2p-derived Mattheiss (1973); Manzke et al. (1988) states are expected to be less two-dimensional and do indeed show a different dispersion, for example around . The states near , on the other hand, mostly differ in their intensity. Note, for example that the flat band immediately below near in Fig. 1(a) is very well defined, while it is almost absent at . This difference is best seen in a direct comparison of energy distribution curves through and , as given in Fig. 1(d).
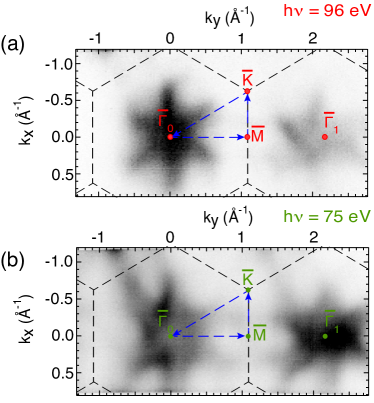
Subtle differences in the states near the Fermi level are especially well seen in the -dependence of the photoemission intensity. Fig. 2(a) and (b) show such intensity plots at a binding energy of 90 meV, taken for the same photon energies as the data in Fig. 1(a) and (b). The plots show distinct differences. In particular, the photoemission intensity reaches a maximum at normal emission (marked as ) in (a) while it shows a local minimum in (b), indicating a dependence of the electronic structure on the perpendicular crystal momentum .
The possible existence of the predicted quasi one-dimensional band along can be established by collecting the photoemission intensity in normal emission as a function of photon energy and binding energy . The result of such a scan is shown in Fig. 3(a). The photoemission intensity in the figure has been converted from the raw data ( measured as a function of and ) to a function of and , using the assumption of free-electron final states SMA . The most important feature in the data is the small electron pocket appearing near the Fermi energy around the points, i.e. at integer multiples of ( Å Wilson and Yoffe (1969)). For clarity, the intensity close to is magnified in Fig. 3(b) and a detailed view of the situation at the highest is given in Fig. 4. The experimental observation of this metallic band is the central result of this paper.
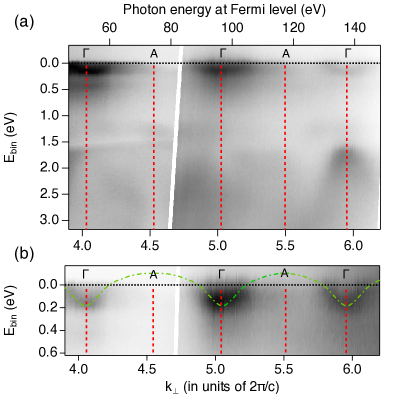
It should be noted that recovering an approximate initial state using free-electron final states requires a choice of the solid’s inner potential and work function Plummer and Eberhardt (1982). Here eV and eV were chosen in order to place the periodically appearing electron pocket close to the point of the Brillouin zone. While somewhat different values for have been used in very early investigations Manzke et al. (1988), we emphasize that the precise choice of this parameter is not critical. Indeed, due to the symmetry of the electron pocket’s dispersion, it can only be placed at either or and no choice of below 40 eV would lead to the electron pocket being found at . Moreover, the choice of the inner potential is also confirmed by the symmetry of the deeper lying bands, especially the sulphur p-bands that show a binding energy minimum at Mattheiss (1973). This minimum is most clearly identified at a binding energy of 1.7 eV for .
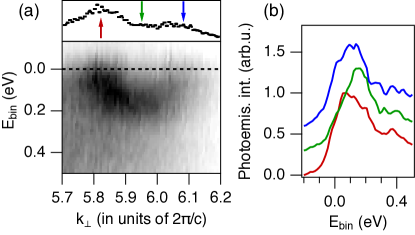
Fig. 3(b) also shows the calculated band structure from Ref. Darancet et al. (2014) superimposed on the data as dashed lines. The agreement is excellent. Other published calculations show very similar dispersions Bovet et al. (2003); Freericks et al. (2009); Ritschel et al. (2015); Lazar et al. (2015). Moreover, the observed periodicity of suggests a real space periodicity of only one unit cell and hence the stacking. This is consistent with calculations, most of which were made under the assumption of stacking.
On the other hand, a regular stacking does not agree with a substantial amount of structural information available on the commensurate CDW phase—see, e.g., Refs. Tanda et al. (1984); Nakanishi and Shiba (1984); Ishiguro and Sato (1991). Data from different techniques reveal considerable disorder in the direction, accompanied by different stackings. This does not, however, imply a contradiction between the ARPES observations and the structural data. First of all, only periodic contributions to the stacking give rise to any regular band structure, while disorder merely increases the background intensity. Moreover, we note that the observed bands are rather broad, as seen in the momentum and energy distribution curves of Fig. 4, suggesting that is not well defined. This can be partly due to disorder, in addition to the intrinsic uncertainty in that stems from the short inelastic mean free path of electrons in solids and the localisation accompanying this Plummer and Eberhardt (1982).
An alternative way to view the periodicity is that, in the absence of a CDW, this would be expected for every band in the polytype. Since the CDW is, after all, only a minor distortion of the lattice Rossnagel (2011), such a periodicity could still be present. This interpretation is supported by an accurate band structure calculation for the undistorted structure (including the significant spin-orbit coupling Rossnagel and Smith (2006)) that shows a very similar metallic dispersion in the direction, even though the in-plane dispersion is completely different from the CDW case Darancet et al. (2014).
The observed electron pocket around also appears to explain the distinct differences in the constant energy surfaces of Fig. 2, since the band is occupied at but empty at . Indeed, Ritschel et al. have challenged the common view that this band is the lower Hubbard band of the Mott insulating state because it can be reproduced by a calculation not including correlations Ritschel et al. (2015). However, the situation is more complex because the metallic band dispersion appears to coexist with a part of the spectral weight at the original peak position of the lower Hubbard band, as seen in the energy distribution curves of Fig. 1(d). Indeed, the peak that is usually assigned to the lower Hubbard band significantly changes its intensity but never entirely disappears, not even at the point of the bulk Brillouin zone (corresponding to h=75 eV) where the strongly dispersing metallic band is predicted to be well above the Fermi level. Such a complex behaviour is not unexpected given the partially disordered character of the CDW along Tanda et al. (1984); Nakanishi and Shiba (1984); Ishiguro and Sato (1991), which should limit the formation of a well-defined band structure in this direction.
The observation of a metallic band is partly consistent with the reported transport phenomena in the material. In the temperature region immediately below the transition to the commensurate CDW (50 – 80 K), a metallic temperature dependence of the resistivity is observed, consistent with the remaining metallic band, but at very low temperature the resistivity increases strongly Di Salvo and Graebner (1977). This has been ascribed to disorder-induced Anderson localization Di Salvo and Graebner (1977), an interpretation that appears consistent with the observed disorder in the direction Tanda et al. (1984); Nakanishi and Shiba (1984); Ishiguro and Sato (1991).
Given the one-dimensional metallic dispersion, one would expect that the resistivity in the direction would be lower than the resistivity in the plane, but the opposite is found. In fact, a direct measurement of gives a value of approximately 500 Hambourger and di Salvo (1980), even in the temperature range of metallic conductance. The apparent contradiction of a metallic band with a lack of metallic conduction could be due to a gap opening in the one-dimensional dispersion near . This is not supported by the detailed view on the dispersion in Fig. 4 which appears to show clear Fermi level crossings. However, the rather broad features do not allow us to draw a definite conclusion about this type of gap formation. Moreover, the simultaneous presence of the dispersing band and the lower Hubbard band throughout the bulk Brillouin zone increase the difficulty of identifying a clear gap opening.
In conclusion, we have observed a one-dimensional metallic band in the direction of -TaS2. This has recently been predicted by several calculations but hitherto never been observed. The result gives strong experimental support to the notion that viewing the TMDC CDW materials as quasi two-dimensional is an oversimplification. It also suggests that new rich physics can be expected from truly two-dimensional single layers of these compounds, not only because of the absence of interaction with neighboring crystal planes but also because the electronic properties can be influenced by substituting these planes with other materials of choice.
This work was supported by the Danish Council for Independent Research, Natural Sciences under the Sapere Aude program (Grants No. DFF-4002-00029 and DFF-6108-00409) and by VILLUM FONDEN via the Centre of Excellence for Dirac Materials (Grant No. 11744).
References
- Wilson et al. (1975) J. Wilson, F. Di Salvo, and S. Mahajan, Adv. Phys. 24, 117 (1975).
- Rossnagel (2011) K. Rossnagel, J. Phys.: Condens. Matter 23, 213001 (2011).
- Fazekas and Tosatti (1979) P. Fazekas and E. Tosatti, Philos. Mag. B 39, 229 (1979).
- Perfetti et al. (2006) L. Perfetti, P. A. Loukakos, M. Lisowski, U. Bovensiepen, H. Berger, S. Biermann, P. S. Cornaglia, A. Georges, and M. Wolf, Phys. Rev. Lett. 97, 067402 (2006).
- Perfetti et al. (2008) L. Perfetti, P. A. Loukakos, M. Lisowski, U. Bovensiepen, M. Wolf, H. Berger, S. Biermann, and A. Georges, New J. Phys. 10, 053019 (2008).
- Hellmann et al. (2010) S. Hellmann, M. Beye, C. Sohrt, T. Rohwer, F. Sorgenfrei, H. Redlin, M. Kalläne, M. Marczynski-Bühlow, F. Hennies, M. Bauer, et al., Phys. Rev. Lett. 105, 187401 (2010).
- Eichberger et al. (2010) M. Eichberger, H. Schäfer, M. Krumova, M. Beyer, J. Demsar, H. Berger, G. Moriena, G. Sciaini, and R. J. D. Miller, Nature 468, 799 (2010).
- Petersen et al. (2011) J. C. Petersen, S. Kaiser, N. Dean, A. Simoncig, H. Y. Liu, A. L. Cavalieri, C. Cacho, I. C. E. Turcu, E. Springate, F. Frassetto, et al., Phys. Rev. Lett. 107, 177402 (2011).
- Stojchevska et al. (2014) L. Stojchevska, I. Vaskivskyi, T. Mertelj, P. Kusar, D. Svetin, S. Brazovskii, and D. Mihailovic, Science 344, 177 (2014).
- Ugeda et al. (2016) M. M. Ugeda, A. J. Bradley, Y. Zhang, S. Onishi, Y. Chen, W. Ruan, C. Ojeda-Aristizabal, H. Ryu, M. T. Edmonds, H.-Z. Tsai, et al., Nature Phys. 12, 92 (2016).
- Sanders et al. (2016) C. E. Sanders, M. Dendzik, A. S. Ngankeu, A. Eich, A. Bruix, M. Bianchi, J. A. Miwa, B. Hammer, A. A. Khajetoorians, and P. Hofmann, Phys. Rev. B 94, 081404 (2016).
- Bovet et al. (2003) M. Bovet, S. van Smaalen, H. Berger, R. Gaal, L. Forró, L. Schlapbach, and P. Aebi, Phys. Rev. B 67, 125105 (2003).
- Rossnagel et al. (2005) K. Rossnagel, E. Rotenberg, H. Koh, N. V. Smith, and L. Kipp, Phys. Rev. Lett. 95, 126403 (2005).
- Freericks et al. (2009) J. K. Freericks, H. R. Krishnamurthy, Y. Ge, A. Y. Liu, and T. Pruschke, Phys. Status Solidi B 246, 948 (2009).
- Darancet et al. (2014) P. Darancet, A. J. Millis, and C. A. Marianetti, Phys. Rev. B 90, 045134 (2014).
- Ritschel et al. (2015) T. Ritschel, J. Trinckauf, K. Koepernik, B. Buchner, M. v. Zimmermann, H. Berger, Y. I. Joe, P. Abbamonte, and J. Geck, Nature Phys. 11, 328 (2015).
- Lazar et al. (2015) P. Lazar, J. Martincová, and M. Otyepka, Phys. Rev. B 92, 224104 (2015).
- Haupt et al. (2016) K. Haupt, M. Eichberger, N. Erasmus, A. Rohwer, J. Demsar, K. Rossnagel, and H. Schwoerer, Phys. Rev. Lett. 116, 016402 (2016).
- Hoffmann et al. (2004) S. V. Hoffmann, C. Søndergaard, C. Schultz, Z. Li, and P. Hofmann, Nucl. Instrum. Methods Phys. Res., Sect. A 523, 441 (2004).
- (20) See Supplemental Material for details of the evaluation using free electron finals states and for alternative plots of the photoemission intensity.
- Pillo et al. (1999) T. Pillo, J. Hayoz, H. Berger, M. Grioni, L. Schlapbach, and P. Aebi, Phys. Rev. Lett. 83, 3494 (1999).
- Arita et al. (2004) M. Arita, H. Negishi, K. Shimada, F. Xu, A. Ino, Y. Takeda, K. Yamazaki, A. Kimura, S. Qiao, S. Negishi, et al., Physica B: Condensed Matter 351, 265 (2004).
- Bovet et al. (2004) M. Bovet, D. Popović, F. Clerc, C. Koitzsch, U. Probst, E. Bucher, H. Berger, D. Naumović, and P. Aebi, Phys. Rev. B 69, 125117+ (2004).
- Perfetti et al. (2005) L. Perfetti, T. A. Gloor, F. Mila, H. Berger, and M. Grioni, Phys. Rev. B 71, 153101+ (2005).
- Clerc et al. (2006) F. Clerc, C. Battaglia, M. Bovet, L. Despont, C. Monney, H. Cercellier, M. G. Garnier, P. Aebi, H. Berger, and L. Forró, Phys. Rev. B 74, 155114 (2006).
- Mattheiss (1973) L. F. Mattheiss, Phys. Rev. B 8, 3719 (1973).
- Manzke et al. (1988) R. Manzke, O. Anderson, and M. Skibowski, Journal of Physics C: Solid State Physics 21, 2399 (1988).
- Wilson and Yoffe (1969) J. A. Wilson and A. D. Yoffe, Adv. Phys. 18, 193 (1969).
- Plummer and Eberhardt (1982) E. W. Plummer and W. Eberhardt, Adv. Chem. Phys. 49, 533 (1982).
- Tanda et al. (1984) S. Tanda, T. Sambongi, T. Tani, and S. Tanaka, Journal of the Physical Society of Japan 53, 476 (1984).
- Nakanishi and Shiba (1984) K. Nakanishi and H. Shiba, J. Phys. Soc. Jpn. 53, 1103 (1984).
- Ishiguro and Sato (1991) T. Ishiguro and H. Sato, Phys. Rev. B 44, 2046 (1991).
- Rossnagel and Smith (2006) K. Rossnagel and N. V. Smith, Phys. Rev. B 73, 073106 (2006).
- Di Salvo and Graebner (1977) F. Di Salvo and J. Graebner, Solid State Commun. 23, 825 (1977).
- Hambourger and di Salvo (1980) P. Hambourger and F. di Salvo, Physica B+C 99, 173 (1980).