Discovery of a rapid, luminous nova in NGC 300 by the KMTNet Supernova Program
Abstract
We present the discovery of a rapidly evolving transient by the Korean Microlensing Telescope Network Supernova Program (KSP). KSP is a novel high-cadence supernova survey that offers deep ( mag in bands) nearly continuous wide-field monitoring for the discovery of early and/or fast optical transients. KSP-OT-201509a, reported here, was discovered on 2015 September 27 during the KSP commissioning run in the direction of the nearby galaxy NGC 300, and stayed above detection limit for 22 days. We use our light-curves to constrain the ascent rate, mag day-1 in , decay time scale, days, and peak absolute magnitude, mag. We also find evidence for a short-lived pre-maximum halt in all bands. . We discuss constraints on the nature of the progenitor and its environment using archival HST/ACS images and conclude with a broad discussion on the nature of the system.
1 Introduction
Over the past few years, wide-field variability surveys have significantly advanced our understanding of high-energy transients, from thermonuclear runaways and various types of supernovae (SNe) (e.g. Rau et al., 2009, and references therein), to ray (Ackermann et al., 2013) and fast radio bursts (Thornton et al., 2013).
In the optical regime, contemporary experiments are typically sensitive to two types of explosive phenomena: “local” optical transients (OTs) with small peak luminosities ( mag), such as classical and dwarf novae, and luminous OTs with mag (e.g. Chornock et al., 2013; Rau et al., 2009; Law et al., 2009, and references therein). The intermediate luminosity regime, which is as of yet poorly explored, is thought to be populated by rare cosmic explosions, such as rapid under-luminous SNe (Drout et al., 2013), accretion-induced collapse of white dwarfs (WDs; Nomoto & Kondo, 1991; Metzger et al., 2009), fallback SNe (Dexter & Kasen, 2013), electromagnetic counterparts to compact-object mergers (Berger et al., 2013), and orphan short-GRB afterglows (Totani & Panaitescu, 2002).
Exploring this parameter space is challenging for two reasons: first, our limited understanding of the underlying physical mechanisms makes it difficult to predict characteristic observational signatures and the extend to which these OTs blend with novae and SNe populations. Second, because these events are expected to be both rapid and rare, identification requires sampling of a sufficiently large volume with high temporal resolution, thereby driving the need for deep high-cadence surveys.
High-cadence experiments are additionally motivated by outstanding questions in long-standing astrophysical problems. For instance, our understanding of “infant” thermonuclear runaways and SNe is limited, with questions regarding trigger mechanisms, shock break-out emission, ejecta masses, progenitor structure, and asymmetries still remaining (Smartt, 2009; Bode & Evans, 2008).
Motivated by those questions, we have secured 20% of the Korea Microlensing Telescope Network (KMTNet; Kim et al., 2016) observing time through 2020 for a dedicated survey focused on infant and/or rapidly-evolving OTs, which we call the KMTNet Supernova Program (KSP; see Moon et al., 2016). (Kim et al., 2016). KSP is capable of providing deep ( 21.5 mag111), high-cadence continuous monitoring in , and bands (Moon et al., 2016).
In this paper we present the discovery of KSP-OT-201509a, a rapidly-evolving OT found towards a spiral arm of the Sculptor galaxy NGC 300. The transient stands out for its rapid decay rate and showcases the potential of KSP for providing well-sampled multi-color light-curves of rapidly-evolving eruptions. The paper is structured as follows. In §2, we provide a brief overview of the KSP data, and present the discovery of KSP-OT-201509a, alongside its multi-color evolution. we use HST archival images to place constraints on the progenitor of KSP-OT-201509a and its environment. Finally, we explore the ramifications of our result and conclude with a brief discussion on the prospects of the KSP in nova search in §5.
2 KSP-OT-201509a: Discovery and light-curve
Between 2015 July 1 and 2016 January 10, KSP monitored a 15 deg2 area towards the Sculptor group, including a 4 deg2 field around NGC 300 ( Mpc222The numbers in the parentheses are equivalent to the 1- uncertainty at the last quoted digits.; ; Rizzi et al., 2006). We collected frames per band, with a mean cadence of 3.5 h and .
We use 60-s exposures which typically yield a limiting magnitude of 21.5 mag at S/N=5 under 12 seeing for point sources. (Lasker et al., 2008), The photon-limited astrometric precision is generally better than 05 under 12 seeing.
KSP-OT-201509a was discovered in the KSP data towards an NGC 300 spiral arm (Figure 1) as a faint, rapidly-evolving OT. The source first appeared on an band image recorded on UT 270.76333All times are defined relevant to Jan 1 2015.0 UT with an apparent magnitude of = 20.7(3) mag, at (0:55:09.422,-37:42:16.5), 3373 ( kpc) away from the centre of the galaxy.
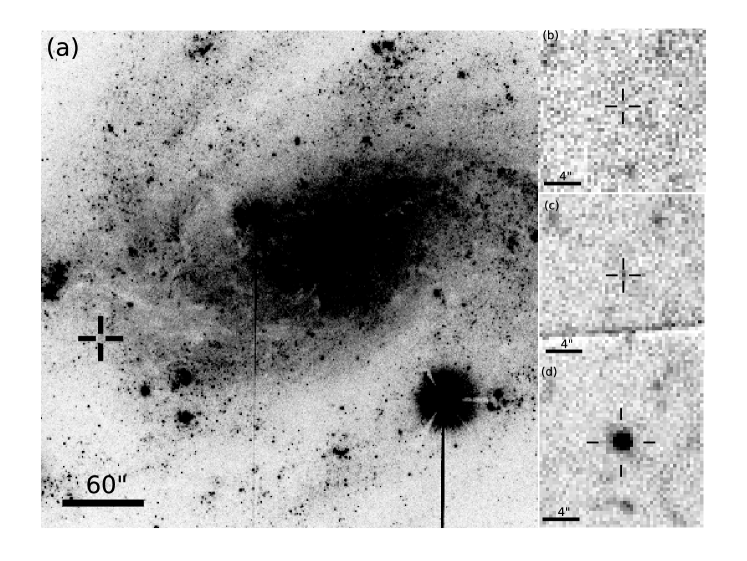
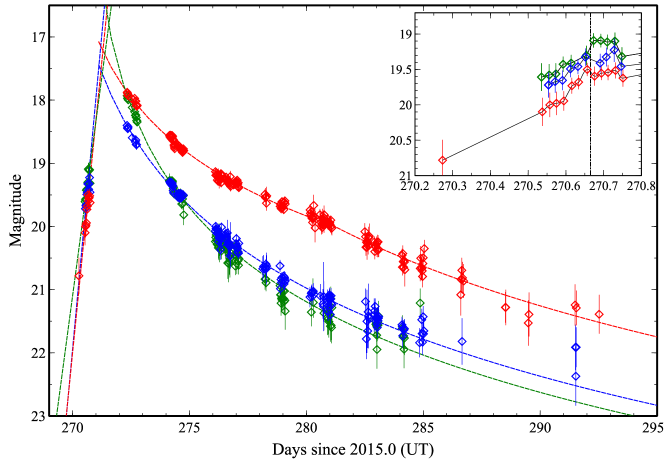
The original light-curve produced by our automated pipeline was contaminated by systematics, evident by the large-scale scatter ( mag) around the dominant decay trend. For this reason we re-analysed the data using photometry of nearby stars. More specifically, we determined the local PSF by fitting a Moffat function plus a first degree polynomial for the background to 4 bright unsaturated stars within 35 of the transient. Figure 2 shows the light-curves of KSP-OT-201509a from first detection to its disappearance below the detection limit 22 days later.
2.1 Rising Phase
The initial phase of the transient (Figure 2), sampled on 10–12 instances per each filter, is characterized by a mean ascent rate of –1.9(7) mag day-1 (), –2.6(4) mag day-1 (), and –2.5(6) mag day-1 (), as determined by a linear fit to data taken prior to UT 272. However, as can be seen in Figure 2, the ascent rate seems to decrease as the transient progresses and remains practically constant in all bands after UT 270.67.
Excluding the data taken after the aforementioned time yields , and mag day-1 for the mean ascent rate in and respectively. Based on those estimates, the probability that the halt can be attributed to random noise is . Given that KSP N2015-09a re-appears brighter two nights later, we thus interpret this as evidence for a pre-maximum halt (PMH), often seen in light-curves of novae (Hillman et al., 2014).
2.2 Maximum and Decline Phase
KSP-OT-201509a was detected again on UT 272.33 at =18.39(1), shortly after the onset of its decay phase (Figure 2). An extrapolation of our best-fit models between the rising and early decline phases suggests that the peak luminosity was not missed by more than 0.6 days. We place the maximum light between 17.9–17.6 mag, 17.1–16.7 mag, and 17.5–17.2 mag in , , and band, respectively.
Assuming the transient is indeed associated with NGC 300, the former correspond to peak absolute magnitudes between and mag. We do not account for the negligible foreground extinction ( mag; Schlegel et al., 1998), nor for any reddening from NGC 300, which should be of the same order since the galaxy is viewed nearly edge-on.
The post-maximum evolution is characterized by a rapid decay (Figure 2). To quantify the decay rate, we adopt a decline law of the form , where is the time since maximum. For and we infer and respectively. In the band, the decay rate evolves from at the onset of the decay phase to after UT 279. From the best-fit light-curves and the times of maximum-light derived above we infer and days for the time required for the band light-curve to fade by 2 and 3 magnitudes, respectively.
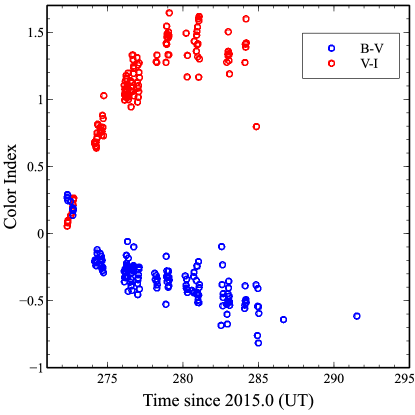
The color evolution of KSP-OT-201509a is shown in Figure 3. The decay phase starts with mag and mag. The color indexes then rapidly evolve to mag and mag in less than 1 and 4 days, respectively. Subsequently, the excess in the band grows up to mag within a few days while reverts to negative values.
3 The nature of KSP-OT-201509a
4 HST Constraints on the progenitor and environment
We analysed a set of archival HST/ACS frames towards NGC 300 obtained using the f606w and f814w filters (see Binder et al., 2015, for the original work). The images were taken on 2014 July 2 with 850 and 611 s exposure times, respectively.
We measured instrumental magnitudes and performed absolute calibration using DOLPHOT (Dolphin, 2000). Pre-determined PSF models were used to extract instrumental magnitudes which were then corrected to infinite apertures using 12 bright isolated stars within 15 from KSP-OT-201509a. We determine the photometric limit to be and mag. We used the default ACS astrometric calibration (see Anderson & King, 2006) which provides a distortion-free system to a level of 5 mas and then fitted for position offsets using the 4 common GSC sources nearest to KSP-OT-201509a.
Figure 4 shows the f606w image around KSP-OT-201509a, with 05 and 10 error circles . The star nearest to the nominal KMTNet position of the source is located at (,)J2000 = () and has and mag. The brightest point-like source within the 95% error circle has and mag, consistent with what one would expect for a super-giant at the distance of NGC 300.
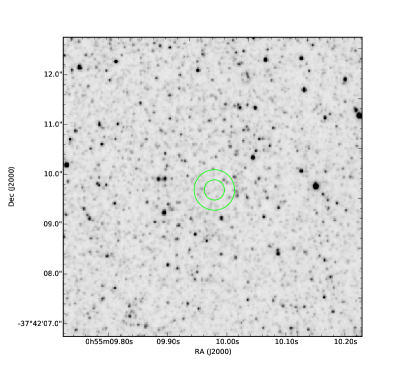
It is unlikely that either of the HST sources inside the KMTNet error box (Figure 4) is the progenitor of KSP-OT-201509a in quiescence, as one would expect for a typical main-sequence companion, which is well below the sensitivity of the HST data. The broader region, which is part of an NGC 300 spiral arm, is characterized by a large number of bright stars (with ). This indicates that KSP-OT-201509a is likely associated with a region with high star-forming activity.
5 Discussion
Nova outbursts result from thermonuclear runaway eruptions on a white dwarf (WD). They occur in a binaries of the cataclysmic-variable type, in which matter is accreted from a non-degenerate companion (e.g. Darnley et al., 2012). Material accumulating on the WD surface eventually causes the envelope to become electron degenerate, leading to a runaway thermonuclear flash which ultimately gives rise to the nova phenomenon.
It is well established, both theoretically and observationally, that nova time scales, amplitudes and repentance rates depend sensitively on the WD mass, mass-accretion rate, envelope mass, companion type and wind power (Yaron et al., 2005). With few exceptions, bright and fast novae (hereafter FNe) occur in systems with massive WDs and high mass-accretion rates between 10-8 and 10-4 M⊙ yr-1 (Prialnik & Kovetz, 1995; Yaron et al., 2005).
FNe rising phases last up to few days (e.g. Kato et al., 2009; Strope et al., 2010a). During this time, the effective temperature increases dramatically (initially at constant radius) causing the surface brightness to rise by 10–20 magnitudes. Recent studies find no strong correlation between the ascent rate and peak brightness (e.g. Cao et al., 2012), although no safe conclusions can be drawn from existing data. In addition, because of the rapid evolution time scales, very few infant FNe have been sampled with sufficient temporal cadence in multiple band to probe the underlying eruption mechanism in detail.
The work presented here provides an unprecedented multi-color view of an early FN eruption phase. We find that the brightness of KSP-OT-201509a increases at mag day-1 in , indicating a total rising-phase duration between and 5 days.
In addition, our data provide evidence for a short-lived pre-maximum halt (PMH) after UT 270.67 (Figure 2). While PMHs have been observed both in slow and fast novae (see Hounsell et al., 2010, 2016, and references therein), it is yet unclear if they reflect an intrinsic change of the WD.
For instance, some early studies suggest that they may be triggered by an external condition such as a sudden enhancement of mass loss from the donor. More recent theoretical work based on detailed 1D simulations (Hillman et al., 2014) finds that PMHs are explained naturally by a decrease in the convection-transport efficiency. The rise to peak brightness continues after the opacity decreases for radiation-transport to take over at the onset of the mass-loss phase. In KSP-OT-201509a late-rise and early-decline phases (see Figures 2 and 3). This is consistent with a transition in the emission mechanism expected in the latter scenario (see below).
In the early decline phase it is expected that the continuum spectrum is dominated by free-free scattering above the optically-thick photosphere. For the idealized case of pure optically-thin thermal Bremsstrahlung, Kato et al. (2009) find a universal decay law, , which matches well the observed lignt-curve of KSP-OT-201509a (§ 2). This in turn suggests that the transient evolution depends strongly on the wind rate and velocity, and less so on the WD mass (Kato et al., 2009, and references therein). At later phases, especially after UT 276.9, the transition to a steeper -band decline rate suggests the presence of an additional thermal emission component (Hachisu & Kato, 2016) which may the formation of a dust shell.
Considering that no spectroscopic information is available for KSP-OT-201509a, we resort to other historical FNe and theoretical studies to draw further conclusions on the WD mass and the nature of the donor star as below. Examples of well-studied bright () FNe in the Galaxy include (Strope et al., 2010b) V838 Her ( day), V1500 Cyg ( days), V2275 Cyg ( days) and more recently V2491 Cyg ( days; Hounsell et al., 2016) ( days Eyres et al., 2017). Spectra from the early eruption phases for these FNe indicate terminal wind velocities of to 3000 km s-1. In almost all cases, FNe are associated with massive ( M⊙) WDs and a total wind mass-loss of few times 10-6 M⊙. Given the observational similarities between KSP-OT-201509a and these FNe, we therefore conclude that the former most likely also hosts a massive WD of M⊙.
The discovery of KSP-OT-201509a in an early phase and dense multi-color monitoring of its light-curve through its entire eruption demonstrates the potential of KSP to provide an unprecedented view of novae and related phenomena. Based on the KSP early performance and sensitivity so far, of classical novae as well as other transients, including infant and nearby SNe (Moon et al., 2016).
References
- Ackermann et al. (2013) Ackermann, M., Ajello, M., Asano, K., et al. 2013, ApJS, 209, 11
- Anderson & King (2006) Anderson, J., & King, I. R. 2006, Instrument Science Report ACS 2006-01, 34 pages, 1, 1
- Berger et al. (2013) Berger, E., Fong, W., & Chornock, R. 2013, ApJ, 774, L23
- Binder et al. (2015) Binder, B., Gross, J., Williams, B. F., & Simons, D. 2015, MNRAS, 451, 4471
- Bode & Evans (2008) Bode, M. F., & Evans, A. 2008, Classical Novae
- Bohlin (2016) Bohlin, R. C. 2016, AJ, 152, 60
- Cao et al. (2012) Cao, Y., Kasliwal, M. M., Neill, J. D., et al. 2012, ApJ, 752, 133
- Chornock et al. (2013) Chornock, R., Berger, E., Rest, A., et al. 2013, ApJ, 767, 162
- Darnley et al. (2012) Darnley, M. J., Ribeiro, V. A. R. M., Bode, M. F., Hounsell, R. A., & Williams, R. P. 2012, ApJ, 746, 61
- della Valle & Livio (1995) della Valle, M., & Livio, M. 1995, ApJ, 452, 704
- Dexter & Kasen (2013) Dexter, J., & Kasen, D. 2013, ApJ, 772, 30
- Dolphin (2000) Dolphin, A. E. 2000, PASP, 112, 1383
- Drout et al. (2013) Drout, M. R., Soderberg, A. M., Mazzali, P. A., et al. 2013, ApJ, 774, 58
- Eyres et al. (2017) Eyres, S. P. S., Bewsher, D., Hillman, Y., et al. 2017, MNRAS, 467, 2684
- Hachisu & Kato (2016) Hachisu, I., & Kato, M. 2016, ArXiv e-prints, arXiv:1602.01195
- Hillman et al. (2014) Hillman, Y., Prialnik, D., Kovetz, A., Shara, M. M., & Neill, J. D. 2014, MNRAS, 437, 1962
- Hounsell et al. (2010) Hounsell, R., Bode, M. F., Hick, P. P., et al. 2010, ApJ, 724, 480
- Hounsell et al. (2016) Hounsell, R., Darnley, M. J., Bode, M. F., et al. 2016, ApJ, 820, 104
- Kato et al. (2009) Kato, M., Hachisu, I., & Cassatella, A. 2009, ApJ, 704, 1676
- Kim et al. (2016) Kim, S.-L., Lee, C.-U., Park, B.-G., et al. 2016, Journal of Korean Astronomical Society, 49, 37
- Lasker et al. (2008) Lasker, B. M., Lattanzi, M. G., McLean, B. J., et al. 2008, AJ, 136, 735
- Law et al. (2009) Law, N. M., Kulkarni, S. R., Dekany, R. G., et al. 2009, PASP, 121, 1395
- Metzger et al. (2009) Metzger, B. D., Piro, A. L., Quataert, E., & Thompson, T. A. 2009, ArXiv:908.1127, arXiv:0908.1127
- Moon et al. (2016) Moon, D.-S., Kim, S. C., Lee, J.-J., et al. 2016, in SPIE Astronomical Telescopes+ Instrumentation, International Society for Optics and Photonics, 99064I–99064I
- Nomoto & Kondo (1991) Nomoto, K., & Kondo, Y. 1991, ApJ, 367, L19
- Pastorello et al. (2007) Pastorello, A., Smartt, S., Mattila, S., et al. 2007, Nature, 447, 829
- Prialnik & Kovetz (1995) Prialnik, D., & Kovetz, A. 1995, ApJ, 445, 789
- Rau et al. (2009) Rau, A., Kulkarni, S. R., Law, N. M., et al. 2009, PASP, 121, 1334
- Rizzi et al. (2006) Rizzi, L., Bresolin, F., Kudritzki, R.-P., Gieren, W., & Pietrzyński, G. 2006, ApJ, 638, 766
- Schlegel et al. (1998) Schlegel, D. J., Finkbeiner, D. P., & Davis, M. 1998, ApJ, 500, 525
- Smartt (2009) Smartt, S. J. 2009, ARA&A, 47, 63
- Strope et al. (2010a) Strope, R. J., Schaefer, B. E., & Henden, A. A. 2010a, AJ, 140, 34
- Strope et al. (2010b) —. 2010b, AJ, 140, 34
- Thornton et al. (2013) Thornton, D., Stappers, B., Bailes, M., et al. 2013, Science, 341, 53
- Totani & Panaitescu (2002) Totani, T., & Panaitescu, A. 2002, ApJ, 576, 120
- Williams et al. (2015) Williams, S. C., Darnley, M. J., Bode, M. F., & Steele, I. A. 2015, ApJ, 805, L18
- Yaron et al. (2005) Yaron, O., Prialnik, D., Shara, M. M., & Kovetz, A. 2005, ApJ, 623, 398