The impact of the LHC -boson transverse momentum data on PDF determinations
Abstract
The LHC has recently released precise measurements of the transverse momentum distribution of the -boson that provide a unique constraint on the structure of the proton. Theoretical developments now allow the prediction of these observables through next-to-next-to-leading order (NNLO) in perturbative QCD. In this work we study the impact of incorporating these latest advances into a determination of parton distribution functions (PDFs) through NNLO including the recent ATLAS and CMS 7 TeV and 8 TeV data. We investigate the consistency of these measurements in a global fit to the available data and quantify the impact of including the distributions on the PDFs. The inclusion of these new data sets significantly reduces the uncertainties on select parton distributions and the corresponding parton-parton luminosities. In particular, we find that the data ultimately leads to a reduction of the PDF uncertainty on the gluon-fusion and vector-boson fusion Higgs production cross sections by about 30%, while keeping the central values nearly unchanged.
Keywords:
QCD, PDFs, gluon, transverse momentum, resummation1 Introduction
The production of a -boson that subsequently decays into a pair of leptons is a benchmark Standard Model (SM) process at the Large Hadron Collider (LHC). Thanks to its large production rate and clean experimental signature, it can be be measured very accurately by the LHC experiments. It can also be calculated to high accuracy within the Standard Model, with the first prediction to next-to-next-to-leading order (NNLO) in the strong coupling constant appearing more than two decades ago Hamberg:1990np , and predictions for differential cross sections appearing over one decade ago Anastasiou:2003ds ; Melnikov:2006kv ; Catani:2009sm ; Gavin:2010az . This combination of precise experimental data and highly-developed theory allows this process to be used to determine quantities of fundamental importance to our understanding of high-energy phenomena, such as parton distribution functions (PDFs).
Among the many distributions in -boson production that have been measured, the transverse momentum () distribution stands out as an especially interesting one. First of all, the -boson spectrum is sensitive to the gluon and the light-quark PDFs in the not-so-well constrained intermediate Bjorken- region, which makes it a promising observable for constraining these distributions. The fact that the Higgs production cross section at the LHC is also sensitive to the same PDF combinations in the same region of Bjorken-, makes the measurement of this process of direct importance to the search for beyond-the-SM phenomena in the Higgs sector. Second, the transverse momentum spectrum of the -boson is sensitive to both soft QCD radiation (at small ) and to large electroweak (EW) Sudakov logarithms (at large ). Given that PDF fits typically rely on fixed-order perturbative QCD, it is interesting to test how well fixed-order QCD predictions can describe this data. This has direct impact on which range of data can be included into PDF fits.
The potential for measurements to provide valuable constraints on PDF determinations has been considered previously, both on general grounds Malik:2013kba ; Rolph:2015hoa , and when considering a recent measurement performed by the CMS collaboration Chatterjee:2016sxt . Both of these studies, which are based on NLO QCD, show the potential of these measurements. At the same time, they also stress the importance of including the full NNLO QCD corrections to the -boson transverse momentum distribution in order to fully exploit the constraining power of the data.
In present global PDF determinations, the gluon distribution at medium and large is primarily constrained by the inclusive-jet spectrum measurements. The full NNLO prediction for this observable has been recently calculated in the leading-color approximation Currie:2016bfm , but results have not yet been made available for all jet data sets included in PDF fits. This deficiency motivates the study of other cross sections known to NNLO for this purpose, such as the -boson spectrum, or top-pair production. For the latter, studies have appeared that explored in great detail the possibility of making use of the total cross section Beneke:2012wb ; Czakon:2013tha and more recently of the differential distribution Czakon:2016olj measurements. In particular, it was shown that differential distributions from top-pair production provide significant constraints on the large- gluon that are comparable to those obtained from inclusive jet production data.
The importance of including NNLO corrections is especially clear in the case of the -boson transverse momentum distribution given the recent experimental progress in measuring this observable. The data sets from the 7 and 8 TeV LHC runs from both ATLAS and CMS feature percent-level experimental errors, clearly requiring predictions beyond NLO in order to achieve a comparable theoretical precision.
It is our intent in this manuscript to investigate the inclusion of the data from the LHC into a global PDF fit. We perform this study in a framework based on the NNPDF3.0 global analysis Ball:2014uwa . The data sets we consider in our work are the 7 TeV measurement of the -boson by the ATLAS collaboration Aad:2014xaa , and the 8 TeV measurements from both ATLAS and CMS Aad:2015auj ; Khachatryan:2015oaa . These data sets include doubly-differential distributions in both the rapidity and invariant mass of the lepton pair coming from the -boson decay. Our theoretical predictions are based on the NNLO QCD calculation of Ref. Boughezal:2015ded . We also study the impact of including approximate NLO electroweak corrections, as described later in the text. The major findings of our study are summarized below.
-
•
The inclusion of the NNLO QCD corrections generally improves the agreement of theory with the experimental data. This conclusion is consistent with previous observations Ridder:2016nkl ; Gehrmann-DeRidder:2016jns . The simultaneous inclusion of the NLO electroweak contributions together with NNLO QCD, done here for the first time, further improves the data/theory agreement at high .
-
•
The experimental errors, particularly in the higher-luminosity 8 TeV measurements from ATLAS and CMS, have dropped to the percent level. With the data becoming so precise, a very careful accounting of both experimental and theoretical errors is needed. We observe difficulties in fitting the data without the introduction of an additional uncorrelated error in the fit. This can come from a combination of Monte Carlo integration errors on the theory calculation, residual theoretical uncertainties in the prediction, or from underestimated experimental errors. We expect this issue to become increasingly prevalent in future PDF fits as data becomes more precise.
-
•
We observe difficulties when attempting to simultaneously fit the 7 TeV and 8 TeV LHC data. The ATLAS 7 TeV data is provided only in terms of normalized distributions, while the 8 TeV measurements are also provided as absolute, unnormalized distributions. The normalization to the fiducial cross section performed for the ATLAS 7 TeV data introduces correlations between the low- bins and the GeV region to which we must restrict our fit due to the appearance of large logarithms in the low- region that require resummation. The covariance matrix provided for the whole data set then turns out to be incorrect when used for fitting a subset of the data. This prevents us from consistently including the ATLAS 7 TeV data in the fit. To validate this hypothesis, in Sec. 5.3 we perform a fit including the normalized ATLAS 8 TeV data rather than the unnormalized ones but, in analogy to what is done for the 7 TeV data, using the covariance matrix provided for the whole data set, and explore the differences in the fit results. It would be interesting to revisit this issue if the unnormalized data for the 7 TeV measurement were released or if the experimental covariance matrix for the GeV region was available. Attempting to include resummed predictions for the low- region is also possible, although this would introduce additional theoretical uncertainties.
-
•
When adding the 8 TeV LHC -boson data to the global NNPDF3.0-like fit, we observe a significant decrease of the gluon PDF uncertainty in the Bjorken- region to as well as a reduction of the uncertainty for light quarks. This leads to a reduction of the PDF uncertainty on the gluon-fusion and Vector Boson Fusion (VBF) Higgs boson cross section of 30%, while the central value prediction for both processes increases by roughly 1%.
Our manuscript is organized as follows. In Section 2 we describe the experimental measurements of that we include in our fit. We also present the baseline fits that do not include these data that we use to assess their impact. In Section 3 we discuss the details of the theoretical calculation and settings that we use in the fit. We give a comparison of theory with the data in Section 4. We discuss the agreement observed upon using NLO QCD, NNLO QCD or a combined NNLO QCD + NLO EW prediction, and also consider several different global PDF sets. Our fit to the data and several baseline fits is described in Section 5. We briefly discuss the phenomenological impact of the new fits on the Higgs cross section in Section 6. Finally, we conclude in Section 7.
2 Descriptions of the experimental data and fit settings
In this Section we first discuss the features of the available experimental measurements. We then describe the methodology and settings of our fit to the parton distribution functions including these data.
2.1 measurements from the LHC
In this work we consider the most recent differential cross section measurements of the -boson transverse momentum spectrum from ATLAS Aad:2014xaa ; Aad:2015auj and CMS Khachatryan:2015oaa , both with TeV and TeV .
The ATLAS measurement of the -boson transverse momentum spectrum at the centre-of-mass energy of =7 TeV Aad:2014xaa is performed in the and channels, using data based on an integrated luminosity of 4.7 . The results from each channel are combined for transverse momenta up to 800 GeV. The measurement is provided both inclusive in the -boson rapidity up to 2.4, and separated into three rapidity bins: , and . In order to maximize the constraints on PDFs, we include the data in the three exclusive rapidity bins in our analysis. In the experimental paper only the normalized distributions are provided. The measurement is very accurate, with statistical and systematical uncertainties below 1% in all bins up to 150 GeV and for central rapidities (), and about 3% for the largest rapidity bin.
In the ATLAS measurement at TeV Aad:2015auj , the transverse momentum distribution is based on the full 8 TeV data set, with 20.3 fb-1 of integrated luminosity. Measurements are performed in the electron-pair and muon-pair channels and then combined. Compared to the 7 TeV measurement Aad:2014xaa , this measurement has higher statistics and an improved control of experimental systematics. Measurements are performed in six invariant mass bins: four bins at low invariant mass below the -peak, one on-peak invariant mass bin, and one bin at high invariant mass above the -peak, reaching up to 150 GeV. Results for the off-peak bins are provided in one inclusive rapidity bin (), while the -peak measurement results are given both inclusive over the whole rapidity range and separated in six rapidity bins , , , , and . Again, in order to maximize the constraints on PDF, we include the on-peak exclusive rapidity bins in our analysis.
The measurement by the CMS collaboration at the center-of-mass energy TeV Khachatryan:2015oaa is performed differentially in five rapidity bins: , , , and . The analysis uses the data sample of collisions collected with the CMS detector at the LHC in 2012, which corresponds to an integrated luminosity of 19.7 fb-1. The -boson is identified via its decay to a pair of muons. We only include the measurements exclusive in the muon rapidities up to , given that the data in the highest rapidity bin display a significant incompatibility with respect to the corresponding ATLAS measurement. We leave this issue to further investigation by the experimental collaborations.
2.2 Settings for the PDF analysis
The PDF fits presented in this work are based on the NNPDF3.0 global analysis Ball:2014uwa framework. As in the NNPDF3.0 fit, both PDF evolution and DIS structure functions are evaluated in the fit using the public APFEL library Bertone:2013vaa ; Carrazza:2014gfa ; Bertone:2016lga , with heavy-quark structure functions computed in the FONLL-C general-mass variable-flavor-number scheme Forte:2010ta with pole masses and with up to =5 active flavors. The DGLAP evolution equations are solved up to NNLO using a truncated solution, and the input parametrization scale is taken to be GeV. The strong coupling is set to , in accordance with the PDG average Agashe:2014kda . The charm and bottom PDFs are generated perturbatively from light quarks and gluons and the value of the heavy-quark masses are set to GeV and GeV, corresponding to the values recommended by the Higgs Cross Section Working Group Dittmaier:2011ti . Note that these values are different from the ones used in NNPDF3.0, which were instead set to the PDG value of the masses. These values will be used in the forthcoming NNPDF3.1 release nnpdf31 . The dependence of the fit on the values of the heavy quark masses is moderate, and in particular is negligible for the observables under consideration.
In the analysis performed in this work, we consider two baseline data sets. One consists of all available HERA deep inelastic scattering (DIS) data. An important difference with respect to the NNPDF3.0 HERA-only baseline is that the HERA inclusive structure function data, which in NNPDF3.0 were separated into the HERA-II measurements from H1 and ZEUS Aaron:2012qi ; Collaboration:2010ry ; Abramowicz:2012bx , have been replaced by the HERA legacy combination Abramowicz:2015mha that has become available recently. This data is supplemented by the combined measurements of the charm production cross section Abramowicz:1900rp , and the H1 and ZEUS measurement of the bottom structure function Aaron:2009af ; Abramowicz:2014zub . The other baseline, a global one, contains all data mentioned in the paragraph above along with the other data analyzed in the NNPDF3.0 global fit: fixed-target neutral-current DIS structure functions from NMC Arneodo:1996kd ; Arneodo:1996qe , BCDMS bcdms1 ; bcdms2 , and SLAC Whitlow:1991uw ; charged-current structure functions from CHORUS inclusive neutrino DIS Onengut:2005kv and from NuTeV dimuon production data Goncharov:2001qe ; MasonPhD ; fixed-target E605 Moreno:1990sf and E866 Webb:2003ps ; Webb:2003bj ; Towell:2001nh DY production data; Tevatron collider data including the CDF Aaltonen:2010zza and D0 Abazov:2007jy rapidity distributions; and LHC collider data including ATLAS Aad:2011dm ; Aad:2013iua ; Aad:2011fp , CMS Chatrchyan:2012xt ; Chatrchyan:2013mza ; Chatrchyan:2013uja ; CMSDY and LHCb Aaij:2012vn ; Aaij:2012mda vector boson production measurements, adding up to a total of data points. A further difference from the global baseline (on top of the use of the HERA combined measurements) is that in order to ensure a consistent treatment of NNLO corrections, we exclude jet production measurements Abulencia:2007ez ; Aad:2011fc ; Chatrchyan:2012bja ; Aad:2013lpa from the global baseline data set. Only the leading color approximation has been made available at NNLO for this process Currie:2016bfm and -factors are not yet available for all data sets included in global PDF determinations.
3 Description of the theoretical calculation
For our study we have calculated the -boson transverse momentum distribution through next-to-next-to-leading order in perturbative QCD. This computation uses a recent result for the related process of -boson in association with a jet Boughezal:2015ded ; Boughezal:2016isb based on the -jettiness subtraction scheme for NNLO calculations Boughezal:2015dva ; Boughezal:2015eha ; Gaunt:2015pea . As the -boson obtains its transverse momentum through recoil against jets, these two processes are identical in perturbation theory as long as the cuts on the final-state jets are relaxed sufficiently so that the entire hadronic phase space is integrated over for the -boson values under consideration. Since at most three jets can recoil against the -boson at NNLO, we take the lower cut on the leading-jet to be less than times the lowest -boson included in our study. We have confirmed that our predictions are not sensitive to the exact choice of this jet cut. We furthermore remove completely any constraints on the pseudorapidities of final-state jets. We note that the low transverse momentum region of -boson production requires the resummation of large logarithmic corrections of the form to all orders in perturbation theory for a proper theoretical description. This resummation is not present in our fixed-order calculation. We consequently restrict our attention to the region GeV when comparing our predictions to the experimental data. In Sect. 5.3 we study the effect of raising the cut on to 50 GeV and observe that results are stable upon the choice of the cut.
We compare the theoretical predictions against both the unnormalized spectra provided by the 8 TeV ATLAS and CMS measurements, and also to the distributions normalized to the fiducial -boson production cross section provided by the 7 TeV ATLAS measurement. For the normalized distributions we compute the fiducial -boson production cross section using the -jettiness subtraction scheme as implemented in MCVM v8.0 Boughezal:2016wmq . We cross-check this result against FEWZ Melnikov:2006kv ; Gavin:2010az . For the normalized distributions we do not expand the ratio in the strong coupling constant; i.e., we compute both the numerator and denominator through relative .
We make the following choices for the electroweak input parameters in our calculation:
| (1) |
We use the electroweak renormalization scheme. All other couplings are therefore derived using the parameters above, including the electromagnetic couplings and the weak mixing angle. We choose the following dynamical scale choices for both the renormalization and factorization scales:
| (2) |
Here, denotes the invariant mass of the final-state lepton pair. We note that our calculation includes both the -boson production and decay to lepton pairs, the contribution from virtual photons, as well as all interferences. The residual theoretical uncertainty on the prediction as estimated by independently varying and around this central value is at the few-percent level.
As we will see later it is also important when describing the high- data to include the effect of electroweak perturbative corrections. The exact NLO electroweak corrections to the -boson transverse momentum spectrum, including the leptonic decay of the boson, are known in the literature Denner:2011vu ; Hollik:2015pja . However, they are not publicly available in the form of a numerical code. To account for their effect in our calculation we instead utilize the approximate expressions presented in Refs. Kuhn:2004em ; Kuhn:2005az . These include all one-loop weak corrections up to terms power-suppressed by the ratio , and additionally the leading two-loop electroweak Sudakov logarithms. These expressions are strictly valid only after inclusive integration over the final-state lepton phase space; we apply them also to the cross sections with fiducial cuts on the leptons. For the -boson peak region in 8 TeV collisions we have checked that these approximations reproduce the numerical magnitude of the exact electroweak corrections to 2% or better in the high- range where the EW effects become relevant. Since the electroweak corrections themselves do not exceed 10% for the entire region studied, this furnishes an approximation to the distributions we study that is good to the few-per-mille level or better, which is sufficient for our purposes 111The exact electroweak corrections were used in the ATLAS analysis of 8 TeV data; we thank A. Denner, S. Dittmaier, and A. Mueck for providing us with these results to cross-check our approximations. When we study normalized distributions, the NLO electroweak corrections to the fiducial -boson cross section are obtained from FEWZ Li:2012wna . To combine the electroweak and QCD corrections we assume that the two effects factorize, leading to a multiplicative combination. Denoting the differential cross sections at the -th order in the strong coupling constant relative to the LO result and the -th order in the QED coupling constant relative to the LO result as , we assume that
| (3) |
This factorization of the electroweak and QCD corrections is supported by a calculation of the dominant mixed corrections in the resonance region Dittmaier:2015rxo .
The experimental errors in the -peak region have reached an unprecedented level for a high-energy collider experiment, approaching the per-mille level over two orders of magnitude in transverse momentum. Numerous effects that were previously not relevant may now come into play, and it is worthwhile to briefly discuss the theoretical issues that arise when attempting to reach this precision. While we can not currently address these issues, they should be kept in mind when considering these data sets.
-
•
The uncalculated N3LO perturbative QCD corrections may be needed to further improve the agreement between theory and experimental data. As we will see in a later section the theoretical predictions are generally below the experimental measurements. The inclusion of the NNLO corrections greatly improves the agreement between theory and experiment, but one may expect a further increase from the N3LO corrections.
-
•
The electroweak corrections become important for GeV, reaching the percent level at this point and continuing to grow as is increased. While we assume that the electroweak and QCD corrections factorize, this assumption should be addressed, particularly in the high- region. Non-factorizing effects could conceivably affect the cross section at the percent level.
-
•
Finally, at this level of precision non-perturbative QCD effects that shift the distribution must be considered. 222We thank G. Salam for raising this issue, and for discussions.. Since the -boson transverse momentum distribution is generated by recoil against a final-state jet, there may be linear non-perturbative power correction of the form . Simple Monte Carlo estimates indicate that this could reach the half-per-cent level Gavintalk .
4 Comparison of theory with LHC data
In this Section we compare the theoretical predictions for the spectrum to the experimental measurements described in Sect. 2. We assess the impact of NNLO QCD and NLO electroweak corrections and quantify the agreement between data and theory by computing the fully-correlated for each of the experiments that we include in our analysis using as input the most recent public releases of four PDF determinations: ABMP16 Alekhin:2017kpj CT14 Dulat:2015mca , MMHT2014 Harland-Lang:2014zoa and NNPDF3.0 Ball:2014uwa .
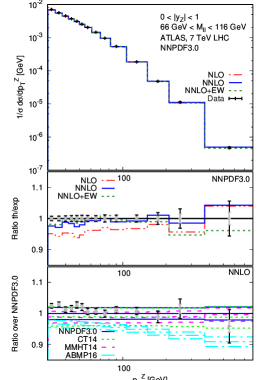
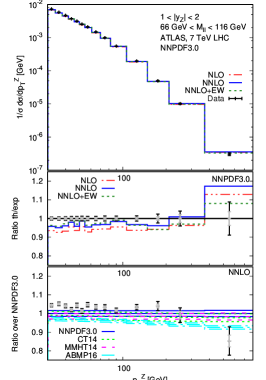
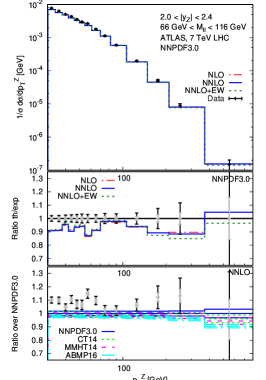
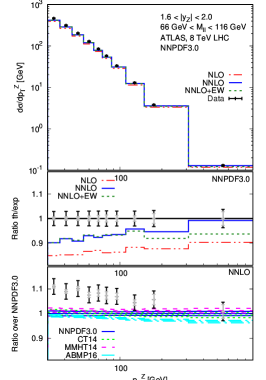
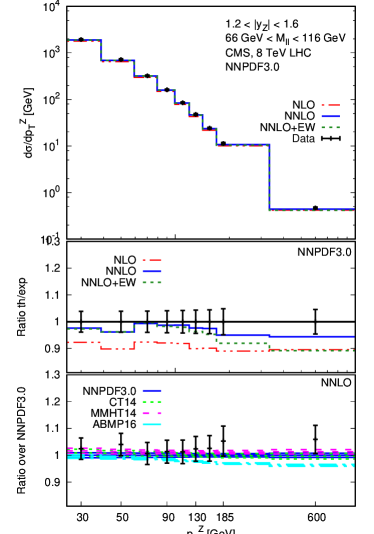
In Fig. 1 we compare the NLO and NNLO predictions to the experimental measurements performed by the 7 TeV ATLAS measurements, described in Ref. Aad:2014xaa , after imposing the additional cut of GeV discussed earlier. We also include the NLO EW corrections as described in Section 3. All three rapidity bins measured by ATLAS are shown.
| Bin | Order | (NN30) | (CT14) | (MMHT14) | (ABMP16) | |
|---|---|---|---|---|---|---|
| NLO | 14 | 10 | 21 | 9.2 | n.a. | |
| NNLO | 14 | 2.2 | 3.8 | 4.3 | 11 | |
| NNLO+EW | 14 | 1.3 | 2.3 | 2.6 | 9.1 | |
| NLO | 14 | 13 | 18 | 12 | n.a. | |
| NNLO | 14 | 5.6 | 8.2 | 9.3 | 15. | |
| NNLO+EW | 14 | 3.9 | 6.0 | 6.8 | 12. | |
| NLO | 14 | 7.0 | 7.1 | 6.0 | n.a. | |
| NNLO | 14 | 7.0 | 8.2 | 8.7 | 11. | |
| NNLO+EW | 14 | 5.9 | 7.1 | 7.5 | 9.5 | |
| All bins | NLO | 42 | 9.9 | 15 | 9.1 | n.a. |
| NNLO | 42 | 4.9 | 6.7 | 7.4 | 13. | |
| NNLO+EW | 42 | 3.7 | 5.2 | 5.6 | 12. |
We observe that the NNLO corrections significantly increase the NLO predictions, bringing them closer to the measured values of the distribution. The NNLO corrections are approximately constant as a function of . The EW corrections become significant only for the last three bins. The quantitative agreement with the theory is summarized in table 1, in which the fully-correlated is provided, for each bin separately and for the three bins together.
For MMHT2014, CT14 and NNPDF3.0 the agreement is improved for central rapidities after the inclusion of NNLO QCD corrections, with a further improvement observed upon including NLO electroweak corrections. For ABMP16 only the NNLO fit is available, so in this case we can only test that the agreement is improved upon adding electroweak corrections. In the highest rapidity bin this improvement is only observed for NNPDF3.0. The CT14 remains unchanged after including NNLO QCD+NLO electroweak, while the result for MMHT2014 becomes slightly worse. For all PDF sets the is much larger than one, indicating a poor agreement between theory and data (before the fit) even after including higher-order corrections.
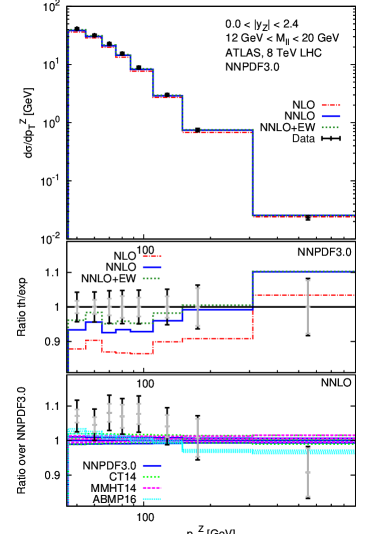
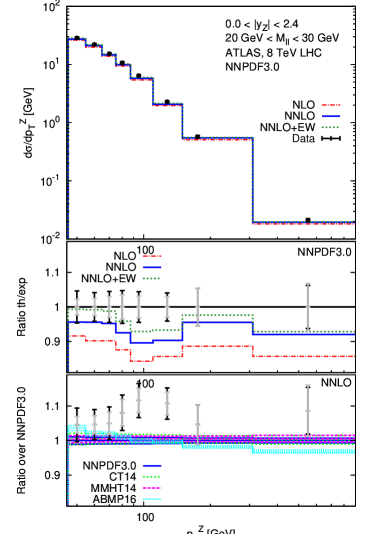
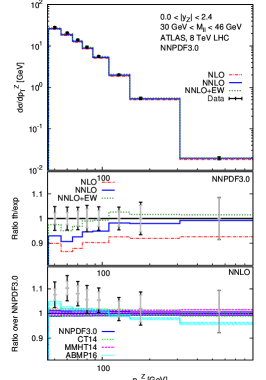
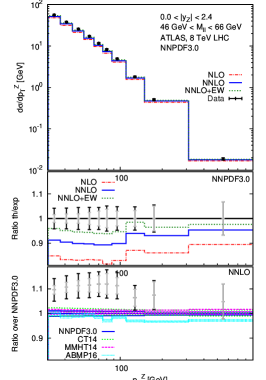
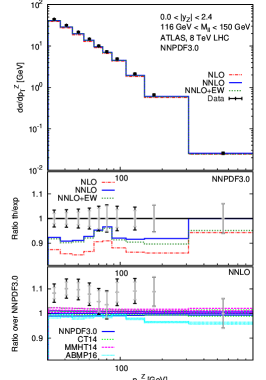
In Figs. 2 and 3 a similar comparison is performed for the off -peak bins of the 8 TeV ATLAS measurement Aad:2015auj . The NNLO QCD corrections again provide a positive shift of the NLO result that is approximately independent of , with NLO electroweak corrections causing a approximatively constant upwards (downwards) shift for the bins below (above) the -peak. While the NNLO predictions are in better agreement with the data than the NLO ones, the data are again higher than the theoretical predictions. The quantitative comparison of the NNPDF3.0, MMHT2014, CT14 and ABMP16 PDF sets using the defined previously is shown in Table 2. In all cases an improvement is seen upon inclusion of the NNLO QCD corrections, while the incorporation of the NLO electroweak corrections as well further improves the agreement in all individual bins below the peak.
| Bin | Order | (NN30) | (CT14) | (MMHT14) | (ABMP16) | |
|---|---|---|---|---|---|---|
| GeV | NLO | 8 | 2.5 | 2.2 | 1.9 | n.a. |
| NNLO | 8 | 1.7 | 1.6 | 1.7 | 1.1 | |
| NNLO+EW | 8 | 1.2 | 1.1 | 1.2 | 0.9 | |
| GeV | NLO | 8 | 2.3 | 2.6 | 2.3 | n.a |
| NNLO | 8 | 1.3 | 1.2 | 1.2 | 2.1 | |
| NNLO+EW | 8 | 1.1 | 1.1 | 1.0 | 2.1 | |
| GeV | NLO | 8 | 1.4 | 1.3 | 1.0 | n.a |
| NNLO | 8 | 1.1 | 1.0 | 1.0 | 0.7 | |
| NNLO+EW | 8 | 0.8 | 0.8 | 0.8 | 0.6 | |
| GeV | NLO | 10 | 1.9 | 1.9 | 1.5 | n.a |
| NNLO | 10 | 0.8 | 0.8 | 0.8 | 1.0 | |
| NNLO+EW | 10 | 0.4 | 0.4 | 0.4 | 0.5 | |
| GeV | NLO | 10 | 2.3 | 2.1 | 1.6 | n.a |
| NNLO | 10 | 1.2 | 1.0 | 1.0 | 1.3 | |
| NNLO+EW | 10 | 1.2 | 1.1 | 1.0 | 1.5 | |
| All bins | NLO | 44 | 1.3 | 1.2 | 1.1 | n.a |
| NNLO | 44 | 1.0 | 0.9 | 0.9 | 1.1 | |
| NNLO+EW | 44 | 1.0 | 1.0 | 1.0 | 1.4 |
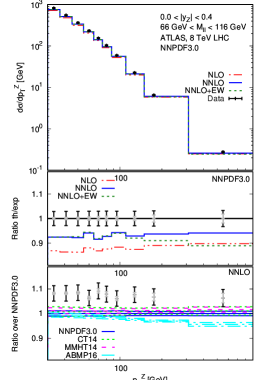
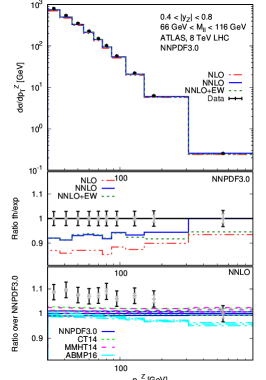
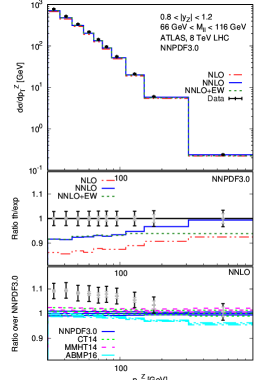
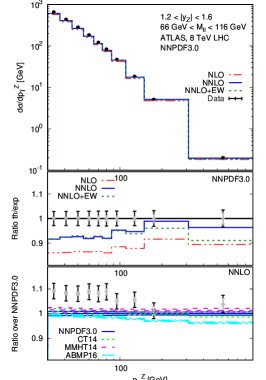
We next consider the 8 TeV ATLAS data on the -peak divided into rapidity bins. The comparisons of NLO, NNLO and NNLO+EW theory with data are shown in Figs. 4 and 5, while the results for NNPDF3.0, MMHT2014, CT14 and ABMP16 are shown in Table 3. The general trends observed in this comparison are similar to those seen in the ATLAS 7 TeV comparison and in the comparison of the invariant mass binned data: the NNLO corrections increase the NLO predictions by an amount almost independent of , bringing theory closer to data. The quantitative comparison of in Table 3 reveals that NNLO improves upon the NLO description in four of the six rapidity bins for NNPDF3.0, while NNLO+EW improves upon NLO for all six bins. For CT14 NNLO+EW improves upon NLO for five of the six bins, while for MMHT the improvement is only observed for two bins. One reason that the inclusion of the NNLO corrections does not improve the theory/data agreement as significantly as in the other data sets is because the experimental error in this case is very small, and is dominated by the correlated systematic error. Even if NNLO reduces the normalization difference between theory and experiment, remaining shape differences between the predictions and data prevent a large improvement in from being obtained. This issue will arise again when we attempt to add this data set to the PDF fit.

| Bin | Order | (NN30) | (CT14) | (MMHT14) | (ABMP16) | |
|---|---|---|---|---|---|---|
| NLO | 10 | 4.0 | 3.2 | 2.4 | n.a. | |
| NNLO | 10 | 2.7 | 2.7 | 2.6 | 2.7 | |
| NNLO+EW | 10 | 3.4 | 3.2 | 3.1 | 5.4 | |
| NLO | 10 | 5.6 | 4.6 | 3.8 | n.a. | |
| NNLO | 10 | 5.4 | 5.2 | 5.3 | 3.3 | |
| NNLO+EW | 10 | 4.0 | 3.9 | 3.7 | 3.8 | |
| NLO | 10 | 5.8 | 3.8 | 3.0 | n.a. | |
| NNLO | 10 | 4.7 | 4.0 | 4.3 | 2.1 | |
| NNLO+EW | 10 | 2.3 | 2.0 | 1.9 | 1.7 | |
| NLO | 10 | 4.5 | 3.2 | 2.5 | n.a. | |
| NNLO | 10 | 5.1 | 4.0 | 4.6 | 3.0 | |
| NNLO+EW | 10 | 3.3 | 2.6 | 2.7 | 2.5 | |
| NLO | 10 | 4.4 | 3.2 | 2.4 | n.a. | |
| NNLO | 10 | 5.4 | 4.3 | 5.0 | 3.7 | |
| NNLO+EW | 10 | 3.9 | 3.2 | 3.4 | 3.0 | |
| NLO | 10 | 4.1 | 3.2 | 2.4 | n.a. | |
| NNLO | 10 | 3.4 | 3.1 | 3.3 | 3.2 | |
| NNLO+EW | 10 | 2.6 | 2.3 | 2.4 | 2.5 | |
| All bins | NLO | 60 | 3.4 | 2.0 | 1.9 | n.a. |
| NNLO | 60 | 4.5 | 4.0 | 4.4 | 2.6 | |
| NNLO+EW | 60 | 2.9 | 2.5 | 2.7 | 2.4 |
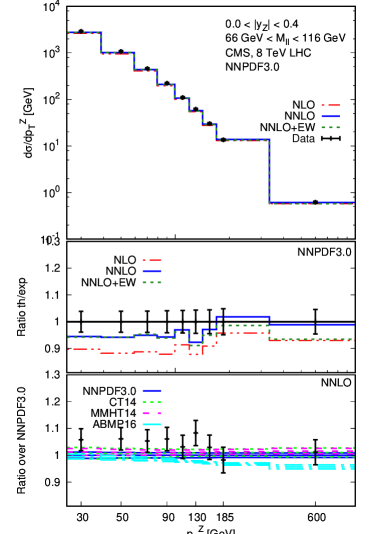
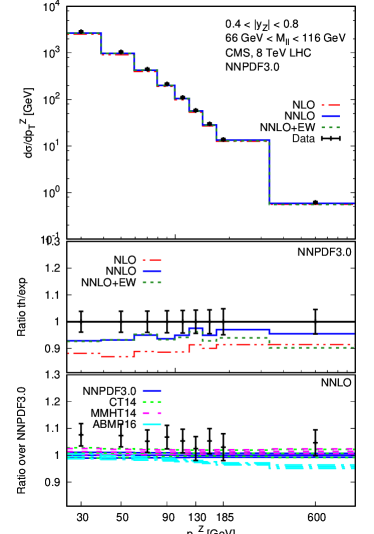
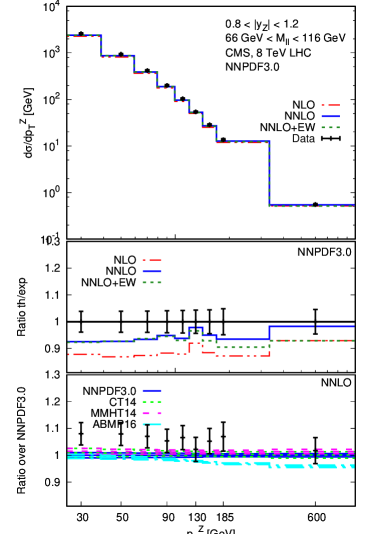
Finally, in Figs. 6 and 7, we show the comparison of the various theoretical predictions with the CMS 8 TeV data divided into rapidity bins Khachatryan:2015oaa . The is shown in Table 4. As discussed when describing the data in Sect. 2, we focus on the region . Including NNLO corrections improves the agreement between theory and data in all four rapidity bins, while adding NLO EW corrections further improves the comparison in all but the highest rapidity bins. We note that the CMS relative errors are larger than those found by ATLAS, and the issues seen in the comparison are not as pronounced as for the ATLAS 8 TeV data set. Interestingly, even though each individual rapidity bin is improved upon including NNLO, the combining all bins is slightly worsened at NNLO, again showing the impact of the correlated uncertainties when attempting to describe these very precise data sets. Fitting the data modifies the PDF shape, thus significantly improving the data description.
| Bin | Order | (NN30) | (CT14) | (MMHT14) | |
|---|---|---|---|---|---|
| GeV | NLO | 9 | 3.1 | 2.6 | 2.2 |
| NNLO | 9 | 2.2 | 2.4 | 2.3 | |
| NNLO+EW | 9 | 1.4 | 1.4 | 1.3 | |
| GeV | NLO | 9 | 2.4 | 1.9 | 1.5 |
| NNLO | 9 | 1.4 | 1.4 | 1.3 | |
| NNLO+EW | 9 | 1.9 | 1.9 | 1.7 | |
| GeV | NLO | 9 | 2.3 | 2.0 | 1.6 |
| NNLO | 9 | 1.6 | 1.4 | 1.4 | |
| NNLO+EW | 9 | 1.2 | 1.2 | 1.0 | |
| GeV | NLO | 9 | 1.6 | 2.0 | 1.9 |
| NNLO | 9 | 1.4 | 1.4 | 1.3 | |
| NNLO+EW | 9 | 2.8 | 3.1 | 2.8 | |
| All bins | NLO | 36 | 3.3 | 3.2 | 3.3 |
| NNLO | 36 | 3.5 | 3.5 | 3.7 | |
| NNLO+EW | 36 | 3.9 | 4.0 | 4.0 |
5 Inclusion of the distribution in PDF fits
In this Section we first look at the correlation between the measured distributions and the various PDF combinations, which provides a first intuition for what parton distributions and at what value of we should expect to observe the largest impact when including these data in the fit. We then add each data set separately to a DIS HERA-only fit to determine basic compatibility of different data sets and to assess the impact of including EW corrections. Finally, we perform a fit adding data to a global data set to estimate the impact of including these data in a realistic PDF determination.
5.1 Correlations between PDFs and measurements
To determine the specific PDFs and regions in for which the -boson transverse momentum distribution measurements from ATLAS and CMS provide the most stringent constraints we study the correlation coefficient as a function of (), between PDFs at a given scale and each bin of the measurements included in the present analysis. In Figure 8 we plot the correlations, computed using the SMPDF code Carrazza:2016htc , of the gluon, up-quark and down-quark distributions with the lowest invariant mass bin of the ATLAS 8 TeV measurement, and with the on-peak 8 TeV measurement of ATLAS, for the lowest rapidity bin. Each line corresponds to one bin. These are representative examples, the pattern of correlations found for the other measurements is similar. We observe a strong correlation between the gluon distribution in the region with the measurements, with the correlation coefficient reaching nearly 90%. Slightly weaker correlations of approximately 60% are found for the up-quark and down-quark distributions. These plots make it clear that these data sets have a strong potential to improve our knowledge of PDFs in the region. The largest bins are correlated to the region, thus an increase in the experimental statistics in that region would provide a stronger constraint also in the large- region.
5.2 Impact of the data on a DIS HERA-only fit
We begin by assessing the quality of a fit to the HERA DIS data upon inclusion of the available data at 8 TeV. The inclusion of the normalized ATLAS 7 TeV data is problematic and we discuss it separately in Sect. 5.3. We perform several fits that add the individual ATLAS and CMS data sets to HERA separately and in various combinations. As discussed in previous Sections we impose the following cuts on the data:
These constraints leave us with 60 data points for the ATLAS 8 TeV doubly-differential distributions in rapidity and on the -peak, 44 data points for the ATLAS 8 TeV doubly-differential distributions in the dilepton invariant mass and , and 36 data points for the CMS 8 TeV doubly-differential distributions in rapidity and on the -peak. Additionally, we consider fits using pure NNLO QCD theory and fits with NNLO QCD and NLO EW corrections combined. In the pure NNLO fits we remove the bins for which the EW corrections are larger than the sum quadrature of the statistical and uncorrelated systematic uncertainty of that data point to avoid fitting EW effects. This imposes the additional constraints
These cuts reduce the number of data points to 48 for the ATLAS 8 TeV doubly-differential distributions in rapidity and on the -peak, 44 data points for the ATLAS 8 TeV doubly-differential distributions in invariant mass and , and 28 data points for the CMS 8 TeV doubly-differential distributions in rapidity and in the -peak region.
Since we have considered numerous combinations of the available data and several different settings, we begin by summarizing the fits in Table 5. These are labelled (a)-(j). Our baseline fit with only HERA data is labelled (a). Fits (b) and (c) add individually the ATLAS 8 TeV data and CMS 8 TeV data sets. Fit (d) adds all 8 TeV data sets. A new feature we find necessary in our analysis is the inclusion of an additional uncorrelated uncertainty. This uncertainty can be due to a combination of Monte-Carlo integration uncertainties on the computationally expensive NNLO theoretical calculations, to residual theoretical uncertainties not accounted for in our fit, and to possible underestimated experimental errors. The need and approximate size of this contribution to the uncertainty can be inferred from an analysis based on modelling the NLO and NNLO theoretical predictions and their fluctuations along the lines of the one described for inclusive jet production in Carrazza:2017bjw . The addition of this new effect is needed to obtain a good in our fit, as shown later in this section. To study the stability of our fit with respect to this uncertainty we consider the values 0%, 0.5%, and 1%. Fits (b)-(d) use a 1% uncorrelated uncertainty, while fits (e)-(g) use 0.5%. This uncertainty is removed in fits (h)-(j). We will see later that the fitted PDFs are insensitive to the value of this parameter.
| (a) | (b) | (c) | (d) | (e) | (f) | (g) | (h) | (i) | (j) | |
|---|---|---|---|---|---|---|---|---|---|---|
| HERA | y | y | y | y | y | y | y | y | y | y |
| ATLAS8TEV | n | y(1%) | n | y(1%) | y(0.5%) | n | y(0.5%) | y | n | y |
| CMS8TEV | n | n | y(1%) | y(1%) | n | y(0.5%) | y(0.5%) | n | y | y |
The results of fits (a)-(j) are summarized in Table 6. For each fit the per degree of freedom () of the experiments included in the fit, and of the prediction for the observables not included in the fit (in brackets), are displayed. The additional uncorrelated uncertainty added to the fit is denoted by . We have repeated the baseline HERA-only fit (a) at the beginning of each Table section for ease of comparison. A few things are apparent from the table.
-
•
The addition of improves the description of the ATLAS 8 TeV on-peak and CMS 8 TeV data. The decreases from 1.66 to 0.77 for the ATLAS 8 TeV set and from 2.51 to 1.21 for the CMS 8 TeV set as is changed from 0% to 1% in the baseline fit. This effect is less noticeable for the invariant-mass binned ATLAS data due to the slightly larger errors for this set.
-
•
Comparing fit (b) (where only the ATLAS 8 TeV data is fit along with HERA) to fit (c) (where only the CMS 8 TeV data is fit together with HERA) shows that the ATLAS 8 TeV data is slightly more consistent with HERA than CMS. The is below one for the ATLAS sets in fit (b) after including them in the fit, while it is at 1.21 in (c) when CMS is combined with HERA.
-
•
Fit (d) shows that it is possible to obtain a reasonably good fit of ATLAS 8 TeV data, CMS 8 TeV data, and HERA with the inclusion of a additional uncorrelated uncertainty. Reducing this uncertainty to 0.5% in fit (g) leads to a noticeably worse description of the CMS data. Both the CMS and on-peak ATLAS 8 TeV data sets get a worse if is removed completely, as in fit (j).
-
•
It is clear from the table that the ATLAS 7 TeV measurement is inconsistent with the other data sets. We discuss this further in Section 5.3.
| fit id | extra | |||||
|---|---|---|---|---|---|---|
| (a) | 1% | (21.8) | (1.00) | (1.56) | (1.55) | 1.168 |
| (b) | 1% | (19.6) | 0.91 | 0.70 | (1.61) | 1.146 |
| (c) | 1% | (16.2) | (1.04) | (1.56) | 1.21 | 1.176 |
| (d) | 1% | (18.0) | 0.90 | 0.77 | 1.42 | 1.156 |
| (a) | 0.5% | (27.6) | (1.10) | (2.83) | (2.46) | 1.168 |
| (e) | 0.5% | (23.0) | 0.99 | 1.05 | (3.01) | 1.168 |
| (f) | 0.5% | (20.5) | (1.13) | (3.15) | 1.91 | 1.198 |
| (g) | 0.5% | (21.4) | 0.99 | 1.29 | 2.44 | 1.207 |
| (a) | no | (30.6) | (1.15) | (4.65) | (3.46) | 1.168 |
| (h) | no | (25.5) | 1.02 | 1.66 | (4.79) | 1.193 |
| (i) | no | (19.5) | (1.28) | (5.44) | 2.51 | 1.225 |
| (j) | no | (24.5) | 1.03 | 2.09 | 3.59 | 1.251 |
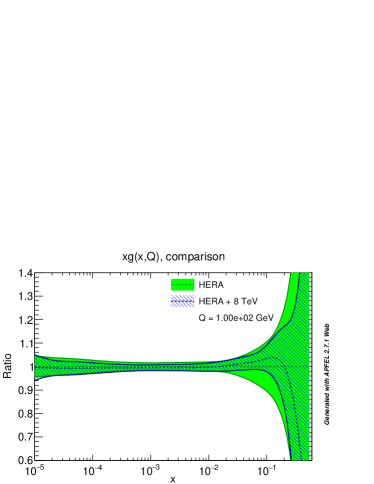
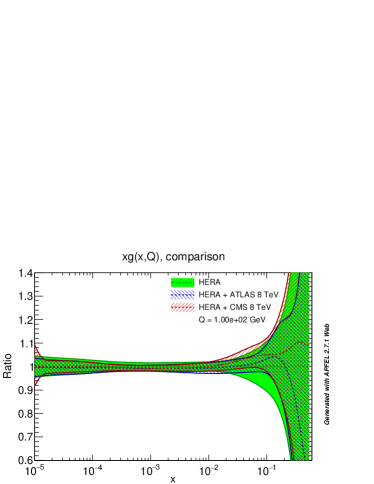
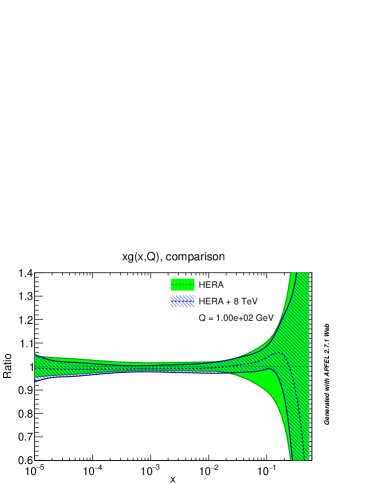
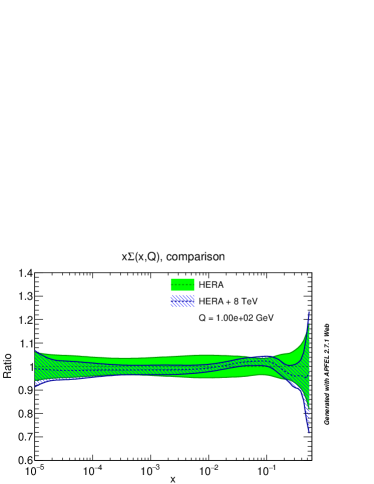
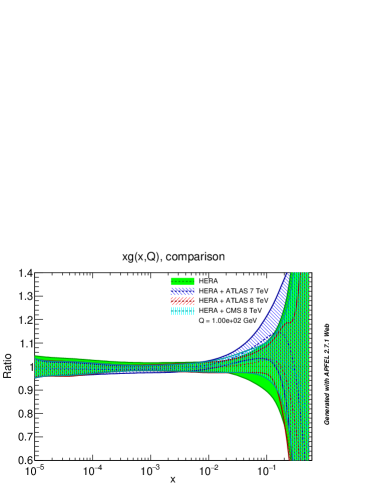
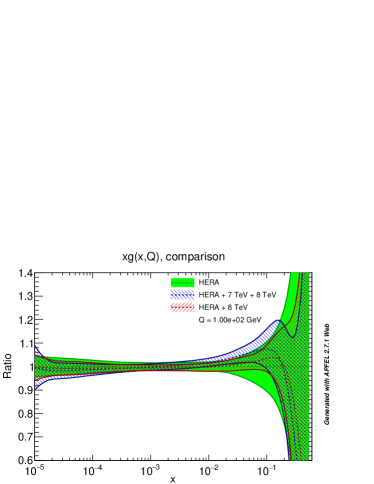
We now study the implications of these fits for the PDF sets. All plots have been done by using the on-line interface of APFEL Bertone:2013vaa . We consider the gluon and the singlet-quark combination. To avoid too large a proliferation of plots we focus on the and cases. In Fig. 9 we display the impact of the inclusion of these data on the gluon and singlet-quark PDFs by adding them with an additional uncertainty . As can be seen from the upper left panel of of Fig. 9, including either the ATLAS 8 TeV and CMS 8 TeV data sets leads to a gluon consistent with the HERA result but with a slightly smaller uncertainty. The upper right panel shows that HERA+8 TeV gives a gluon similar to HERA-only but with a significantly smaller uncertainty for .
The situation for the singlet-quark distribution is similar. However the ATLAS and CMS data seem to pull in slightly different directions, the former preferring a harder singlet in the region, as it can be observed in the lower-left panel. The lower-right panel shows that the ATLAS data have a stronger pull in the fit and that the simultaneous inclusion of the ATLAS and CMS data at 8 TeV leads to a significantly reduced uncertainty.

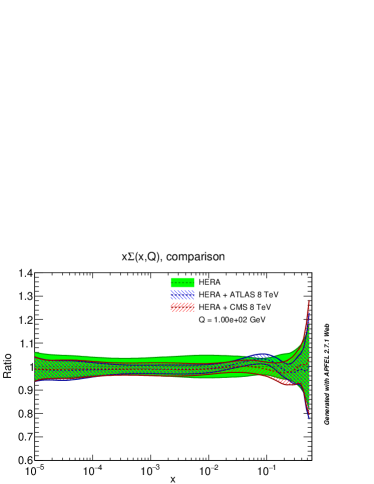

The effects of the fits on the down-quark and up-quark distributions is similar to the effect on the singlet and thus is not shown here: the PDF errors when HERA and the 8 TeV data sets are simultaneously fit decreases significantly for both the up and down distributions.
In Fig. 10 we show the results for the PDFs assuming no additional uncertainty, . The observed patterns of PDF shifts when 8 TeV data sets are included is very similar to those seen for , with only small differences in the estimated PDF errors in certain regions.

5.3 Normalized versus unnormalized distributions
In this Section we focus on the inclusion of the normalized ATLAS 7 TeV data and give details on the tension we observe with the 8 TeV data. We consider a NNLO fit, applying the following cuts
where the latter is motivated by the fact that in the last bin the EW corrections are larger than the sum in quadrature of the statistical and uncorrelated systematic uncertainties of the data. We are left then with 39 data points for the ATLAS 7 TeV distribution.
| (a) | (k) | (l) | (m) | (n) | (o) | (p) | |
|---|---|---|---|---|---|---|---|
| HERA | y | y | y | y | y | y | y |
| ATLAS7TEV | n | y(1%) | y(1%) | y(0.5%) | y(0.5%) | y | y |
| ATLAS8TEV | n | n | y(1%) | n | y(0.5%) | n | y |
| CMS8TEV | n | n | y(1%) | n | y(0.5%) | n | y |
We summarize the fits in Table 7. These are labelled (k)-(p). The baseline is the same as the one presented in the previous section. Fits (k), (m) and (o) add individually the ATLAS 7 TeV data by adding an uncorrelated uncertainty of 1%, 0.5% and none respectively. Fits (l), (n) and (p) add them along with the unnormalized ATLAS and CMS data at 8 TeV with an extra uncorrelated uncertainty of 1%, 0.5% and none respectively.
The results of fits (k)-(p) are summarized in Table 8. For each fit the per degree of freedom () of the experiments included in the fit, and of the prediction for the observables not included in the fit (in brackets), are displayed. The additional uncorrelated uncertainty added to the fit is denoted by . Again, we have repeated the baseline HERA-only fit (a) at the beginning of each Table section for ease of comparison.
| fit id | extra | |||||
|---|---|---|---|---|---|---|
| (a) | 1% | (21.8) | (1.00) | (1.56) | (1.55) | 1.168 |
| (k) | 1% | 1.39 | (1.39) | (2.04) | (1.41) | 1.176 |
| (l) | 1% | 1.64 | 1.05 | 1.17 | 1.27 | 1.171 |
| (a) | 0.5% | (27.6) | (1.10) | (2.83) | (2.46) | 1.168 |
| (m) | 0.5% | 1.58 | (1.54) | (3.36) | (2.11) | 1.186 |
| (n) | 0.5% | 2.13 | 1.18 | 1.98 | 2.21 | 1.253 |
| (a) | no | (30.6) | (1.15) | (4.65) | (3.46) | 1.168 |
| (o) | no | 1.74 | (1.69) | (4.79) | (3.06) | 1.185 |
| (p) | no | 2.35 | 1.24 | 2.81 | 3.19 | 1.301 |
A few things are apparent from the table.
-
•
The ATLAS 7 TeV data is inconsistent with the HERA-only fit, with a over 20 regardless of the chosen. A primary reason for this is that the ATLAS 7 TeV data is normalized to the fiducial cross section in each rapidity bin, while the 8 TeV data sets are unnormalized. The normalization performed for the ATLAS 7 TeV data introduces correlations between the low- bins and the GeV region to which we must restrict our fit due to the theoretical considerations discussed earlier. Due to this cut on the data the covariance matrix provided by the experiments for the whole data set cannot be used to consistently include the 7 TeV data in the fit. It would be interesting to revisit this issue if the unnormalized data became available.
-
•
Studying fits (l), (n) and (p) shows that it is hard to simultaneously fit the ATLAS 7 TeV data with the 8 TeV data sets. In table 6 we observed that fitting the 8 TeV data leads to a of 18 for the ATLAS 7 TeV data in fit (d). In table 8 we see that the of the 8 TeV data deteriorates when we attempt to include the 7 TeV too.
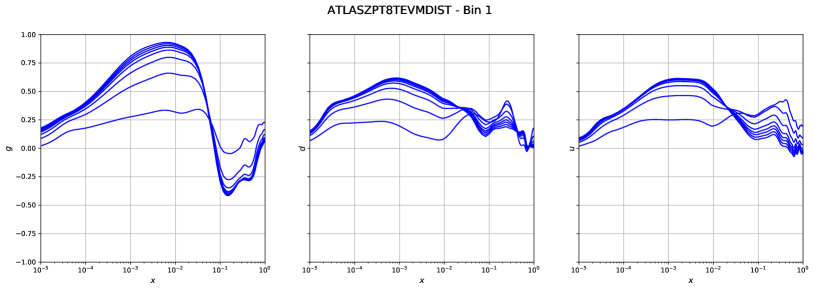
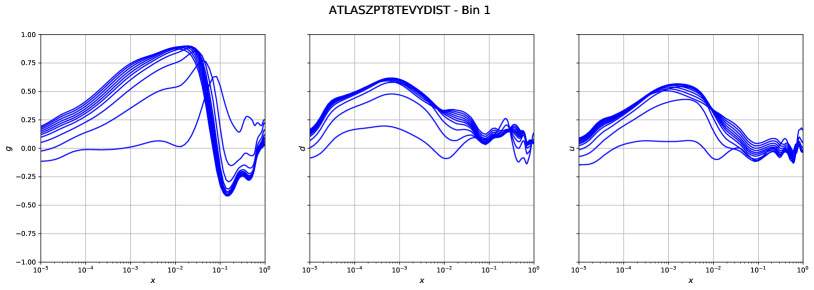
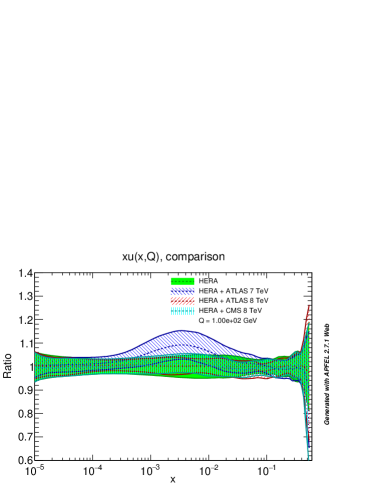
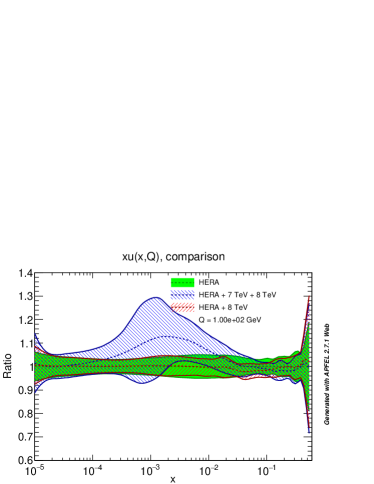
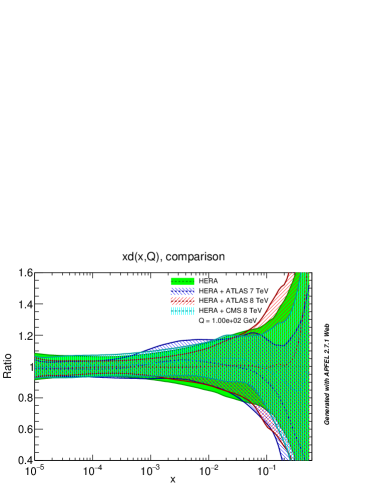
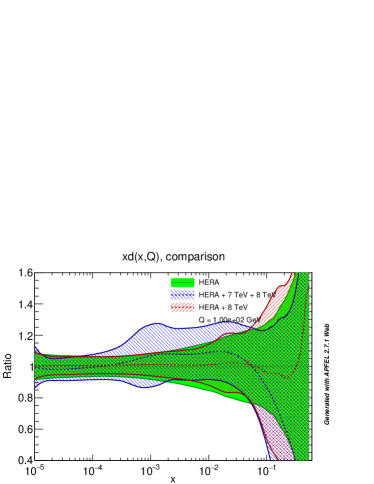
We now study the implications of these fits for the PDF sets. We consider the gluon, up-quark and down-quark distributions and focus on the case only, as we have seen that PDFs remain basically unchanged upon a reduction of . In Fig. 11 we display the impact of the inclusion of these data on the gluon, up and down quark PDFs by adding them with an additional uncertainty . An important feature of these plots is the difference between the impact of the ATLAS 7 TeV data on the gluon, compared to the impact of the 8 TeV data sets. As can be seen from the upper left panel of Fig. 11, including either the ATLAS 8 TeV and CMS 8 TeV data sets leads to a gluon consistent with the HERA result but with a slightly smaller uncertainty. Adding the ATLAS 7 TeV data leads to an increased gluon distribution for . The upper right panel shows that HERA+8 TeV gives a gluon similar to HERA-only but with a significantly smaller uncertainty for . Attempting to fit both 7 TeV and ATLAS 8 TeV data leads to an increased uncertainty, which is barely visible. The tension present between the ATLAS 7 TeV data, and the combined HERA+8 TeV data observed for the gluon PDF is also observed for the up and down distributions. The middle right panel shows that the error on the up-quark PDF is greatly increased for when we attempt to simultaneously fit all data. The reason for this can be seen from the left middle panel. The ATLAS 7 TeV data prefers a peak in the up-quark distribution at this value. In contrast, the upper right panel shows a decrease in the PDF error when HERA and the 8 TeV data sets are simultaneously fit. A similar pattern is observed for the down-quark distribution, as is shown in the lower two panels of Fig. 11.
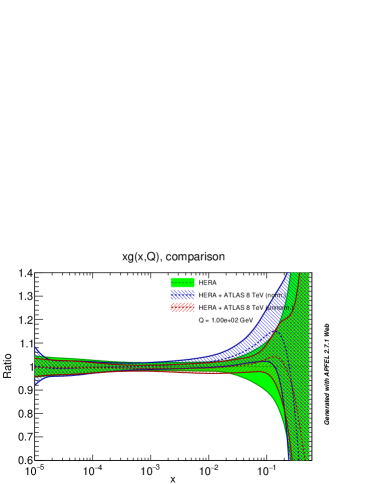
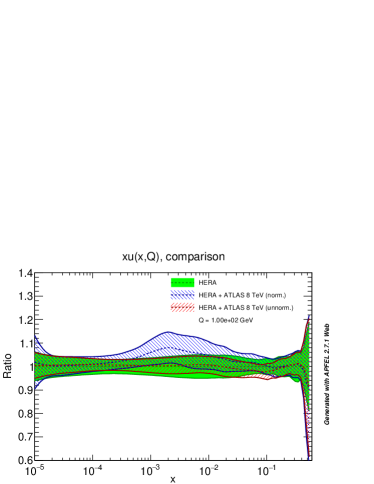
In order to confirm that the origin of the anomalous behaviour of PDFs upon the inclusion of the 7 TeV data is due to the fact that they are normalized, we perform an additional fit including the precise ATLAS 8 TeV normalized data in the -peak region in a HERA-only fit. As far as the quality of the fit is concerned, we observe that these data are harder to fit than the 7 TeV ones, as the ranges from 9 (for a fit with %) to 2.1 (for a fit with %). As far as PDFs are concerned, in Fig. 12 it is apparent that, while the inclusion of the on-peak ATLAS 8 TeV unnormalized data reduces the uncertainty of the gluon and up-quark distributions, the inclusion of the on-peak ATLAS 8 TeV normalized data inflates their uncertainties, thus pointing to their inconsistency with respect to the baseline.
5.4 Impact of NLO EW corrections
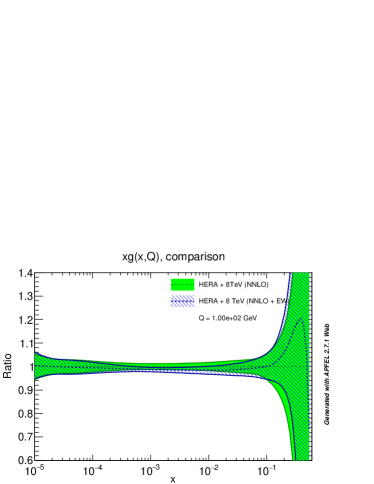
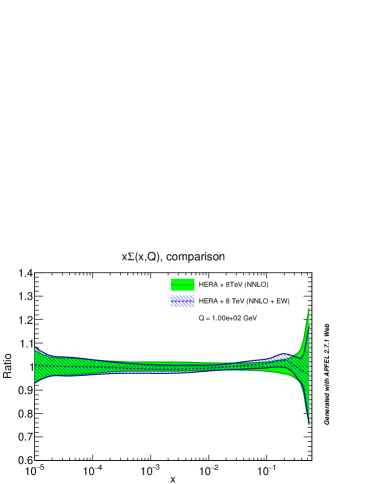
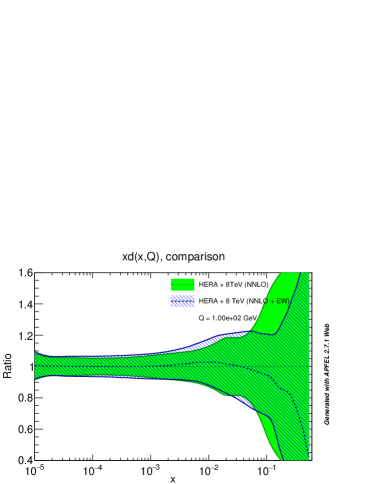
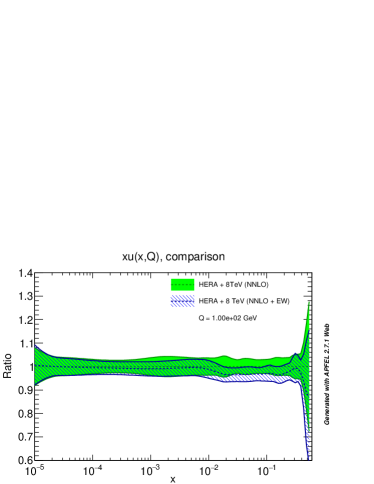
Another interesting aspect that we can investigate is the impact of electroweak corrections on the obtained PDFs. To probe this we perform fits to the HERA and 8 TeV data sets, with NNLO QCD corrections and both with and without EW corrections. We recall that in the pure NNLO QCD fit we remove bins where the EW corrections are larger than the combined uncorrelated uncertainty, as explained previously. We first display the gluon, singlet, down-quark and up-quark distributions with and without EW corrections in Fig. 13. The EW corrections have a small but noticeable effect on the PDFs, lowering both the gluon and singlet distributions in the intermediate- regions. The is shown in Table 9. The quality of the fit deteriorates slightly upon including EW corrections. This results primarily not because EW corrections worsen the agreement between theory and data, but because with EW corrections included we are able to include additional high- bins in the fit that were excluded in the pure NNLO QCD fit, and these bins are slightly more discrepant than the lower- ones. The agreement with the 7 TeV data is marginally improved upon including EW corrections, although it is still inconsistent with the HERA+8 TeV combined fit.
| fit id | extra | Theory | |||||
|---|---|---|---|---|---|---|---|
| (e) | 1% | NNLO | (18) | 0.90 | 0.77 | 1.42 | 1.156 |
| (q) | 1% | NNLO+EW | (16) | 1.00 | 0.87 | 1.72 | 1.182 |
5.5 Impact of the data on a global fit
Having investigated the impact of the LHC data in a fit consisting of only HERA data, which allowed us to consider several aspects of this new data in detail, we turn to their inclusion in a global fit of the available measurements. We follow the NNPDF3.0 analysis with the modifications explained in Section 2.2. We set the additional uncorrelated error to , and, having established that we cannot consistently include the normalized 7 TeV data in a PDF fit, we only add the unnormalized 8 TeV data to the global baseline. The results for the per degree of freedom of each fit is shown in Table 10. The of the fitted distributions reveals a mild tension between the CMS and ATLAS data sets, with of the CMS set reaching 1.32, while the ATLAS 8 TeV sets give a below one. We notice that when including the 8 TeV data the of the (not-fitted) ATLAS 7 TeV data deteriorates.
| fit | |||||
|---|---|---|---|---|---|
| NN30red | (6.93) | (0.98) | (1.06) | (1.41) | 1.17677 |
| NN30red + 8 TeV | (7.87) | 0.96 | 0.88 | 1.32 | 1.17690 |
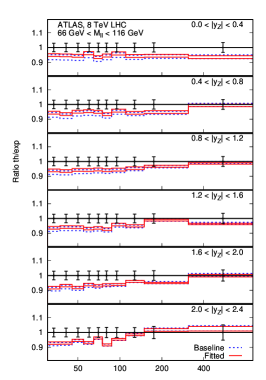
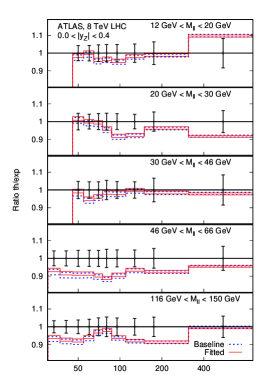
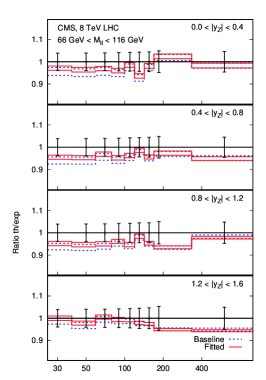
In Fig. 14 we display the agreement of the NNLO predictions and the data before and after the fit. We observe that the agreement improves and uncertainties shrink.
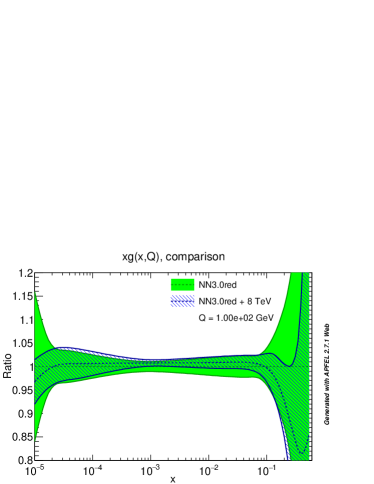
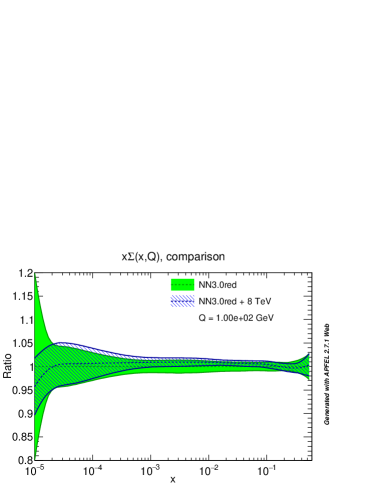
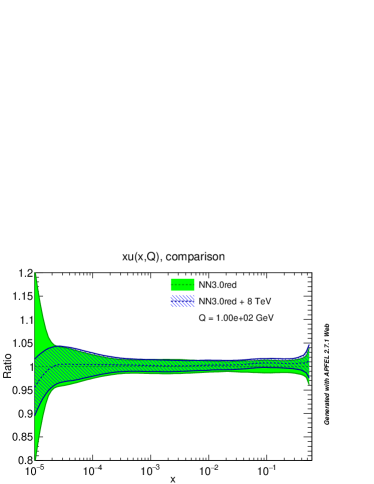
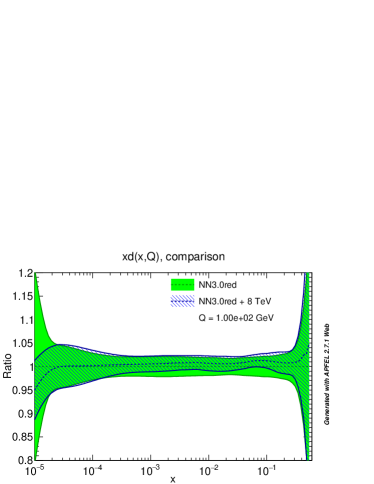
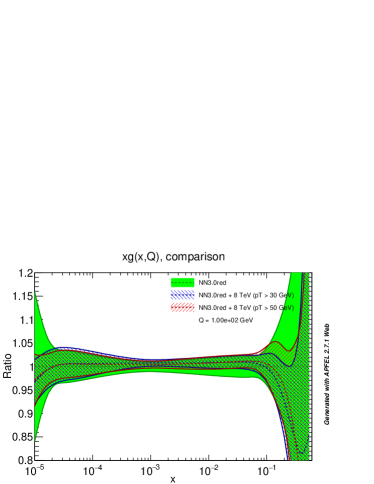
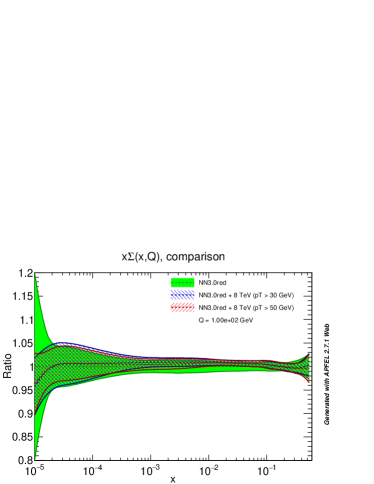
In Fig. 15 and 16 we show the impact of the precise 8 TeV data on the various PDFs determined from the global fit of the available data. The observed shifts of the PDFs are similar to those seen in the HERA-only fit. The reduction of the uncertainty is milder but still significant. The new PDFs obtained after including the 8 TeV data are consistent with those found in the baseline.
It is interesting to compare our results with those presented in Czakon:2016olj , in which a similar baseline was used and the impact of including top-pair production differential distributions in PDF fits was studied in detail for the first time. The gluon is pulled in the same direction by both data sets, thus displaying a perfect compatibility between these two complementary measurements. The inclusion of the data decreases the uncertainties on the gluon PDF more than the top-pair data in the intermediate- region between and . The impact of the top-pair data is much stronger for . This result follows the correlation patterns presented in Section 5.1 for and in Czakon:2016olj for top-quark differential distributions, from which it is clear that the latter are strongly correlated with the gluon in the large- region, while the former are mostly correlated with the gluon (and slightly less with the light-quark distributions) in the intermediate- region. Given that these two observables provide such strong and complementary constraints, we expect that their impact in a joint fit will be stronger than the impact of the jet data, which were traditionally thought to be the best probe of the gluon in the intermediate and large- regions.
To conclude, we explore the stability of our results upon increasing the cut from 30 GeV to 50 GeV. Both the gluon and singlet central values are very stable, with uncertainties that are larger when a larger cut is used. We note that the number of data points in the fit decreases from 48 to 40 for the ATLAS 8 TeV on-peak data, from 44 to 36 for the ATLAS 8 TeV off-peak data and from 28 to 24 for the CMS 8 TeV on-peak data. Thus an increase in the PDF uncertainty when the cut is raised is expected. Everything else is consistent with expectations.
6 Phenomenological implications
Having derived a new global fit of PDFs with the 8 TeV data included, it is interesting to investigate the impact of these new measurements on quantities of phenomenological interest.
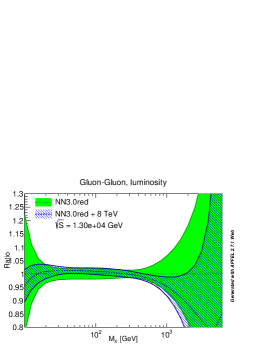
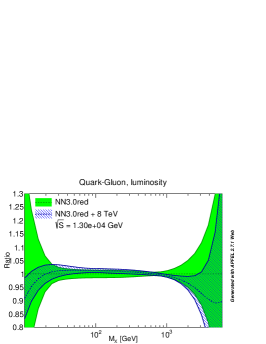
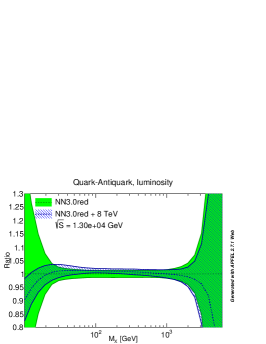
Parton luminosities directly show the impact of the inclusion of a given data set on the computation of processes. A comparison of the 13 TeV parton-parton luminosities before the data, and after including the unnormalized 8 TeV data, is presented in Fig. 18. The uncertainties significantly decrease in all three luminosities, while their central values remain nearly the same as before.
Furthermore, we present below the 13 TeV predictions for both the gluon-fusion Higgs production cross section and the VBF Higgs production cross section before and after the inclusion of the data in our global baseline fit. For the gluon-fusion production cross section we set GeV and and use the code ggHiggs v3.5 Bonvini:2016frm to compute the result through N3LO in QCD perturbation theory Anastasiou:2016cez . The result below includes no charm or bottom quarks running in the loop, and no quark mass effects beyond leading order. The impact on the Higgs production cross section uncertainties is significant. The error on the gluon-fusion production cross section is reduced by 30%, following the corresponding improvement in the gluon-gluon-luminosity observed in Fig. 18. The central value is increased by only 1%, indicating consistency with the cross section obtained using the previous global fit. For Higgs production in Vector Boson Fusion we compute the total cross section to N3LO in QCD using the proVBFH-inclusive code provbfh based on the computation presented in Cacciari:2015jma ; Dreyer:2016oyx .
| Before data | After data | |
|---|---|---|
| [pb] | (1.8%) | (1.3%) |
| [pb] | (1.5%) | (1.0%) |
7 Conclusions
In this manuscript we have included for the first time the precision measurements from the LHC into a global fit of parton distribution functions to next-to-next-to-leading order in QCD. This result is made possible by the recent theoretical predictions of this process to the necessary order. We have performed a detailed study of the impact of various perturbative corrections, including higher-order QCD and electroweak corrections, on the agreement between theory and data. To asses in detail the impact of these new data we have tested the effect of adding them to several baseline fits, including a DIS HERA-only PDF determination and a global fit with settings closely following those of NNPDF3.0.
The major findings of our study are summarized below. In their current form the normalized ATLAS 7 TeV data cannot be fit simultaneously with the 8 TeV data. It also cannot be fit together with HERA data, nor in a global fit. The normalization performed on the 7 TeV data ties together the low and high regions. When we perform the fit on the high region needed for a stable fixed-order QCD prediction, thus on a region in which is different from the one used to normalise the data, the correlations between the bins are lost. The inclusion of this data requires either the experimental covariance matrix for the GeV range only, the unnormalized data, or the inclusion of low- resummation in the theoretical prediction. This last option would introduce an additional theoretical uncertainty into the fit.
The extreme precision of the 8 TeV data binned in rapidity, with uncertainties at the few-per-mille level for the majority of bins, necessitates the introduction of an additional uncorrelated uncertainty for a fit with a low per degree of freedom. This additional parameter is meant to cover the residual theoretical uncertainty and the Monte-Carlo integration uncertainty on the theoretical prediction, as well as possible under-reported experimental errors. While the introduction of this extra uncertainty improves the per degree of freedom of the fit, we have varied the chosen value of this parameter to check that it has little impact on the actual PDFs obtained from the fit.
Including the 8 TeV data into a global fit based on the NNPDF3.0 settings results in a significant reduction of the 13 TeV gluon-gluon, quark-gluon and quark-antiquark luminosity errors. To quantify this we have computed the gluon-fusion Higgs production using our NNPDF3.0 baseline, before and after including the data in the fit. We find that the PDF uncertainty on the Higgs cross section decreases by 30%, while the central value of the prediction increases by 1%, within the previously-estimated uncertainty. We caution that this quantitative estimate of uncertainty reduction holds upon including only the data into the NNPDF3.0 baseline fit. If additional data sets are included as well, these numbers will change. However, given the power of the data found in our study, we expect that future global fits using this data will observe similar results.
Acknowledgements
We thank Jan Kretzschmar, Maarten Boonekamp and Stefano Camarda for insightful discussions on the ATLAS experimental data. We thank Gavin Salam for discussions on possible non-perturbative corrections to the distribution, and Alexander Mueck for sending results for the NLO electroweak corrections. We thank Alex Mitov for useful discussions on the comparison with the inclusion of top data. We acknowledge extensive discussions and cross checks of results and PDF fits with the members of the NNPDF Collaboration, in particular Zahari Dim, Luca Rottoli, Stefano Carrazza, Nathan Hartland and Juan Rojo. We thank the Kavli Institute for Theoretical Physics in Santa Barbara for hosting the authors during the completion of this manuscript. This research was supported in part by the National Science Foundation under Grant No. NSF PHY11-25915 to the Kavli Institute of Theoretical Physics in Santa Barbara. R. B. is supported by the DOE contract DE-AC02-06CH11357. F. P. is supported by the DOE grants DE-FG02- 91ER40684 and DE-AC02-06CH11357. M. U. is supported by a Royal Society Dorothy Hodgkin Research Fellowship and partially supported by the STFC grant ST/L000385/1. A. G. is supported by the European Union s Horizon 2020 research and innovation programme under the Marie Skłodowska-Curie grant agreement No 659128 - NEXTGENPDF. This research used resources of the Argonne Leadership Computing Facility, which is a DOE Office of Science User Facility supported under Contract DE-AC02-06CH11357.
References
- (1) R. Hamberg, W. L. van Neerven, and T. Matsuura, A complete calculation of the order correction to the Drell-Yan factor, Nucl. Phys. B359 (1991) 343–405. [Erratum: Nucl. Phys.B644,403(2002)].
- (2) C. Anastasiou, L. J. Dixon, K. Melnikov, and F. Petriello, High precision QCD at hadron colliders: Electroweak gauge boson rapidity distributions at NNLO, Phys. Rev. D69 (2004) 094008, [hep-ph/0312266].
- (3) K. Melnikov and F. Petriello, Electroweak gauge boson production at hadron colliders through O(alpha(s)**2), Phys. Rev. D74 (2006) 114017, [hep-ph/0609070].
- (4) S. Catani, L. Cieri, G. Ferrera, D. de Florian, and M. Grazzini, Vector boson production at hadron colliders: a fully exclusive QCD calculation at NNLO, Phys. Rev. Lett. 103 (2009) 082001, [arXiv:0903.2120].
- (5) R. Gavin, Y. Li, F. Petriello, and S. Quackenbush, FEWZ 2.0: A code for hadronic Z production at next-to-next-to-leading order, Comput. Phys. Commun. 182 (2011) 2388–2403, [arXiv:1011.3540].
- (6) S. A. Malik and G. Watt, Ratios of W and Z Cross Sections at Large Boson as a Constraint on PDFs and Background to New Physics, JHEP 02 (2014) 025, [arXiv:1304.2424].
- (7) A. Rolph and M. Ubiali, PDFs and LHC data: current and future constraints, EPJ Web Conf. 90 (2015) 07001.
- (8) R. M. Chatterjee, M. Guchait, and R. Placakyte, QCD analysis of the CMS inclusive differential production data at 8??TeV, Phys. Rev. D94 (2016), no. 3 034035, [arXiv:1603.09619].
- (9) J. Currie, E. W. N. Glover, and J. Pires, NNLO QCD predictions for single jet inclusive production at the LHC, Phys. Rev. Lett. 118 (2017), no. 7 072002, [arXiv:1611.01460].
- (10) M. Beneke, P. Falgari, S. Klein, J. Piclum, C. Schwinn, M. Ubiali, and F. Yan, Inclusive Top-Pair Production Phenomenology with TOPIXS, JHEP 07 (2012) 194, [arXiv:1206.2454].
- (11) M. Czakon, M. L. Mangano, A. Mitov, and J. Rojo, Constraints on the gluon PDF from top quark pair production at hadron colliders, JHEP 07 (2013) 167, [arXiv:1303.7215].
- (12) M. Czakon, N. P. Hartland, A. Mitov, E. R. Nocera, and J. Rojo, Pinning down the large-x gluon with NNLO top-quark pair differential distributions, JHEP 04 (2017) 044, [arXiv:1611.08609].
- (13) NNPDF Collaboration, R. D. Ball et al., Parton distributions for the LHC Run II, JHEP 04 (2015) 040, [arXiv:1410.8849].
- (14) ATLAS Collaboration, G. Aad et al., Measurement of the boson transverse momentum distribution in collisions at = 7 TeV with the ATLAS detector, JHEP 09 (2014) 145, [arXiv:1406.3660].
- (15) ATLAS Collaboration, G. Aad et al., Measurement of the transverse momentum and distributions of Drell-Yan lepton pairs in proto-proton collisions at TeV with the ATLAS detector, Eur. Phys. J. C76 (2016), no. 5 291, [arXiv:1512.02192].
- (16) CMS Collaboration, V. Khachatryan et al., Measurement of the Z boson differential cross section in transverse momentum and rapidity in proton-proton collisions at 8 TeV, Phys. Lett. B749 (2015) 187–209, [arXiv:1504.03511].
- (17) R. Boughezal, J. M. Campbell, R. K. Ellis, C. Focke, W. T. Giele, X. Liu, and F. Petriello, Z-boson production in association with a jet at next-to-next-to-leading order in perturbative QCD, Phys. Rev. Lett. 116 (2016), no. 15 152001, [arXiv:1512.01291].
- (18) A. Gehrmann-De Ridder, T. Gehrmann, E. W. N. Glover, A. Huss, and T. A. Morgan, The NNLO QCD corrections to Z boson production at large transverse momentum, JHEP 07 (2016) 133, [arXiv:1605.04295].
- (19) A. Gehrmann-De Ridder, T. Gehrmann, E. W. N. Glover, A. Huss, and T. A. Morgan, NNLO QCD corrections for Drell-Yan and observables at the LHC, JHEP 11 (2016) 094, [arXiv:1610.01843].
- (20) V. Bertone, S. Carrazza, and J. Rojo, APFEL: A PDF Evolution Library with QED corrections, Comput. Phys. Commun. 185 (2014) 1647–1668, [arXiv:1310.1394].
- (21) S. Carrazza, A. Ferrara, D. Palazzo, and J. Rojo, APFEL Web, J. Phys. G42 (2015), no. 5 057001, [arXiv:1410.5456].
- (22) V. Bertone, S. Carrazza, and N. P. Hartland, APFELgrid: a high performance tool for parton density determinations, arXiv:1605.02070.
- (23) S. Forte, E. Laenen, P. Nason, and J. Rojo, Heavy quarks in deep-inelastic scattering, Nucl. Phys. B834 (2010) 116–162, [arXiv:1001.2312].
- (24) Particle Data Group Collaboration, K. A. Olive et al., Review of Particle Physics, Chin. Phys. C38 (2014) 090001.
- (25) LHC Higgs Cross Section Working Group Collaboration, S. Dittmaier et al., Handbook of LHC Higgs Cross Sections: 1. Inclusive Observables, arXiv:1101.0593.
- (26) NNPDF Collaboration, R. D. Ball et al., Parton distributions from high-precision collider data, In preparation.
- (27) H1 Collaboration, F. D. Aaron et al., Inclusive Deep Inelastic Scattering at High with Longitudinally Polarised Lepton Beams at HERA, JHEP 09 (2012) 061, [arXiv:1206.7007].
- (28) H1 Collaboration, F. Aaron et al., Measurement of the Inclusive Scattering Cross Section at High Inelasticity y and of the Structure Function , Eur.Phys.J. C71 (2011) 1579, [arXiv:1012.4355].
- (29) ZEUS Collaboration, H. Abramowicz et al., Measurement of high-Q2 neutral current deep inelastic scattering cross sections with a longitudinally polarized positron beam at HERA, Phys. Rev. D87 (2013), no. 5 052014, [arXiv:1208.6138].
- (30) ZEUS, H1 Collaboration, H. Abramowicz et al., Combination of measurements of inclusive deep inelastic scattering cross sections and QCD analysis of HERA data, Eur. Phys. J. C75 (2015), no. 12 580, [arXiv:1506.06042].
- (31) ZEUS, H1 Collaboration, H. Abramowicz et al., Combination and QCD Analysis of Charm Production Cross Section Measurements in Deep-Inelastic ep Scattering at HERA, Eur. Phys. J. C73 (2013), no. 2 2311, [arXiv:1211.1182].
- (32) H1 Collaboration, F. D. Aaron et al., Measurement of the Charm and Beauty Structure Functions using the H1 Vertex Detector at HERA, Eur. Phys. J. C65 (2010) 89–109, [arXiv:0907.2643].
- (33) ZEUS Collaboration, H. Abramowicz et al., Measurement of beauty and charm production in deep inelastic scattering at HERA and measurement of the beauty-quark mass, JHEP 09 (2014) 127, [arXiv:1405.6915].
- (34) New Muon Collaboration, M. Arneodo et al., Accurate measurement of F2(d) / F2(p) and R**d - R**p, Nucl. Phys. B487 (1997) 3–26, [hep-ex/9611022].
- (35) New Muon Collaboration, M. Arneodo et al., Measurement of the proton and deuteron structure functions, F2(p) and F2(d), and of the ratio sigma-L / sigma-T, Nucl. Phys. B483 (1997) 3–43, [hep-ph/9610231].
- (36) BCDMS Collaboration, A. C. Benvenuti et al., A high statistics measurement of the proton structure functions and from deep inelastic muon scattering at high , Phys. Lett. B223 (1989) 485.
- (37) BCDMS Collaboration, A. C. Benvenuti et al., A high statistics measurement of the deuteron structure functions and from deep inelastic muon scattering at high , Phys. Lett. B237 (1990) 592.
- (38) L. W. Whitlow, E. M. Riordan, S. Dasu, S. Rock, and A. Bodek, Precise measurements of the proton and deuteron structure functions from a global analysis of the SLAC deep inelastic electron scattering cross-sections, Phys. Lett. B282 (1992) 475–482.
- (39) CHORUS Collaboration, G. Onengut et al., Measurement of nucleon structure functions in neutrino scattering, Phys. Lett. B632 (2006) 65–75.
- (40) NuTeV Collaboration, M. Goncharov et al., Precise measurement of dimuon production cross-sections in muon neutrino Fe and muon anti-neutrino Fe deep inelastic scattering at the Tevatron, Phys. Rev. D64 (2001) 112006, [hep-ex/0102049].
- (41) D. A. Mason, Measurement of the strange - antistrange asymmetry at NLO in QCD from NuTeV dimuon data, . FERMILAB-THESIS-2006-01.
- (42) G. Moreno et al., Dimuon production in proton - copper collisions at = 38.8-GeV, Phys. Rev. D43 (1991) 2815–2836.
- (43) NuSea Collaboration, J. C. Webb et al., Absolute Drell-Yan dimuon cross sections in 800-GeV/c p p and p d collisions, hep-ex/0302019.
- (44) J. C. Webb, Measurement of continuum dimuon production in 800-GeV/c proton nucleon collisions, hep-ex/0301031.
- (45) FNAL E866/NuSea Collaboration, R. S. Towell et al., Improved measurement of the anti-d/anti-u asymmetry in the nucleon sea, Phys. Rev. D64 (2001) 052002, [hep-ex/0103030].
- (46) CDF Collaboration, T. A. Aaltonen et al., Measurement of of Drell-Yan pairs in the Mass Region from Collisions at TeV, Phys. Lett. B692 (2010) 232–239, [arXiv:0908.3914].
- (47) D0 Collaboration, V. M. Abazov et al., Measurement of the shape of the boson rapidity distribution for + events produced at of 1.96-TeV, Phys. Rev. D76 (2007) 012003, [hep-ex/0702025].
- (48) ATLAS Collaboration, G. Aad et al., Measurement of the inclusive and Z/gamma cross sections in the electron and muon decay channels in collisions at TeV with the ATLAS detector, Phys. Rev. D85 (2012) 072004, [arXiv:1109.5141].
- (49) ATLAS Collaboration, G. Aad et al., Measurement of the high-mass Drell–Yan differential cross-section in pp collisions at sqrt(s)=7 TeV with the ATLAS detector, Phys. Lett. B725 (2013) 223–242, [arXiv:1305.4192].
- (50) ATLAS Collaboration, G. Aad et al., Measurement of the Transverse Momentum Distribution of Bosons in Collisions at TeV with the ATLAS Detector, Phys. Rev. D85 (2012) 012005, [arXiv:1108.6308].
- (51) CMS Collaboration, S. Chatrchyan et al., Measurement of the electron charge asymmetry in inclusive production in collisions at TeV, Phys. Rev. Lett. 109 (2012) 111806, [arXiv:1206.2598].
- (52) CMS Collaboration, S. Chatrchyan et al., Measurement of the muon charge asymmetry in inclusive production at 7 TeV and an improved determination of light parton distribution functions, Phys. Rev. D90 (2014), no. 3 032004, [arXiv:1312.6283].
- (53) CMS Collaboration, S. Chatrchyan et al., Measurement of associated W + charm production in pp collisions at = 7 TeV, JHEP 02 (2014) 013, [arXiv:1310.1138].
- (54) CMS Collaboration, S. Chatrchyan et al., Measurement of the differential and double-differential Drell-Yan cross sections in proton-proton collisions at 7 TeV, JHEP 1312 (2013) 030, [arXiv:1310.7291].
- (55) LHCb Collaboration, R. Aaij et al., Inclusive and production in the forward region at TeV, JHEP 06 (2012) 058, [arXiv:1204.1620].
- (56) LHCb Collaboration, R. Aaij et al., Measurement of the cross-section for production in collisions at TeV, JHEP 02 (2013) 106, [arXiv:1212.4620].
- (57) CDF Collaboration, A. Abulencia et al., Measurement of the Inclusive Jet Cross Section using the algorithmin Collisions at = 1.96 TeV with the CDF II Detector, Phys. Rev. D75 (2007) 092006, [hep-ex/0701051]. [Erratum: Phys. Rev.D75,119901(2007)].
- (58) ATLAS Collaboration, G. Aad et al., Measurement of inclusive jet and dijet production in collisions at TeV using the ATLAS detector, Phys. Rev. D86 (2012) 014022, [arXiv:1112.6297].
- (59) CMS Collaboration, S. Chatrchyan et al., Measurements of differential jet cross sections in proton-proton collisions at TeV with the CMS detector, Phys. Rev. D87 (2013), no. 11 112002, [arXiv:1212.6660]. [Erratum: Phys. Rev.D87,no.11,119902(2013)].
- (60) ATLAS Collaboration, G. Aad et al., Measurement of the inclusive jet cross section in pp collisions at sqrt(s)=2.76 TeV and comparison to the inclusive jet cross section at sqrt(s)=7 TeV using the ATLAS detector, Eur. Phys. J. C73 (2013), no. 8 2509, [arXiv:1304.4739].
- (61) R. Boughezal, X. Liu, and F. Petriello, Phenomenology of the Z-boson plus jet process at NNLO, Phys. Rev. D94 (2016), no. 7 074015, [arXiv:1602.08140].
- (62) R. Boughezal, C. Focke, X. Liu, and F. Petriello, -boson production in association with a jet at next-to-next-to-leading order in perturbative QCD, Phys. Rev. Lett. 115 (2015), no. 6 062002, [arXiv:1504.02131].
- (63) R. Boughezal, X. Liu, and F. Petriello, -jettiness soft function at next-to-next-to-leading order, Phys. Rev. D91 (2015), no. 9 094035, [arXiv:1504.02540].
- (64) J. Gaunt, M. Stahlhofen, F. J. Tackmann, and J. R. Walsh, N-jettiness Subtractions for NNLO QCD Calculations, JHEP 09 (2015) 058, [arXiv:1505.04794].
- (65) R. Boughezal, J. M. Campbell, R. K. Ellis, C. Focke, W. Giele, X. Liu, F. Petriello, and C. Williams, Color Singlet Production at NNLO in MCFM, arXiv:1605.08011.
- (66) A. Denner, S. Dittmaier, T. Kasprzik, and A. Muck, Electroweak corrections to dilepton + jet production at hadron colliders, JHEP 06 (2011) 069, [arXiv:1103.0914].
- (67) W. Hollik, B. A. Kniehl, E. S. Scherbakova, and O. L. Veretin, Electroweak corrections to -boson hadroproduction at finite transverse momentum, Nucl. Phys. B900 (2015) 576–602, [arXiv:1504.07574].
- (68) J. H. Kuhn, A. Kulesza, S. Pozzorini, and M. Schulze, Logarithmic electroweak corrections to hadronic Z+1 jet production at large transverse momentum, Phys. Lett. B609 (2005) 277–285, [hep-ph/0408308].
- (69) J. H. Kuhn, A. Kulesza, S. Pozzorini, and M. Schulze, One-loop weak corrections to hadronic production of Z bosons at large transverse momenta, Nucl. Phys. B727 (2005) 368–394, [hep-ph/0507178].
- (70) Y. Li and F. Petriello, Combining QCD and electroweak corrections to dilepton production in FEWZ, Phys. Rev. D86 (2012) 094034, [arXiv:1208.5967].
- (71) S. Dittmaier, A. Huss, and C. Schwinn, Dominant mixed QCD-electroweak O(s) corrections to Drell Yan processes in the resonance region, Nucl. Phys. B904 (2016) 216–252, [arXiv:1511.08016].
- (72) G. Salam, “Talk presented at the kitp workshop lhc run 2 and the precision frontier.” http://online.kitp.ucsb.edu/online/lhc16/salam/, 2016.
- (73) S. Alekhin, J. Bl mlein, S. Moch, and R. Placakyte, Parton Distribution Functions, and Heavy-Quark Masses for LHC Run II, arXiv:1701.05838.
- (74) S. Dulat, T.-J. Hou, J. Gao, M. Guzzi, J. Huston, P. Nadolsky, J. Pumplin, C. Schmidt, D. Stump, and C. P. Yuan, New parton distribution functions from a global analysis of quantum chromodynamics, Phys. Rev. D93 (2016), no. 3 033006, [arXiv:1506.07443].
- (75) L. A. Harland-Lang, A. D. Martin, P. Motylinski, and R. S. Thorne, Parton distributions in the LHC era: MMHT 2014 PDFs, Eur. Phys. J. C75 (2015), no. 5 204, [arXiv:1412.3989].
- (76) S. Carrazza, S. Forte, Z. Kassabov, and J. Rojo, Specialized minimal PDFs for optimized LHC calculations, Eur. Phys. J. C76 (2016), no. 4 205, [arXiv:1602.00005].
- (77) S. Carrazza, Modeling NNLO jet corrections with neural networks, in 23rd Cracow Epiphany Conference on Particle Theory Meets the First Data from LHC Run 2 Cracow, Poland, January 9-12, 2017, 2017. arXiv:1704.00471.
- (78) M. Bonvini, S. Marzani, C. Muselli, and L. Rottoli, On the Higgs cross section at N3LO+N3LL and its uncertainty, JHEP 08 (2016) 105, [arXiv:1603.08000].
- (79) C. Anastasiou, C. Duhr, F. Dulat, E. Furlan, T. Gehrmann, F. Herzog, A. Lazopoulos, and B. Mistlberger, High precision determination of the gluon fusion Higgs boson cross-section at the LHC, JHEP 05 (2016) 058, [arXiv:1602.00695].
- (80) F. A. Dreyer and A. Karlberg. http://provbfh.hepforge.org/.
- (81) M. Cacciari, F. A. Dreyer, A. Karlberg, G. P. Salam, and G. Zanderighi, Fully Differential Vector-Boson-Fusion Higgs Production at Next-to-Next-to-Leading Order, Phys. Rev. Lett. 115 (2015), no. 8 082002, [arXiv:1506.02660].
- (82) F. A. Dreyer and A. Karlberg, Vector-Boson Fusion Higgs Production at Three Loops in QCD, Phys. Rev. Lett. 117 (2016), no. 7 072001, [arXiv:1606.00840].