Simulation Study of Ion Diffusion in Charged Nanopores with Anchored Terminal Groups
Abstract
We present coarse-grained simulation results for enhanced ion diffusion in a charged nanopore grafted with ionomer sidechains. The pore surface is hydrophobic and its diameter is varied from 2.0 nm to 3.7 nm. The sidechains have from 2 to 16 monomers (united atom units) and contain sulfonate terminal groups. Our simulation results indicate a strong dependence of the ion diffusion along the pore axis on the pore parameters. In the case of short sidechains and large pores the ions mostly occupy the pore wall area, where their distribution is strongly disturbed by their host sulfonates. In the case of short sidechains and narrow pores, the mobility of ions is strongly affected by the structuring and polarization effects of the water molecules. In the case of long sidechains, and when the sidechain sulfonates reach the pore center, a radial charge separation occurs in the pore. Such charge separation suppresses the ion diffusion along the pore axis. An enhanced ion diffusion was found in the pores grafted with medium-size sidechains provided that the ions do not enter the central pore area, and the water is less structured around the ions and sulfonates. In this case, the 3D density of the ions has a hollow-cylinder type shape with a smooth and uninterrupted surface. We found that the maximal ion diffusion has a linear dependence on the number of sidechain monomers. It is suggested that the maximal ion diffusion along the pore axis is attained if the effective length of the sidechain extension into the pore center (measured as twice the gyration radius of the sidechain with the Flory exponent 1/4) is about 1/3 of the pore radius.
keywords:
ionomer, ion transport, molecular dynamics, charged pores1 Introduction
Over the past decade there has been a growing interest in ion transport phenomena in restricted geometries and porous networks. The development of many applications relies on a fundamental understanding of the diffusion properties of particles in cylindrical pores. For example, transport properties of the catalyst layer of polymer electrolyte fuel cells are largely regulated by the electrostatic interaction of the ion with the charges on the cylindrical pore in the Pt electrode [1, 2, 3]. The charge storage in conducting narrow nanopores relies on the voltage-controlled accumulation of ions in a narrow metallic nanopore [4, 5, 6]. Charged nanopores are used for the partitioning of ions and proteins [7, 8, 9], for electrolyte nanofiltration [10], and for ion-current rectification [11]. A charged-pore model also has been adopted as a convenient study model for water sorption [12] and structural and kinetic characteristics of ion conductivity in fuel cell ionomers [13, 14, 15], for the self-diffusion of ions in nanoporous media [16, 17], for the permeability of the ion channels to water and ions [18], and for the electro-osmotic flow of ionic solutions in charged channels [19]. Nanopores with anchored ionizable surface groups have been used for advanced membrane separations [20], for ion selectivity [21], and for the enhanced transport of proteins [22, 23]. They also serve as a model for the ion diffusion in cylindrical pores of the membrane-ionomer interface [24], and for the permeability of the ionomer pores to specific ions [25, 26].
Ongoing research on new polyelectrolyte membranes (PEM) for fuel cell applications also focuses on the ion diffusion properties of porous networks [27, 28, 29, 30]. Ionomer chains of the PEM are mostly composed of hydrophobic inert backbones grafted with pendant side chains that are terminated by anionic headgroups. When hydrated, the terminal group ions dissociate and the sulfonates self assemble into connected clusters, creating hydrophilic pathways inside the hydrophobic backbone matrix. For effective ion transport through the membrane, the PEM needs to be hydrated and swollen in order to form a connected network of hydrophilic pathways. The hydration water, however, makes the PEM vulnerable to icing, boiling and water evaporation at low and high temperatures and to loss of its elastic properties. In this sense, designing new ionomers with low water uptake and, at the same time, with acceptable ionic conductivity, is the goal of many ongoing activities in developing advanced fuel cell membranes.
One of the possible ways to proceed in this direction is the concept of a matrix-reinforced membrane, where a porous hydrophobic matrix film is impregnated with an ion-conducting ionomer. As a support material for the matrix, ceramic films of metal oxides [31, 32], silica xerogels [33], surface-modified silica films [34], polypropylene, polytetrafluoroethylene (PTFE), polycarbonate, polysulfone, and microglass fiber fleece (see Refs. [35, 36] and references therein) have been used. Matrix reinforcement improves the mechanical stability of the modified PEM against water flooding, and increases its resistance to the crossover of fuel molecules. However, the pore walls of the matrix restrict macromolecular motion of the ionomer, causing a lack of connectivity of the hydrophilic pathways. As a result, the ion diffusion rate in matrix reinforced PEMs is smaller than the diffusion in the corresponding bulk ionomers. A simple increase in the pore size will not solve this issue, because the increased connectivity of the ionomer will also increase membrane permeability to the feeding gases.
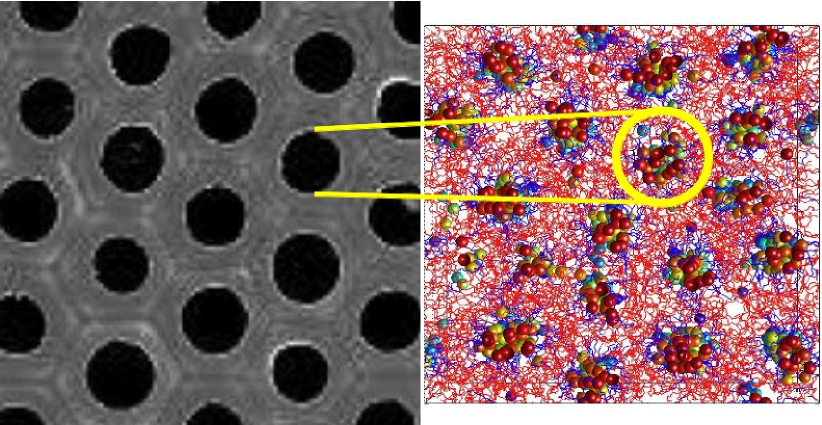
An alternative approach for the matrix reinforced ionomer might be a concept of a regular porous matrix with the pore walls grafted with pendant sidechains, as schematically illustrated in Figure 1. Here the left-side picture represents a hard-wall porous matrix with regularly ordered and parallel cylindrical pores, and the right-side picture represents a top-view snapshot of the ordered macrophase separation in a poled Nafion®-like ionomer (perfluorinated polymer from DuPont) from our previous work [37]. The ionic diffusion in such poled membranes takes place along the cylindrical sulfonate aggregates [37, 38, 39, 40]. The formation of similar parallel and inverted-micelle like cylinders in a Nafion ionomer has been reported in Ref. [41]. This finding, however, was later disputed in Refs. [42, 43] where an alternative slit geometry for the sulfonate aggregates was suggested.
In narrow pores the confinement effect of the walls suppresses the freezing point of water with respect to pure water [44, 45, 46, 47, 48, 49]. As a result, the water absorbed in the membrane tends to be in a liquid state at sub-zero temperatures. In ionomer membranes at low water contents 4.8 the confined water bonds tightly to the sulfonates and becomes strongly structured. This additionally prevents the water from freezing at low temperatures [50]. In such pores the proton transport at sub-zero temperatures probably occurs according to the Grotthuss mechanism.
In this work we consider a single pore with hydrophobic and stiff walls which represents the pores in the matrix reinforced membrane shown in Figure 1. The pore size is assumed to be in the range of 2-3.7 nm, and the pore walls are grafted with terminal groups to provide similar sulfonate aggregates as in the snapshot picture in Figure 1. The proposed single pore, in addition to being totally resistant to swelling, water flooding, and gas crossover problems, has two additional remarkable features. First, no external electric field is needed to generate continuous lanes of sulfonates. A continuous cluster network is formed self-consistently through the sulfonate-sulfonate aggregation supplemented by the hydrophobic wall-hydrophilic sulfonate and wall-water repulsive interactions [51, 52]. Second, the water content can be regulated by the pore size, the grafting density and the number of sidechain monomers. These parameters set up a non-homogeneous distribution of the ions and water molecules in the pore [51, 53, 54].
Our objective is to analyze systematically the role of the sidechain monomer number , the pore diameter , and the water content (the number of water molecules per terminal group) in getting enhanced ion diffusion along the pore axis compared to the ion diffusion in a bulk Nafion-like ionomer at the same hydration levels. We suggest that the flexibility of the sidechains and the dipolar nature of the sidechain sulfonates will greatly assist the ion transport along the pore axis, provided that the pore center is free from ion and sulfonate clusters. We report high ion diffusion coefficients for water contents 8–10 and propose a new scaling rule for the pore parameters which guarantees maximal ion diffusion along the pore axis. According to our findings, the sulfonate group protrusion length into the pore center, measured as twice the gyration radius of the sidechain with the Flory exponent 1/4, should be about 1/3 of the pore radius for securing maximal diffusion rates for the ions.
The rest of the paper is organized as follows. In section 2 we describe the main parameters of the accepted model for the pore geometry and anchored sidechains. The details of the simulation runs are given in section 3. In section 4 we consider three different sets of pore parameters for the detailed analysis of the ion diffusion in charged pores, and discuss the subsequent results. Our conclusions are presented in section 5.
2 Simulation model
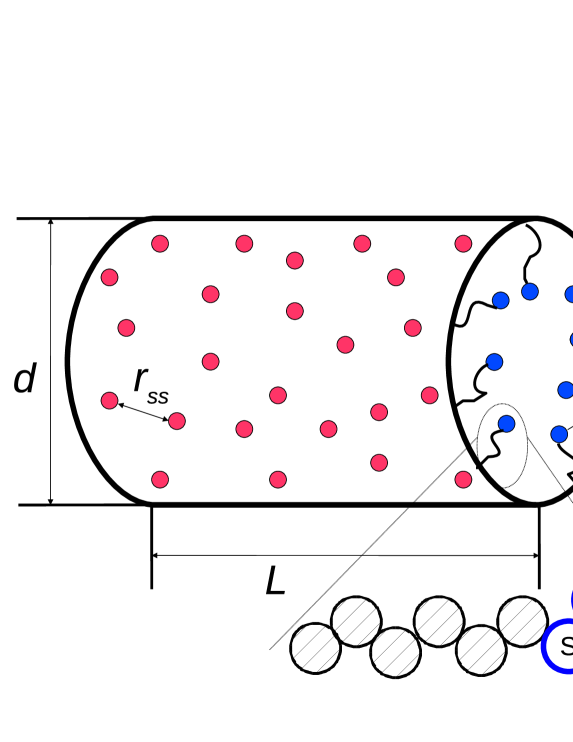
A schematic picture describing our simulation model for the pore geometry is shown in Figure 2. The inner surface of the cylindrical pore of length and diameter is randomly grafted with anchoring centers. These centers serve as the attachment points to the sidechains modeled as a spring-bead polymer chain of monomers. This number, , will be referred to hereafter as the sidechain protrusion length. A typical structure of a sidechain with =8 monomers is shown at the bottom of Figure 2. The shaded sidechain particles are hydrophobic and electrostatically neutral with zero charge, while the hydrophilic terminal group monomers at the sidechain tip, inscribed with the letters S for the sulphur atom and O3 for the oxygen group atoms, are charged. We assume for them partial charges =+1.1, and =–2.1, [39, 55] where is the electron charge. The assigned charges and depend on the fractional charge distribution along the sidechain. For the latter there are different force-field approaches [56, 57, 58, 59, 60, 61] which put the charge =–, necessary to compensate the hydronium charge =+, either entirely on the terminal group SO3, or smear it over the sidechain monomers. For example, the following terminal group charges have been considered in the literature: =+0.932 and =–1.757 [60], =+1.7 and =–2.25 [61], =+2.08 and =–2.57 [59], =+1.284 and =–1.862 [58], or =+1.0817 and =–1.852 [57]. All of these do not fully compensate the hydronium charge. The residual charge = is thus distributed between the other sidechain monomers. In Ref. [56] with =+1.19 and =–2.19, =0, and thus the hydronium charge is fully compensated by the charge of the terminal groups. In this sense, our choice for and is close to the terminal group charges adopted in Ref. [56].
In our model the total negative charge of the terminal groups SO is compensated by the positive charge of the hydronium ions modeled as spherical blobs of diameter . The pore also holds water molecules H2O which hydrate the terminal groups and liberate the ions. In bulk Nafion-like ionomers the parameter is varied between 3 and 25.
The pore geometry parameters and , and the number of grafting points define the grafting density of the sidechains =, which can be also referred to as the surface charge density of the pore. The average neighbor-to-neighbor distance between the anchoring points is
| (1) |
For short protrusion lengths with =2 monomers, when terminal groups are in the vicinity of the pore walls, the parameter essentially has the meaning of the average distance between the neighboring sulfonate groups. For Nafion-like ionomers both these quantities usually take values from 0.6 to 1.2 nm. However, for long sidechains with 3 monomers, when the sulfonate groups tend to protrude into the pore volume and form compact clusters, is defined from the position of the first maximum of the pair distribution function of sulfonates (here represents terminal group oxygens O3). In general, the smaller is, the more robust is proton hopping among neighboring sulfonate groups via intermediate water molecules. Considering that the minimal value of may not be smaller than 0.6 nm because of the electrostatic repulsion between negative SO groups, at least one water molecule should be present between neighboring sulfonate groups. This should enable accepting a proton from one sulfonate and passing it to another sulfonate [62, 63, 64, 65, 66, 67].
3 Simulation Details
We employ a coarse-grained approach for the sidechain in the framework of the united-atom representation for the CF2 groups (from the blob number 1 to the blob number -2 of the sidechain) [61, 68, 69], and for the sulphur atom S and the oxygen group O3 of sulfonates [69, 70]. All united-atom groups are modeled as Lennard-Jones (LJ) monomers with a diameter =0.35 nm and 6-12 LJ interactions among them. The sidechain constituents are additionally subjected to stretching, bending and dihedral forces. The force-field details are given in our previous work [55, 69, 71] and agree in most instances with the Nafion sidechain model of Paddison [72]. A brief description of the force field includes four components. First, the total potential energy of the sidechain polymers is
| (2) |
where are the three-dimensional position vectors of the particles in the system, the index in the two-body bond-stretching potential runs over all bonds, the index in the three-body angle-bending potential runs over all bond angles, the index in the four-body dihedral component of the interaction energy runs over all torsional angles, and indices , in the non-bonded (Lennard-Jones and Coulomb) potential run over all force-center pairs in the system. With the sidechain equilibrium bond length =0.44 and the equilibrium bond angle =110o, the fully stretched sidechain with a dihedral angle =0 has a physical length =. For the maximal number of sidechain monomers =18 we get =2.27 nm. Second, the water is modeled as a TIP3P liquid [69, 73], which has explicit charges = +0.417 on the hydrogen atom, and = -2 on the oxygen atom. The distance between hydrogen and oxygen atoms is =0.0957 nm, and the angle between OH bonds is =104.52o. The TIP3P model does not allow for inclusion of the non-classical Grotthuss transport of protons [42, 74, 75]. The ion transport in our simulation model represent a classical en-masse diffusion of ions which is affected by the dynamical rearrangement of flexible sidechains [49]. Third, standard Lorentz-Berthelot combining rules are used in the LJ interactions between monomers and such that the interaction potential between units and has a minimum at the separation distance where is defined as /2, and the depth of the interaction at this minimum is . For hydrophobic monomers =0.2 kcal/mol, and for hydrophilic monomers =0.1 kcal/mol coefficients were used in the LJ interaction potentials.
The numerical part of our study consists of three series of simulation runs. In the first series of runs, a pore with grafted sidechains is created and the system is subsequently equilibrated during runs of 1 ns at constant volume and temperature. In these runs the charges of the ions, water atoms and terminal groups were set to zero, and the equilibration was done following the hydrophobic and hydrophilic interactions in the system. In the second series of runs, the charges were turned on, and the system was equilibrated for another 1 ns of simulation time under a constant pressure condition =1 atm. The details of this procedure are explained in section 4. Finally, in the third series of runs, the necessary statistics on the sidechain conformations and the ion diffusion were gathered during the final runs of 50 ns duration.
During the production runs, the simulated system was coupled to a Langevin thermostat with a friction coefficient ps-1 and a Gaussian white-noise force of strength . The equations of motion were integrated using the velocity Verlet algorithm with a time step of 0.5 fs. One dimensional periodic boundary conditions were imposed on the system along the pore long axis, which coincides with the -axis of the system. The translational replicas of the fundamental cell pore correspond to an infinite cylindrical pore. The long-range electrostatic interactions between charged particles are handled using a one-dimensional Lekner-like summation [15, 76, 77, 78]. For simplicity, it is assumed that there is no dielectric discontinuity between the interior of the pore and the wall material. Otherwise, the interaction of the ions with their image charges will add more complexity to our simulations.
The wall-monomer interaction is treated using the particle-micropore interaction potential given by Tjatjopoulos et al. in Ref. [79], further developed in Ref. [80], and described in detail in our previous work [51]. The wall is considered smooth with no atomic structure on it [19]. The wall-ionomer interaction is hydrophobic for the hydrophobic segments of the sidechain. The wall-terminal group, wall-ion, and wall-water molecule interactions are hydrophilic.
For the dielectric constant of the pore interior we use a distance-dependent effective permittivity function similar to Refs. [51, 69]. This function gradually increases from at small monomer-monomer separations to the bulk ionomer value =4 for 1. Although the best approximation for can be a matter of debate [14, 15, 81], it is clear that the permittivity must increase with distance to account for the polarization effects of the neutral and hydrophobic parts of the sidechain when the interaction between the ions is calculated. The suggested does not overestimate the Coulomb interactions in the system when explicit water exists in the pore. All water confinement, polarization, and screening effects are explicitly taken into account in our set-up through the explicit ion-water and water-water Coulomb interactions.
4 Simulation Results
In total, there are five system parameters, namely the sidechain protrusion length monomers, the pore diameter , the water content , the pore length , and the number of grafting points on the pore surface, which fully define the pore structure. The fixing of the last two parameters, the pore length to =46 (=16 nm) and the number of grafting sites to =200, allows us to reduce the number of system variables from five to three. Subsequently, we will analyze the following three separate cases. The case A with (), the case B with (), and the case C with (), where the overlined variables will be kept constant while the two other parameters inside the parentheses will be treated as running variables. The set-up parameters for the cases A, B, and C are given in Table 1.
The pore parameters and listed in Table 1 are coupled to each other by the constant pressure condition =1.0 atm. For the one-component system in restricted geometries the pressure can be calculated using the virial theorem [52, 82]. However, this method is not efficient for multi-component systems like confined and hydrated ionomers. In these complex systems the water mostly forms hydration shells around sulfonate groups and hydronium ions where its density is about 10-20 percent higher than the bulk water [83]. As a result of this, the local pressure deviates strongly from the average pressure in the system [84], and thus the virial pressure method becomes less accurate.
We calculate the pressure from the cumulative force of the hydronium-wall and water-wall interactions. For the cases A and C the pressure ==1 atm was achieved by treating the pore size as a running parameter. For the case B all runs were started with the minimal water content =1. This parameter subsequently was increased through adding more water molecules until =1 atm is reached in the pore.
It should be noted that the calculated water content in the case B, and the pore size in the cases A and C under the condition =1 atm might be different from experimental realizations because of the non-polarizable water model used in our simulations. The precise polarizable water models [85] might result in different water densities in the solvation shells of ions and terminal groups. This is still an open question that deserves close attention, though it is out of the scope of our current model.
The case A, where the dependence of the ion diffusion on the pore size at various water contents will be elaborated, closely mimics the pore swelling process in ionomer membranes. In the case B the principal role of the sidechain protrusion length will be revealed in pores with a fixed size . In this case the change of is complemented by the change in the water content . Lastly, the case C is devoted to the role of the pore size in ion diffusion. For each of these cases we will determine optimal pore parameters for obtaining maximal ion diffusion coefficients and , which are defined below.
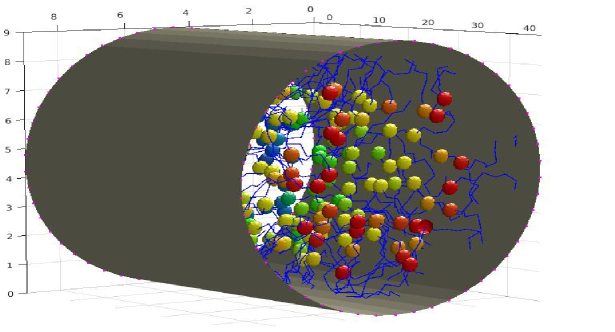
A snapshot picture taken from the simulation cell for run B4 is shown in Figure 3. Here, along with the sidechains drawn in blue and the sulfonate groups SO shown as spheres, the pore also accommodates monovalent ions and water molecules, which are not shown in this figure. Here two different types of effect take place. The sidechain-specific effects are their strong electrostatic fields, which polarize the water and attract hydronium H3O+ ions to the sulfonates, and their affinity to clustering due to the dipolar nature of SO groups and mutual SO–SO attraction mediated by the ions. The pore-specific effects are the pore wall hydrophobicity and the pore size which regulate the distribution of terminal groups, water molecules and ions.
| case A runs | A1 | A2 | A3 | A4 | A5 | A6 | A7 |
|---|---|---|---|---|---|---|---|
| 4 | 4 | 4 | 4 | 4 | 4 | 4 | |
| 2.03 | 2.33 | 2.70 | 2.89 | 3.12 | 3.37 | 3.55 | |
| 1 | 3 | 6 | 8 | 10 | 13 | 15 | |
| 0.65 | 0.71 | 0.77 | 0.80 | 0.84 | 0.87 | 0.90 | |
| 1.54 | 1.75 | 2.01 | 2.17 | 2.30 | 2.49 | 2.61 | |
| 0.78 | 0.84 | 0.92 | 0.96 | 0.99 | 1.04 | 1.07 | |
| case B runs | B1 | B2 | B3 | B4 | B5 | B6 | B7 |
| 2 | 4 | 6 | 8 | 10 | 12 | 16 | |
| 2.89 | 2.89 | 2.89 | 2.89 | 2.89 | 2.89 | 2.89 | |
| 9.3 | 8 | 6.7 | 5.7 | 4.2 | 2.8 | 1 | |
| 0.80 | 0.80 | 0.80 | 0.80 | 0.80 | 0.80 | 0.80 | |
| case C runs | C1 | C2 | C3 | C4 | C5 | C6 | C7 |
| 4 | 8 | 10 | 12 | 14 | 16 | 18 | |
| 2.89 | 3.15 | 3.30 | 3.40 | 3.50 | 3.60 | 3.70 | |
| 8 | 8 | 8 | 8 | 8 | 8 | 8 | |
| 0.80 | 0.84 | 0.86 | 0.88 | 0.89 | 0.91 | 0.92 |
For each simulation run listed in Table 1, the ion self-diffusion coefficients and were calculated using their mean square of displacements,
| (3) |
where and are the 3D and 1D-axial positions of the atom at the simulation time . Eq.(3) defines only the en-masse (vehicular) ion diffusion. The structural proton diffusion through Grotthuss hopping, which is not included in our simulation model, but which can be modeled using empirical valence bond (EVB) based water models [67, 85, 86], would increase the total diffusion rate of ions.
It should be noted that the pore diameters considered in Table 1 are typical for Nafion-like ionomers, and are larger than the size 0.4–1.1 nm of narrow carbon nanotubes. Thus, for the run parameters listed in Table 1 we do not enter the regime of single-file diffusion [87, 88, 89]. Moreover, the presence of the ions and grafted chains with hydrophilic ends is a suppressing factor to any occasional movement of hydrogen-bonded water clusters along the pore axis [90, 91].
4.1 Case A simulations for (,,)
The runs A1-A7 from Table 1 are consistent with the ionomer pore swelling when excess water is absorbed by the PEM membrane. That is why we consider shorter sidechains with =4 monomers which correspond to the sidechain protrusion length about 3–4 Å in the pores of Nafion-like membranes [14].
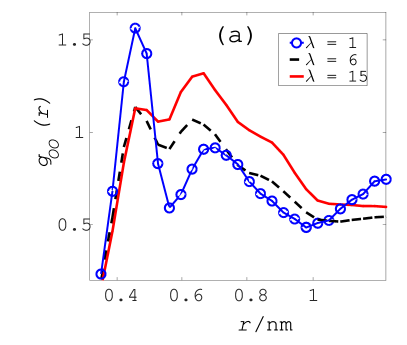
We first plot the pair distribution functions of the terminal group oxygens in Figure 4a. The pair distribution functions are defined as
| (4) |
where denotes the position of the particle of the type , =O for the oxygen groups of sulfonates, is the Dirac function, and is the Heaviside step function. The two maxima of the at separation distances 0.45 nm and 0.7 nm correspond to the first and second nearest neighbor sulfonate groups, respectively. The neighboring sulfonate groups share their hydronium ions in the sulfonate clusters of size 2 nm. In swollen pores decreases whereas increases, which is different from the case of the bulk ionomer, where both these quantities decrease at high solvation levels [37, 92]. This behavior is a result of the increase in the sidechain anchoring distance which makes it harder for the terminal groups to come closer and share a hydronium ion at a separation distance . As a consequence, in swollen pores the sidechain tips mostly share their counterions at the separation distance . For larger the discrepancy between and increases, which indicates that the sidechains stretch to form sulfonate clusters.
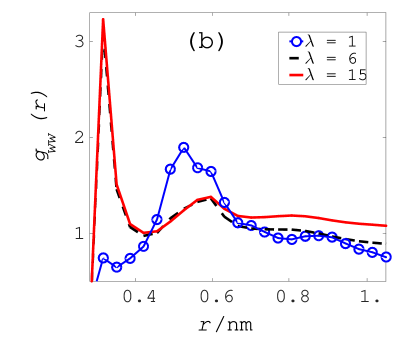
The water-water pair distribution functions , defined by the Eq.(4) with = for the water oxygens, are shown in Figure 4b. For the low water contents 3 the most expected water-water separation distance is about 0.5 nm, which, more likely, characterizes the separation distance between water molecules that share the same ion or sulfonate group. At high water contents , hydration shells are formed around the charged entities together with the water clusters being formed in the pore center. Both these effects appear as the formation of a huge maximum at the touching water-water separation distance = 0.35 nm for 6 in Figure 4b. The position of the second maximum of at 0.6 nm is related to the radius of the second solvation layer in water clusters.
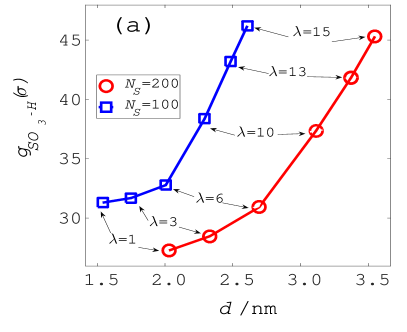
The ion-sulfonate association parameter, measured as the height of the SO-ion pair distribution function at =, is plotted in Figure 5a. This parameter holds information on how strongly the electrostatic field of sulfonate groups disturbs the distribution of hydronium ions in the pore. We see that such disturbance increases in swollen pores. This tendency, discussed in Refs. [13, 65], can be justified by the enhancement of the sulfonate-ion interaction
| (5) |
in wide pores. In Eq.(5) is the permittivity of the medium and includes polarization effects of water in swollen pores, is the Debye screening length for the sulfonate groups and hydronium ions,
| (6) |
where is the permittivity of free space, is the concentration of all charges (SO and HsO+) in the system
and is defined as ===.
Using Eq.(6) we get
=0.028 nm in the unswollen pore of run A1, and
=0.115 nm in the fully swollen pore of run A7
by assuming that =5 in the first, and =25 in the second cases.
Then, for the relative change of the association strength we get 1
which is a clear indication of the fact that
in swollen pores the distribution of hydroniums is strongly disturbed by the electric field of terminal groups.
This is exactly what is observed in Figure 5a, which, however, should not be interpreted as the
localization effect of H3O+ ions around the sulfonate groups.
The localization or delocalization effects of the
ions around their host terminal groups can be evaluated through their coordination number (CN)
| (7) |
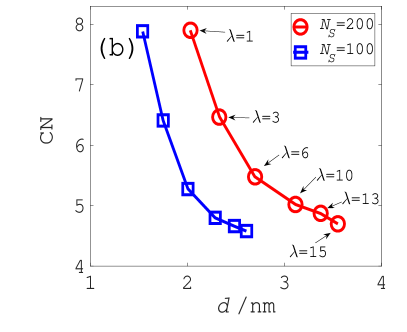
shown in Figure 5b. Here = is the average sulfonate density in the pore of volume , and is the position of the first minimum of . The decrease of CN in swollen pores, as seen from Figure 5b, corresponds to the expected ion delocalization effect due to the water screening effects.
Figure 5 also shows the weakening of the ion-sulfonate association when the pore surface charge density is increased. This is seen, for example, for =2.3 nm, where the is about 38 at =10 and =100, compared to its value about 28 at =3 and =200. This ion-sulfonate association weakening can be explained, again, using the screening arguments given in Eq.(6). In the pores with higher and lower , the parameters and , and therefore the screening length , become smaller. At reduced the charges of all ions are strongly screened, and thus the opposite charges in the pore are loosely associated. As a result of this, the CN of the sulfonate groups also decreases in pores with lower surface charge densities, as seen in Figure 5b. In total, the competition between the increased influence of the sulfonate groups on the distribution of the hydronium ions and the increased delocalization of the hydronium ions in swollen pores determines the optimal pore diameter when the hydronium diffusion along the pore axis reaches its maximum value.
The radial distribution functions, defined as
| (8) |
are shown in Figure 6 for the sulfonate oxygens (=), hydronium ions (=), and the water molecules (=). In Eq.(8) is the radial distance from the pore axis (=0 corresponds to the pore center), and is the radial distance of the particle of the sort . In Figure 6 the radial distributions are normalized by the average density of particles in the pore. The ion profiles appears to be completely restricted to the pore boundary regions and no free ions penetrate to the pore center. This result differs from the ion radial distributions calculated using approaches based on Poisson-Boltzmann theory in charged pores [13, 25, 26]. In the latter the ion profile is non-zero in the whole pore volume. The exclusion of ions from the pore center in Figure 6 effectively means that in charged pores with shorter grafted sidechains, the Grotthuss mechanism of structural proton transfer is restricted to the pore boundary areas.
The radial distribution of water molecules shown in Figure 6 displays strong water structuring effects in the pore. First, in narrow pores with 6, the water mostly accumulates in the hydration shells of ions and sulfonates where it is strongly polarized. This is a consequence of the high surface-to-volume ratio effect in narrow pores, which works against the water clustering in the pore center. In the larger pores the water shows bulk-like properties in the pore central area.
The increase in the height of the maxima in in Figure 6 in larger pores is related to the frustration of sidechains. When becomes larger in swollen pores, the sidechains start to stretch out so that their tips can share free ions. Also, in larger pores the sidechain-pore wall interaction becomes stronger: while the hydrophobic part of the sidechain becomes more attracted to the pore wall, the hydrophilic tip segment of the sidechain becomes more repelled from the pore wall. An increased frustration of sidechains in larger pores, together with the enhanced sulfonate-ion association effect shown in Figure 5a, brings the ions to the vicinity of the pore walls. This is seen from the increase in the height of the maxima in in Figure 6. As a result of these frustration-localization effects the flexibility of sidechains in larger pores degrades.
The orientation of the dipole moment of the SO head group, characterized by the function
| (9) |
is shown in Figure 7, as a function of the water content . In Eq.(9) is the angle between the SO dipole moment and the long axis x of the pore, and =–0.5 is expected for a limiting case when all the SO dipoles point towards the pore center. The orientation parameter shows a steep decrease when is increased from 1 to 6, which is followed by a weak change in for 6. Such behavior can be explained by assuming that at =6 all ions develop a compact hydration shell which is strongly repelled from the walls of the larger pores. This results in the reorientation of the sulfonate dipoles towards the pore center. On the other hand, the accumulation of bulk water in the pore center has only a negligible effect on the sulfonate dipole reorientation.

The ion self-diffusion coefficients for 3D ion diffusion in the pore, and for 1D ion diffusion along the pore axis , defined by Eq.(3), are shown in Figure 8 as a function of the pore size . For all the hydration levels for the runs A1-A7, simulation results show , showing that the ion diffusion along the pore axis is higher than the total ion diffusion in the pore [93]. While the 3D diffusion has almost a monotonic dependence on , the 1D diffusion reaches a maximum at =6. Such nonlinear behavior of the is a consequence of the following two factors: First, as the pore swells, the increase in the grafting parameter and the decrease in the sidechain flexibility constrain the ion diffusion along the pore. Second, as the pore shrinks, the low amount of water, insufficient to hydrate the ions, becomes highly structured and polarized by the charges. As a consequence, the ions become immobile in the structured water environment. The maximum of the ion diffusion, hence, happens in between these two extreme too-large and too-narrow pore cases. Figure 8 also reveals that the surface charges of the pores facilitate ion diffusion in the pore. This is because of the electrostatic delocalization effect of ions due to the weakening of the ion-sulfonate association at high . In total, in the pores with shorter sidechains the ion diffusion is limited to the pore wall area, and its component along the pore axis is maximal if the electrostatically delocalized ion possesses a hydration shell with about six water molecules.
It is known that at sufficiently longer times the diffusion coefficient of the ions in the radial direction of the pore becomes very small, 0, thus the full diffusion coefficient
| (10) |
has an asymptotic limit =3. In our simulations this limit has been reached in the narrow pores of runs A1 and A2 for =100, and in the narrow pore of the run A1 for =200. In the larger pores of runs A3-A7 the ratio decreases from 3 to around 1.6–1.8. Therefore, runs much longer than 50 ns are needed to approach the asymptotic limit =3.
4.2 Case B simulations for (,,)
In this section we focus on the role of the sidechain protrusion length in providing fast ion diffusion along the pore axis. The runs B1-B7 from Table 1 were carried out at the constant pore size =2.89 nm. The chain protrusion length was increased from 2 monomers to 16 monomers with a simultaneous decrease of the water content from about 9 to 1. The shortest =2 monomers corresponds to a completely hydrophilic sidechain consisting of only the two charged entities of the terminal group SO. The tips of the longest sidechain with =16 monomers can reach the pore center and thus are capable of forming hydrophilic sulfonate clusters there. The results of the previous section indicated that the ions mostly occupy the pore wall areas in the case of shorter sidechains . For the longer it is expected that the ions would reach the pore center by following their host sulfonate groups. In both cases the ion diffusion depends on the state of water in the pore. In other words, a priori, it is not evident at which and the ion diffusion will be maximal.
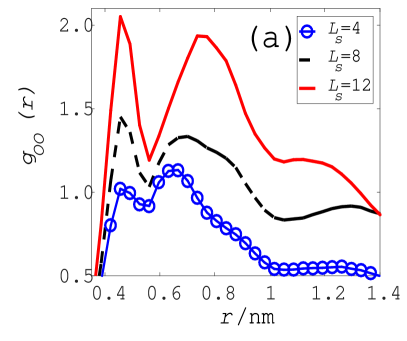
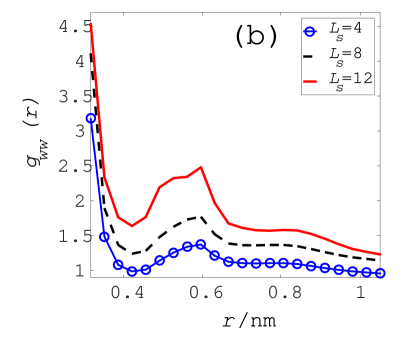
The sulfonate-sulfonate pair distribution functions shown in Figure 9a clearly indicate an enhancement of the sulfonate clustering as the sidechain protrusion is increased. This result is fully expected, because long sidechains have more flexibility to form clusters in the pore volume. As the clusters grow in size, more ions and water molecules are shared between the neighboring sulfonate groups. This explains the shift of the position of the second maximum of , , to the larger sulfonate-sulfonate separations. Since long sidechain protrusion lengths also mean lower values for in the pore, it is obvious that sulfonate clustering features are essentially regulated by the protrusion length rather than by the water content .
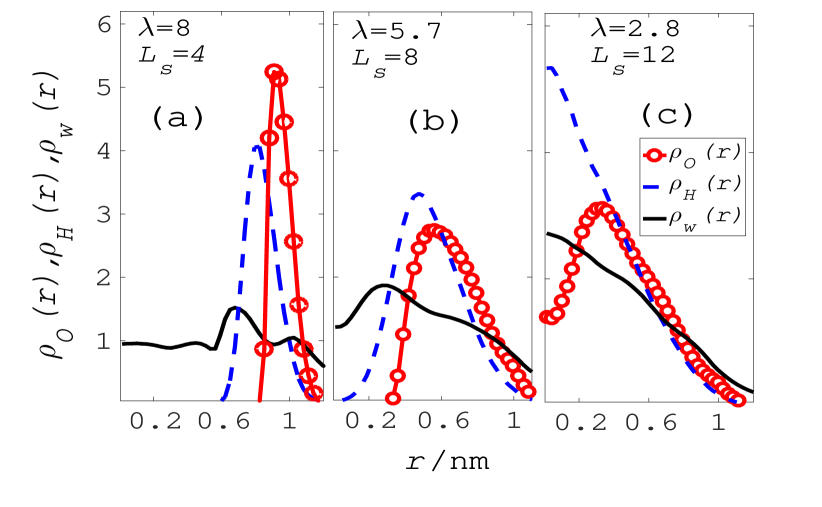
The water pair distribution functions also show higher water cluster formations for the long sidechains, as seen in Figure 9b. Even if the long sidechains demand less water to fill the pore, it seems that all the available water is collected in the pore central area where it easily merges into larger clusters. This conclusion is supported by the radial distribution profiles of ions, water molecules and sulfonates, shown in Figure 10. Indeed, as the protrusion length increases, most of the water molecules cluster in the pore center, perhaps by being attracted there by the sulfonate tips of the protruding sidechains and the ions. For the sidechain monomer number 8 the radial distributions in Figure 10a and Figure 10b look qualitatively the same as the densities shown in Figure 6 for 6: the water mostly occupies the pore central area, and the ions mostly lie between the water and sulfonate clusters. However, for the long chains with the number of monomers 12, when the sulfonate groups reach the pore center, the ions have their maximal density on the -axis. As seen from Figure 10c, in this region the difference between the radial densities of the sulfonate oxygens and ions gives rise to the charge separation in the pore. The central part of the pore has a positive charge whereas the rest of the pore is charged negatively. This result is the direct consequence of the long sidechains: a pore with the long sidechains, when the chains partly occupy the pore wall area, behaves like a narrow pore with shorter sidechains. In narrow pores, when their radius is comparable with the sidechain length, the counterions enter the pore center generating a charge separation between the central and wall areas of the pore. Their diffusion along the pore axis, however, depends on the sulfonate clustering structure in that area.
The -axis profile of sulfonate clustering, defined as
| (11) |
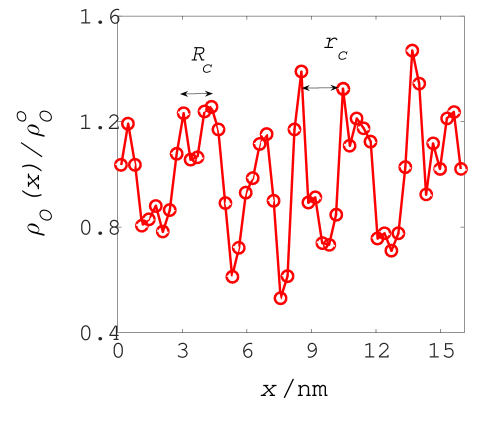
where is the -coordinate of sulfonates, is shown in Figure 11 for the run B6 with =12 monomers (the case of radial charge separation in the pore). The sulfonate clusters self-organize into compact formations along the pore axis with the average cluster size 2 nm and a separation distance between them of =2 nm. For =200 sidechains along the =16 nm long pore, a rough estimate gives about 40–50 sulfonates per cluster formation.
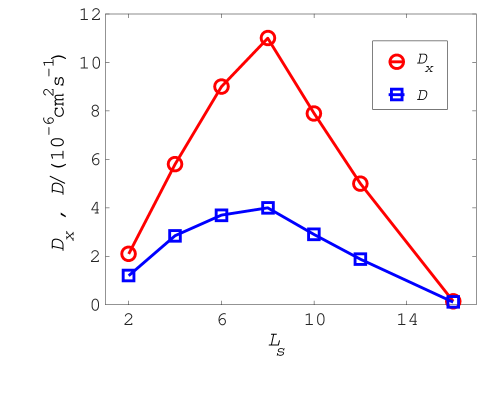
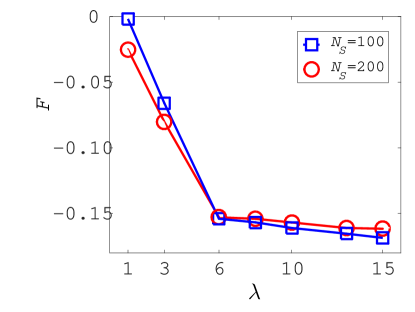
Calculated ion diffusion coefficients and are shown in Figure 12 for the pore size =2.89 nm and the sidechain anchoring distance =0.8 nm. Both diffusion coefficients show a nonmonotonic dependence on the sidechain protrusion length . The maximal ion diffusion is observed for the run B4 with =5.7 and =8 monomers. According to the findings of Paddison [14], who calculated ion diffusion in the framework of non-equilibrium statistical mechanics, the ion diffusion should decrease when the protrusion length of the anchored sidechains is increased. We believe that the difference between our findings and the results of Ref. [14] is based on the fact that we explicitly treat the dynamics and clustering behavior of the water, ions, and the sulfonates, which are not included in the statistical mechanical theory of Ref. [14]. The fact that the ion diffusion for the run B7 with =16 monomers is very small compared to its value for the run B4 with =8 monomers, implies that the clustering of sulfonates and ions in the pore center is a degrading factor for the free ion diffusing in the pore. Therefore, for getting faster ion diffusion, it seems that the central pore area should be free from ions and sulfonates. At the same time, similar to the case A runs in the previous section, the ions should be partly delocalized from their host sulfonates and moderately hydrated.
4.3 Case C simulations for (,,)
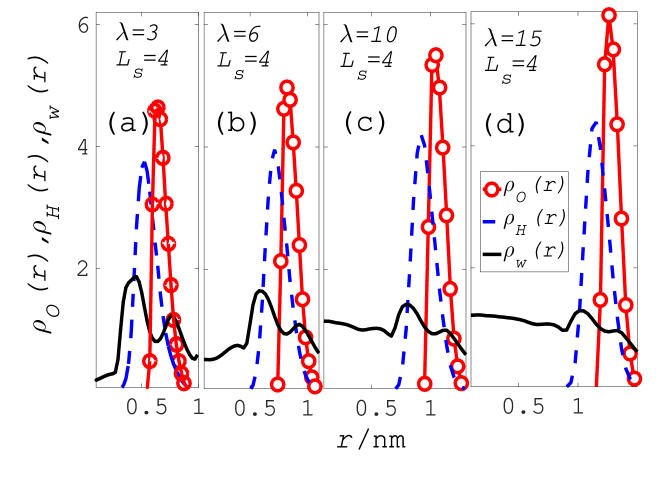
In the case A and B simulations discussed in previous sections, the variation of and were accompanied with change in the water content . In the current section we fix the water content to =8, the average hydration number for Nafion-like ionomers, and focus on finding an enhanced ion diffusion in the charged pores. We choose the run B2 as a reference run for the case C simulations, and vary the sidechain protrusion length from 4 monomers to 16 monomers. Simulation results for the radial density distribution of the ions (=H), sulfonate oxygens (=O), and the water molecules (=w), shown in Figure 13, resemble the radial distributions for the case B runs in Figure 10 [94]. Here, again, in the case of long sidechains with =16 monomers, the ions are electrostatically delocalized in the central pore area and generate a radial charge separation in the pore. A remarkable fact is the flattening of the ion and water profiles in the central pore area in Figure 13c at =8, in contrast to the steep gradients of the and in the same area as seen in Figure 10c for =2.8. At the same time, no such flattening of the sulfonate profile in Figure 13c from the increased water content is visible. As a result of these observations, we conclude that the radial charge separation in the pore decreases if more water is absorbed in the pore.
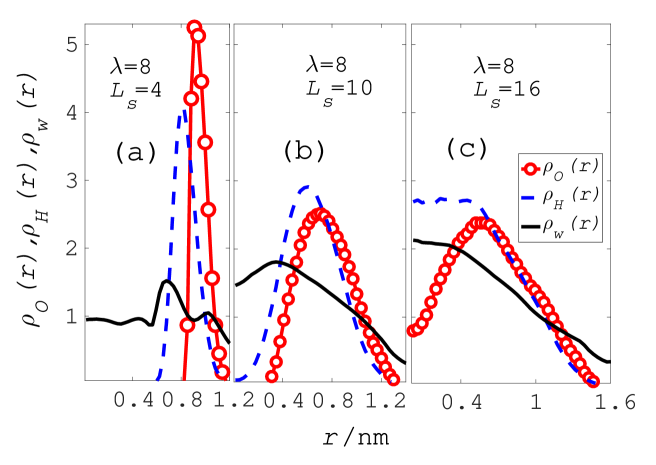
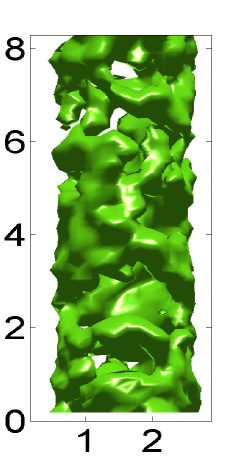
From the similarity of the ion and sulfonate radial distribution profiles in Figure 13b and Figure 10b it is more likely to expect that the run C3 with =10 monomers and =3.3 nm would provide maximal ion diffusion in the pore. The 3D distribution of ions for some of the case C runs are plotted in Figure 14. The averaging of the ion positions in these plots was done during the 50 fs long simulations in fully equilibrated system to get instantaneous ion distribution profiles in the pore. It is seen that for a shorter sidechains with 10 monomers, the ions mostly accumulate near the pore walls, where they form continuous hollow-cylinder-like ionic pathways. The hollow area of this structure is filled with water molecules. For the sidechains with bigger monomer numbers , the ions accumulate at the pore center by forming larger clusters with disrupted connections along the pore axis. These disrupted and hollow areas are filled either with water molecules or with sulfonates, with the latter hindering smooth ion passage through the pore.
(a) (b) (c)
=8, =4 monomers
=8, =10 monomers
=8, =16 monomers
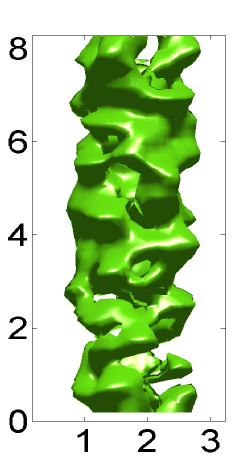
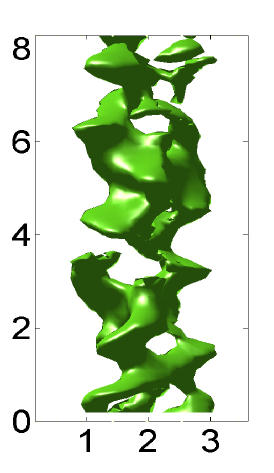
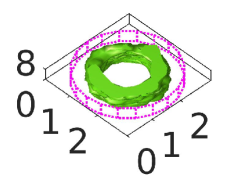
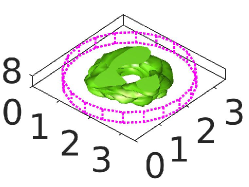
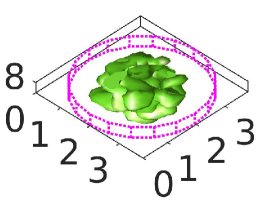
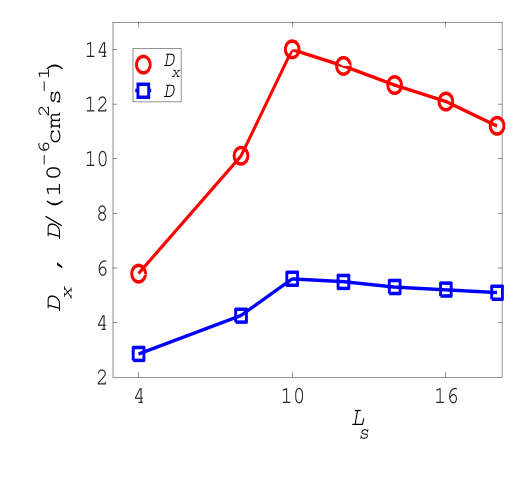
Calculated diffusion coefficients for the ions as a function of the sidechain protrusion length for the runs C1-C7 are plotted in Figure 15. The axial diffusion coefficient for the entire range of the sidechain protrusion length variation is more than twice as large as the full diffusion coefficient of the ions, a result of the strongly suppressed ion diffusion in the radial direction, perpendicular to the pore walls. A maximum in the is seen for the sidechain protrusion length =10 monomers (run C3), as is expected from the radial distributions of ions and sulfonates in Figure 14. As will be discussed in the next section, it is indeed possible the predict the pore parameters at which maximal ion diffusion along the pore axis is expected.
4.4 Maximal ion diffusion in charged pores
In this section we collect and discuss the maximal ion diffusion coefficients along the pore axis, detected for the runs A3, B4, and C3. The dependence of the on the sidechain protrusion length is plotted in Figure 16a. It appears that is a linear function of the sidechain protrusion length . Taking into account the fact that long sidechains in larger pores behave like short sidechains in narrow pores, it seems plausible to find a scaling rule for the pore parameters and at which the ion diffusion is maximal along the pore axis. For the average sidechain extension into the pore center it is reasonable to introduce the gyration radius of the sidechain
| (12) |
with a phenomenological Flory-like exponent . Here is the segment length of the sidechain, =0.154 nm for Nafion-like ionomers, For the polymer chains with excluded-volume interactions the exponent varies between 1/2 and 3/5 [95], whereas for attractive coil-globule collapsing polymers the Flory exponent is 1/3. A lower value =1/4 has been reported for dilute branched polymers [96, 97]. Twice the gyration radius can be considered as the protrusion length of the sidechain into the pore center, =.
In Figure 16b we test a phenomenological fit
| (13) |
for the pore parameters and at which the ion diffusion is maximal. The scaling parameter measures the ratio of the sidechain protrusion length to the pore radius . We found that for the fitting exponent =1/4 the pore scaling parameter is almost constant at 0.33 for changed from 4 monomers to 10 monomers, and changed from 2.7 nm to 3.3 nm. The fitting value =1/4 is the same as the Flory exponent for branched polymers. This is a reasonable conclusion, because the sidechains in the pore create clusters which indeed can be viewed as a branched polymer. The result 0.33 implies that the sidechain extension into the pore center should be about 1/3 of the pore radius for the pore to provide maximal ion diffusion along the pore axis.
An interesting question is how the optimal protrusion length depends on the diffusing ion size . Apparently there is no direct link between these two quantities. Under the condition that the free volume for the ions in the pore is kept constant, the change in will affect the ion diffusion rates in all simulated cases A, B, and C in the same manner. Smaller ions will be more attracted to the oppositely charged sulfonates which will slow down their diffusion, whereas larger ions will be more readily released from the sulfonates and thus have higher diffusion rates. Therefore, we think that the diffusion lines shown in Figures 8, 12, 15, and 16a will retain their shape but shift either up or down depending on the decrease or increase in respectively.
The maximal diffusion coefficients shown in Figure 16 are in the range (10–14)10-6cm2/sec for the sidechain lengths 8–10 monomers. These values are about half the size of the self-diffusion of water molecules in bulk water 2310-6cm2/sec [63, 64, 93, 98, 99, 100], and about 30–40% smaller than the simulated vehicular (en-masse) diffusion values for hydronium ion in bulk water (17–20)10-6cm2/sec [59, 64]. Obviously, it is more relevant to compare our data for with the water and hydronium diffusion coefficients in ordinary ionomers with 8 monomers like the Nafion membrane. In this case, however, one has to distinguish between the local and long-range diffusion coefficients, with the corresponding to the particle diffusion in a single cluster at shorter time scales, and corresponding to the particle diffusion at longer time scales when the particle has enough time to pass through several hydrophilic clusters in the ionomer. Generally, because of the tortuousity and narrow bridges between neighboring hydrophilic clusters in the ionomer [101]. For example, in a fully hydrated ionomer with 15–17 the water molecule has a local self-diffusion coefficient 1310-6cm2/sec which is about twice as large as its long range self-diffusion coefficient 610-6cm2/sec [102], and much higher than its long range self-diffusion coefficient (5–10)(1–5)10-6cm2/sec in partly hydrated Nafion [42, 103]. Additionally, one has to bear in mind that experimentally determined diffusion coefficients for hydronium ions include the Grotthuss proton hopping mechanism, which is not accounted for in our simulations. For example, in fully hydrated Nafion with the Grotthuss hopping accounted for reaches (Grotthuss + en-masse)(12–14)10-6cm2/sec [59] which is more than twice as large as the en-masse diffusion (en-masse)(4–5)10-6cm2/sec [59, 104]. The same is valid in partly hydrated Nafion with 6–10, where (Grotthuss + en-masse)(2–5)10-6cm2/sec is larger than (en-masse)(1–2)10-6cm2/sec [63, 103].
5 Conclusions
In this work we analyzed ion diffusion phenomena in charged nanopores grafted with ionomer sidechains. Our aim was to determine the optimal pore parameters for obtaining enhanced ion diffusion. We found that in the case of short sidechains, the hydronium ions mostly occupy the pore wall area and their distribution is strongly disturbed by the electric field of sulfonates in swollen pores. Additionally, the hydronium ions delocalize from their host sulfonate groups in wide pores. However, an increase in the anchoring distance and associated with it a stretching of sidechains restricts the ion diffusion in swollen pores. In narrow pores, on the other hand, the structuring and polarization effects of the water molecules hinder the free movement of the ions in the pore. Consequently, the ion diffusion in the charged pores grafted with short sidechains becomes a nonlinear function of the pore diameter. It attains a maximum in the pores with less structured water, high surface charge density, and moderately delocalized ions occupying only the pore wall area.
In the charged pores with a fixed pore size , according to our simulations, the clustering of the sulfonates is strongly regulated by their protrusion length rather than by the water content . For the longer , when the sidechain tips reach the pore center, a radial charge separation occurs in the pore. The pore center with excess ions is charged positively, while the pore wall area with excess sulfonates is charged negatively. Such charge separation, which is associated with the sulfonate clustering in the pore central area, suppresses the ion diffusion along the pore axis. An enhanced ion diffusion was found in the pores grafted with medium-size sidechains provided that the ions do not enter the central pore area, and the water is less structured around the ions. A similar conclusion is also made for the pores with a fixed water content. The medium-sized sidechain with tips not entering the pore central area allows the ions to form hollow-cylinder type hydrophilic pathways in the channel. The existence of such cylindrical shells with smooth and uninterrupted ion pathways is the necessary condition for getting an easy ion passage along the pore axis.
By collecting and analyzing the pore parameters for which our simulations have detected maximal ion diffusion along the pore axis, we found that the ion diffusion has a linear dependence on the sidechain protrusion length . The long chains, provided that they do not reach the pore center, have very flexible tips which assist the ion diffusion along the pore axis. We also proposed a simple scaling rule for the pore parameters and with a Flory-like exponent 1/4. It appears that a maximal ion diffusion along the pore axis is possible if the effective length of the sidechain extension into the pore center, measured as twice the gyration radius of the sidechain with the Flory-like exponent 1/4, is about 1/3 of the pore radius .
The simulated axial diffusion coefficients have maximal values in the range (10–14)10-6cm2/sec for water content 6–8, and sidechain length 8–10. These diffusion rates are about 2–3 times larger than the diffusion rate (en-masse) in fully hydrated Nafion [59, 104], and about 5–7 times larger than the diffusion rate (en-masse) in partly hydrated Nafion [63, 69, 103]. We believe that experimental realizations of our grafted pore set-up will produce even higher ion diffusion rates because of the Grotthuss structural diffusion contribution to . For example, the Grotthuss proton diffusion rate in bulk water is (Grotthuss)=7010-6cm2/sec, and with the water self diffusion (en-masse)=2310-6cm2/sec added to it, the total proton diffusion rate roughly increases up to (Grotthuss + en-masse)=9310-6cm2/sec [64, 100]. In Molecular Dynamics simulations the Grotthuss hopping can be accounted for by implementing the empirical valence bond method [13, 15, 85].
These results obtained for ion diffusion in charged pores may be helpful in the further development of new emerging technologies, such as energy storage in nanoporous metals [6], or a new class of soft fluid actuators [105]. Our results also might contribute to the development of a new class of elastomer actuators called metallic muscles [106]. In these applications the pores of the metal inclusions are polymer coated and charged by doping with sulfuric acid. Nanocomposite elastomers with these nanoporous metal inclusions, besides generating electrostrictive strains [107, 108, 109], will also generate additional strain from the interaction of the electrostatic double layers between these highly charged objects. Then the total actuation response of the nanocomposite to the applied field will be greatly enhanced.
We also propose that the concept of the self-assembling of amphiphilic diblock copolymers in cylindrical confinements [110, 111] can be used to obtain grafted pores. In this case the free hydrophilic ends of the polymer will form brush conformations [112, 113]. The functionalization and hydration of these brushes will turn the pore into an ion-conducting channel.
Acknowledgments
E. Allahyarov is thankful for support of this work by the Deutsche Forschungsgemeinschaft (DFG) through the grant AL 2058/1-1 on nanocomposite elastomer actuators. H. Löwen thanks the Deutsche Forschungsgemeinschaft for support of the work through the SPP 1681 on magnetic hybrid materials. P. Taylor acknowledges support by the American Chemical Society Petroleum research Fund under Grant PRF#51995-ND7.
References
- [1] A. Nouri-Khorasani, K. Malek, A. Malek, T. Mashio, D. P. Wilkinson, M. H. Eikerling, Molecular modeling of the proton density distribution in a water-filled slab-like nanopore bounded by Pt oxide and ionomer, Catalysis Today 262, 133-140 (2016).
- [2] A. Nouri-Khorasani, K. Malek, M. Eikerling, Molecular Modeling of Hydronium Ion and Water Distribution in Water-Filled Pt Nanochannels with Corrugated Walls, Electrocatalysis 5, 167-176 (2014).
- [3] K. Chan, M. Eikerling, Single pore modeling of oxygen reduction in ionomer-free catalyst layers of PEFCs, ECS Transactions 41, 153-164 (2011).
- [4] A. A. Lee, S. Kondrat, A. A. Kornyshev, Single-file charge storage in conducting nanopores, Phys. Rev. Letters 113, 048701 (1-5) (2014),
- [5] A. A. Kornyshev, The simplest model of charge storage in single file metallic nanopores, Faraday Discussions 164, 117-133 (2014).
- [6] J. Zhang, C. M. Li, Nanoporous metals: fabrication strategies and advanced electrochemical applications in catalysis, sensing and energy systems, Chem. Soc. Rev. 41, 7016-7031 (2012).
- [7] M. M. Rohani, A. L. Zydney, Role of electrostatic interactions during protein ultrafiltration Adv. Colloid and Interface Sci. 160, 40-48 (2010).
- [8] J. A. Armstrong, E. E. L. Bernal, A. Yaroshchuk, M. L. Bruening, Separation of ions using polyelectrolyte-modified nanoporous track-etched membranes, Langmuir 29, 10287-10296 (2013).
- [9] P. Stroeve, M. Rahman, L. D. Naidu, G. Chu, M. Mahmoudi, P. Ramirez, S. Mafe, Protein diffusion through charged nanopores with different radii at low ionic strength, Phys. Chem. Chem. Phys 16, 21570-21576 (2014).
- [10] I. I. Ryzhkov, A. V. Minakov, Theoretical study of electrolyte transport in nanofiltration membranes with constant surface potential/charge density, J. Membrane Sci. 520, 515-628 (2016).
- [11] L. Van Oeffelen, W. Van Roy, H. Idrissi, D. Charlier, L. Lagae, G. Borghs, Ion current rectification, limiting and overlimiting conductances in nanopores, PLoS ONE 10, 0124171 (1-16) (2015).
- [12] M. H. Eikerling, P. Berg, Poroelectroelastic theory of water sorption and swelling in polymer electrolyte membranes, Soft Matter 7, 5976-5990 (2011).
- [13] M. Eikerling, A. A. Kornyshev, A. M. Kuznetsov, J. Ulstrup, S. Walbran, Mechanisms of Proton Conductance in Polymer Electrolyte Membranes, J. Phys. Chem. B 105, 3646-3662 (2001).
- [14] S. J. Paddison, Proton conduction mechanisms at low degrees of hydration in sulfonic acid-based polymer electrolyte membranes, Annu. Rev. Mater. Res. 33, 289-319 (2003).
- [15] R. Paul, S. J. Paddison, Effects of dielectric saturation and ionic screenig on the proton self-diffusion coefficients in perfluorosulfonic acid membranes, J. Chem. Phys. 123, 224704-224717 (2005).
- [16] M. Jardat, B. Hribar-Lee, V. Vlachy, Self-diffusion of ions in charged nanoporous media, Soft Matter 8, 954-964 (2012).
- [17] P. Malgaretti, I. Pagonabarraga, J. M. Rubi, Entropically induced asymmetric passage times of charged tracers across corrugated channels, J. Chem. Phys. 144, 034901 (1-7) (2016).
- [18] J. Dzubiella, J.-P. Hansen, Electric field controlled water and ion permeation of a hydrophobic nanopore, J. Chem. Phys. 122, 234706 (1-14) (2005).
- [19] D. Kim, E. Darve, MD simulation of electro-osmotic flows in rough wall nanochannels, Phys. Review E 73, 051203-051212 (2006).
- [20] A. Szymczyk, H. Zhu, B. Balannec, Ion rejection properties of nanopores with bipolar fixed charge distributions, J. Phys. Chem. B 114, 10143-10150 (2010).
- [21] S. Gassara, A. Abdelkafi, D. Quemener, R. B. Amar, A. Deratani, Positively charged and bipolar layered poly(ether imide) nanofiltration membranes for water softening applications, Euro. Phys. J. : Special Topics 224, 1899-1910 (2015).
- [22] J. E. Basconi, G. Carta, M. R. Shirts, Effects of polymer graft properties on protein adsorption and transport in ion exchange chromatography: A multiscale modeling study, Langmuir 31, 4176-4187 (2015).
- [23] J. E. Basconi, G. Carta, M. R. Shirts, Multiscale modeling of protein adsorption and transport in macroporous and polymer-grafted ion exchangers, AIChE Journal 60, 3888-3901 (2014).
- [24] M. Kumar, B. J. Edwards, S. J. Paddison, A macroscopic model of proton transport through the membrane-ionomer interface of a polymer electrolyte membrane fuel cell, J. Chem. Phys. 138, 064903 (1-13) (2013).
- [25] Y. Yang, P. N. Pintario, Multicomponent space-charge transport model for ion-exchange membranes with variable pore properties, Ind. Eng. Chem. Res. 43, 2957-2965 (2004).
- [26] P. M. Pintauro, R. Tandon, L. Chao, W. Xu, R. Evilia, Equilibrium Partitioning of Monovalent/divalent Cation-salt Mixtures in Nafion Cation-Exchange Membranes, J. Phys. Chem. 99, 12915-12924 (1995).
- [27] K. A. Mauritz, R. B. Moore, State of understanding of nafion, Chem. Rev. 104, 4535-4586 (2004).
- [28] G. Gebel, Structural evolution of water swollen perfluorosulfonated ionomers from dry membrane to solution, Polymer 41, 5829-5838 (2000).
- [29] A. S. Ioselevich, A. A. Kornyshev, J. H. G. Steinke, Fine morphology of proton-conducting ionomers, J. Phys. Chem. B 108, 11953-11963 (2004).
- [30] W. Y. Hsu, T. D. Gierke, Elastic theory for ionic clustering in perfluorinated ionomers, Macromolecules 15, 101-105 (1982).
- [31] M. I. Tejedor-Tejedor, F. M. Vichi, and M. A. Anderson, Effect of Pore Structure on Proton Conductivity and Water Uptake in Nanoporous TiO2 J. Porous Materials 12, 201-214 (2005).
- [32] F. M. Vichi, M. T. Colomer, M. A. Anderson, Nanopore Ceramic Membranes as Novel Electrolytes for Proton Exchange Membranes, Electrochem. Solid-State Letters, 2, 313-316 (1999).
- [33] M. T. Colomer and J. R. Jurado, Proton conductivity in nanopore silica xerogels, J. Ionics 9, 207-213 (2003).
- [34] C. Iacob, J. Runt, Charge Transport of Polyester Ether Ionomers in Unidirectional Silica Nanopores, ACS Macro Letters 5, 476-480 (2016).
- [35] F. Liu, B. Yi, D. Xing, J. Yu, H. Zhang, Nafion/PTFE composite membranes for fuel cell applications, J. Membrane Sci. 212, 213-223 (2003).
- [36] M. P. Rodgers, J. Berring, S. Holdcroft, Z. Shi, The effect of spatial confinement of Nafion in porous membranes on macroscopic properties of the membrane, J. Membrane Sci. 321, 100-113 (2008).
- [37] E. Allahyarov, P. L. Taylor, H. Löwen, Simulation study of field-induced morphological changes in a proton-conducting ionomer, Phys. Rev. E 81, 031805 (1-11) (2010).
- [38] E. Allahyarov, P. L. Taylor, Predicted electric-field-induced hexatic structure in an ionomer membrane, Phys. Rev. E 80, 020801(R) (1-4) (2009).
- [39] E. Allahyarov, P. L. Taylor, H. Löwen, Simulation study of field-induced proton conduction pathways in dry ionomers, J. Phys.: Condens. Matter 23, 234105 (1-9)(2011).
- [40] E. Allahyarov, P. L. Taylor, H. Löwen, Simulation study of poled low-water ionomers with different architectures, J. Phys.: Condens. Matter 23, 455102 (1-7) (2011).
- [41] K. Schmidt-Rohr, Q. Chen, Parallel cylindrical water nanochannels in Nafion fuel-cell membranes, Nat. Mater. 7, 75-83 (2008).
- [42] K. Malek, M. Eikerling, Q. Wang, Z. Liu, Sh. Otsuka, K. Akizuki, M. Abe, Nanophase segregation and water dynamics in hydrated Nafion: molecular modeling and experimental validation, J. Chem. Phys. 129, 204702-10 (2008).
- [43] K. D. Kreuer, G. Portale, A Critical Revision of the Nano-Morphology of Proton Conducting Ionomers and Polyelectrolytes for Fuel Cell Applications, Adv. Funct. Mater. 23, 5390-5397 (2013).
- [44] M. Cappadonia, J. W. Erning, U. Stimming, Proton conduction of Nafion-117 membrane between 140 K and room temperature, J. Electroanal. Chem. 376, 189-193 (1994).
- [45] M. Cappadonia, J. W. Erning, S. M. Saberi Niaki, U. Stimming, Conductance of Nafion 117 membranes as a function of temperature and water content, Solid State Ionics 77, 65-69 (1995).
- [46] G.K. Rennie and J.J. Clifford, Melting of ice in porous solids, J. Chem. Sot. Faraday Trans. 73, 680-689 (1977).
- [47] K. Jiao, X, Li, Three-dimensional multiphase modeling of cold start processes in polymer electrolyte membrane fuel cells, Electrochim. Acta 54, 6876-6891 (2009).
- [48] M. Plazanet, F. Sacchetti, C. Petrillo, B. Deme, P. Bartolini, R. Torre, Water in a polymeric electrolyte membrane: Sorption/desorption and freezing phenomena J. Memb. Sci. 453, 419-424 (2014).
- [49] E. L. Thompson, T. W. Capehart, T. J. Fuller, J. Jorne, Investigation of Low-Temperature Proton Transport in Nafion Using Direct Current Conductivity and Differential Scanning Calorimetry, J. Electrochem. Society 153, A2351-A2362 (2006).
- [50] Zh. Wan, H. Chang, Sh. Shu, Y. Wang, and H. Tang, A Review on Cold Start of Proton Exchange Membrane Fuel Cells, Energies 7, 3179-3203 (2014).
- [51] E. Allahyarov, P. L. Taylor, H. Löwen, Enhanced ionic diffusion in ionomer-filled nanopores, J. Chem. Phys. 143, 243126 (1-10) (2015).
- [52] P. Kumar, S. V. Buldyrev, F. W. Starr, N. Giovambattista, and H. E. Stanley, Thermodynamics, structure, and dynamics of water confined between hydrophobic plates, Phys. Rev. E 72, 051503 (1-12) (2005).
- [53] B. Sulbaran, W. Olivares-Rivas, P. J. Colmenares, Transverse ion diffusion inside fixed charge narrow pores, Cond. Matter Physics 8, 303-316 (2005).
- [54] B. Jönsson, H. Wenneström, Micellar Solutions and Microemulsions, chapt. 3, eds. S. H. Chen, R. Rajagopalan, Springer-Verlag, New York (1990).
- [55] E. Allahyarov, P. L. Taylor, H. Löwen, Simulation Study of Sulfonate Cluster Swelling in Ionomers, Phys. Rev. E 80, 061802 (1-12) (2009).
- [56] E. Spohr, MD simulations of proton transfer in a model nafion pore, Mol. Simul. 30, 107-115 (2004).
- [57] S. S. Jang, V. Molinero, T. Cagin, W. A. Goddard III, Nanophase-segregation and transport in nafion 117 from molecular dynamics simulations: effect of monomeric sequence, J. Phys. Chem. B, 108, 3149-3157 (2004).
- [58] R. Jinnouchi, K. Okazaki, MD study of transport phenomena in perfluorosulfonate ionomer membranes for polymer electrolyte fuel cells, J. Electrochem. Soc. 150, E66-E73 (2003).
- [59] T. li, A. Wlaschin, and P. B. Balbuena, theoretical studies of proton transfer in water and model polymer electrolyte systems, Ind. Eng. Chem. Res. 40, 4789-4800 (2001).
- [60] S. Urata, J. Irisawa, A. Takada, W. Shinoda, S. Tsuzuki, and M. Mikami, Molecular dynamics simulation of swollen membrane of perfluorinated ionomer, J. Phys. Chem. B 109, 4269-4278 (2005).
- [61] A. Vishnyakov, A. V. Neimark, Molecular Dynamics Simulation of Nafion Oligomer Solvation in Equimolar Methanol−Water Mixture, J. Phys. Chem. B 105, 9586-9594 (2001).
- [62] M. N. Tsampas, A. Katsaounis, C. G. Vayenas, The effect of membrane thickness on the conductivity of Nafion, Electrochimica Acta 51, 2743-2755 (2006).
- [63] J.-Ch. Perrin, S. Lyonnard, and F. Volino, Quasielastic Neutron Scattering Study of Water Dynamics in Hydrated Nafion Membranes, J. Phys. Chem. C 111, 3393-3404 (2007).
- [64] P. Choi, N. H. Jalani, R. Datta, Thermodynamics and proton transport in Nafion, J. Electrochemical Society 152, E123-E130 (2005).
- [65] M. Eikerling, A. A. Kornyshev, Proton transfer in a single pore of a polymer electrolyte membrane, J. Electroanalytical Chemistry 502, (1-14) (2001).
- [66] D. Marx, Proton transfer 200 years after von Grotthuss: insights from ab initio simulations, Chem. Phys. Phys. Chem. 7, 1848-1870 (2006).
- [67] E. Spohr, A. A. Kornyshev, P. Commer, Enhancing proton conductivity in PEM: lessons from Molecular Dynamics, J. Phys. Chem. B 106, 10560-10569 (2002).
- [68] S. Yamamoto, R. Jinnouchi, Sh. Yamakawa, Sh. Hyodo, 14th International Conference on the Properties of Water and Steam, Kyoto, Japan, 411 (2004).
- [69] E. Allahyarov, P. L. Taylor, Simulation study of the equilibrium morphology in ionomers with different architectures, J. Polymer Sci. B: Polymer Physics 49, 368-376 (2011).
- [70] E. Allahyarov, P. L. Taylor, Role of electrostatic forces in cluster formation in a dry ionomer, J. Chem. Phys. 127, 154901-154912 (2007).
- [71] E. Allahyarov, P. L. Taylor, Simulation Study of the Correlation between Structure and Conductivity in Stretched Nafion, J. Phys. Chem. B. 113, 610-617 (2009).
- [72] S. J. Paddison, T. A. Zawodzinski, Molecular modeling of the pendant chain in Nafion, Solid State Ionics 113-115, 333-340 (1998).
- [73] M. W. Mahoney and W. L. Jorgensen, A five-site model for liquid water and the reproduction of the density anomaly by rigid, nonpolarizable potential functions, J. Chem. Phys. 112, 8910-8922 (2000).
- [74] A. A. Kornyshev, A. M. Kuznetsov, E. Spohr, J. Ulstrup, Kinetics of proton transport in water, J. Phys. Chem. B 107, 3351-3366 (2003).
- [75] A. A. Kornyshev, E. Spohr, Proton transport in polymer electrolyte membranes using theory and classical molecular dynamics, Topics in Applied Physics 113, 349-363 (2009).
- [76] J. C. G. Montoro, J. L. F. Abascal, Ionic distribution around simple b-dna models. II. deviations from cylindrical symmetry, J. Chem. Phys. 109, 6200-6210 (1998).
- [77] M. Mazars, Lekner summations J. Chem. Phys. 115, 2955-2965 (2001).
- [78] N. Grönbech-Jensen, G. Hummer, and K. M. Beardmore, Lekner summation of Coulomb interactions in partially periodic systems, Mol. Phys. 92, 941-945 (1997).
- [79] G. J. Tjatjopoulos, D. L. Feke, J. A. Mann Jr., Molecule-micropore interaction potentials, J. Phys. Chem., 92, 4006-4007 (1988).
- [80] Y. W. Tang, I. Szalai, K. Y. Chan, Diffusivity and conductivity of a solvent primitive model electrolyte in a nanopore by equilibrium and nonequilibrium molecular dynamics simulations, J. Phys. Chem. A 105, 9616-9623 (2001).
- [81] P. L. Taylor, B. C. Xu, F. A. Oliveira, T. P. Doerr, Dielectric screening of Coulomb interactions in polymers, Macromolecules 25, 1694-1698 (1992).
- [82] P. Kumar, F. W. Starr, S. V. Buldyrev, and H. E. Stanley, Effect of water-wall interaction potential on the properties of nanoconfined water, Phys. Rev. E 75, 011202 (1-8) (2007).
- [83] B. Medasani, Z. Ovanesyan, D. G. Thomas, M. L. Sushko, M. Marucho, Ionic asymmetry and solvent excluded volume effects on spherical electric double layers: A density functional approach, J. Chem. Phys. 140, 204510 (1-17) (2014).
- [84] A. A. Chialvo, P. T. Cummings, M. Simonson and R. E. Mesmer, Solvation in high-temperature electrolyte solutions. I. Hydration shell behavior from molecular simulation, J. Chem. Phys. 110, 1064-1074 (1999).
- [85] S. Walbran, A. A. Kornyshev, Proton transport in polarizable water, J. Chem. Phys. 114, 10039-10048 (2001).
- [86] U. W. Schmitt, G. A. Voth, Multistate empirical bond model for proton transport in water, J. Phys. Chem. B 102, 5547-5551 (1998).
- [87] B. Mukherjee, P. K. Maiti, Ch. Dasgupta, and A. K. Sood, Single-File Diffusion of Water Inside Narrow Carbon Nanorings ACS Nano 4, 985-991 (2010).
- [88] A. Striolo, Water self-diffusion through narrow oxygenated carbon nanotubes, Nanotechnology 18, 475704 (1-10) (2007).
- [89] A. Striolo, The Mechanism of Water Diffusion in Narrow Carbon Nanotubes, Nano Letters 6, 633-639 (2006).
- [90] S. Joseph, N. R. Aluru Why Are Carbon Nanotubes Fast Transporters of Water?, Nano Letters 8, 452-458 (2008).
- [91] Ch. Dellago, M. M. Naor, and G. Hummer, Proton Transport through Water-Filled Carbon Nanotubes, Phys. Rev. Letters 90, 105902 (1-4) (2003).
- [92] N. P. Blake, M. K. Petersen, G. A. Voth, and H. Metiu, Structure of Hydrated Na-Nafion Polymer Membranes, J. Phys. Chem. B 109, 24244-24253 (2005).
- [93] S. Kerisit, and Ch. Liu, Molecular Simulations of Water and Ion Diffusion in Nanosized Mineral Fractures, Environ. Sci. Technol. 43, 777-782 (2009).
- [94] The Figure 13a for the run C1 and the Figure 10a for the run B2 are the same.
- [95] S. M. Bhattacharjee, A. Giacometti, and A. Maritan, Flory theory for polymers, J. Phys. : Condensed Matter 25, 503101-503132 (2013).
- [96] J. Isaacson, T. C. Lubensky, Flory exponents for generalized polymer problems, J. Physique Lettres 41, 469-471 (1980).
- [97] M. Daoud, J. F. Joanny, Conformation of branched polymers, J. Physique 42, 1359-1371 (1981).
- [98] K. D. Kreuer, S. J. Paddison, E. Spohr, M. Schuster, Tansport in proton conductors for fuel-cell applications: simulations, elementary reactions and phenomenology, Chem. Rev. 104, 4637-4678 (2004).
- [99] K. Krynicki, C. D. Green, and D. W. Sawyer, Pressure and temperature dependence of self-diffusion in water, Faraday Discuss. Chem. Soc. 66, 199-208 (1978).
- [100] N. Agmon, The Grotthuss mechanism, Chem. Phys. Letters 244, 456-462 (1995).
- [101] A. Zawodzinski, T. E. Springer, J. Davey, R. Jestel, C. Lopez, J. Valerio, S. Gottesfeld, The water content dependence of electro-osmotic drag in proton-conducting polymer electrolytes, Electrochem. Acta 40, 297-302 (1995).
- [102] F. Volino, J.-C. Perrin, and S. Lyonnard, Gaussian model for localized translational motion: application to incoherent neutron scattering, J. Phys. Chem. B 110, 11217-11223 (2006).
- [103] S. Cui, J. Liu, M. E. Selvan, S. J. Paddison, D. J. Keffer, B. J. Edwards, Comparison of the hydration and diffusion of protons in perfluorosulfonic acid membranes with molecular dynamics simulations, J. Phys. Chem. B 112, 13273-13284 (2008).
- [104] H. Sun, M. Yu, Z. Li, S. Almheiri, A Molecular Dynamic Simulation of Hydrated Proton Transfer in Perfluorosulfonate Ionomer Membranes (Nafion 117), J. Chemistry 2015, 1-10 (2015).
- [105] D. Sritharan, E. Smela, Fabrication of a Miniature Paper-Based Electroosmotic Actuator, Polymers 8, 400 (1-23) (2016).
- [106] E. Detsi, P. Onck, J. T. De Hosson, Metallic muscles at work: high rate actuation in nanoporous gold/polyaniline composites, ACS Nano 28, 4299-4306 (2013).
- [107] E. Allahyarov, L. Zhu, H. Löwen, Analysis of the actuation properties of charged multilayer films, J. Applied Physics 117, 034504 (1-14) (2015).
- [108] E. Allahyarov, H. Löwen, L. Zhu, A simulation study of the electrostriction effects in dielectric elastomer composites containing polarizable inclusions with different spatial distributions, Phys. Chem. Chem. Phys. 17, 32479-32497 (2015).
- [109] E. Allahyarov, H. Löwen, L. Zhu, Dipole correlation effects on the local field and the effective dielectric constant in composite dielectrics containing high-k inclusions, Phys. Chem. Chem. Phys. 18 19103-19117 (2016).
- [110] H. Xiang, K. Shin, T. Kim, S. I. Moon, Th. J. McCarthy, Th. P. Russell, Block copolymers under Cylindrical Confinement Macromolecules 37, 5660-5664 (2004).
- [111] G. Srinivas, D. E. Discher, and M. L. Klein, Self-assembly and properties of diblock copolymers by coarse-grain molecular dynamics, Nature Materials 3, 638-644 (2004).
- [112] D. I. Dimitrov, A. Milchev, K. Binder, D. W. Heermann, Structure of Polymer Brushes in Cylindrical Tubes: A Molecular Dynamics Simulation, Macromol. Theory Simul. 15, 573-583 (2006).
- [113] A. G. Koutsioubas, N. Spiliopoulos, D. L. Anastassopoulos, A. A. Vradis, and Ch. Toprakcioglu, Formation of polymer brushes inside cylindrical pores: A computer simulation study, J. Chem. Phys. 131, 044901 (1-7) (2009).