Spectral multiplexing using stacked VPHGs - Part I
Abstract
Many focal-reducer spectrographs, currently available at state-of-the art telescopes facilities, would benefit from a simple refurbishing that could increase both the resolution and spectral range in order to cope with the progressively challenging scientific requirements but, in order to make this update appealing, it should minimize the changes in the existing structure of the instrument. In the past, many authors proposed solutions based on stacking subsequently layers of dispersive elements and record multiple spectra in one shot (multiplexing). Although this idea is promising, it brings several drawbacks and complexities that prevent the straightforward integration of a such device in a spectrograph. Fortunately nowadays, the situation has changed dramatically thanks to the successful experience achieved through photopolymeric holographic films, used to fabricate common Volume Phase Holographic Gratings (VPHGs). Thanks to the various advantages made available by these materials in this context, we propose an innovative solution to design a stacked multiplexed VPHGs that is able to secure efficiently different spectra in a single shot. This allows to increase resolution and spectral range enabling astronomers to greatly economize their awarded time at the telescope. In this paper, we demonstrate the applicability of our solution, both in terms of expected performance and feasibility, supposing the upgrade of the Gran Telescopio CANARIAS (GTC) Optical System for Imaging and low-Intermediate-Resolution Integrated Spectroscopy (OSIRIS).
keywords:
instrumentation: spectrographs - techniques: spectroscopic - telescopes - methods: observational1 Introduction
The current state-of-the-art spectroscopic facilities could be divided in two main groups depending on the resolution. The first one is characterized by a low resolution (R < 2000), particularly suitable for multi-object spectroscopy or Integral Field Unit (IFU). Among them we can find examples like ESO VIMOS (Le Fèvre et al., 2003), FORS1-2 (Appenzeller et al., 1998), MOSFIRE (McLean et al., 2012), the FOSC at ESO-NTT (Snodgrass et al., 2008; Buzzoni et al., 1984) or OSIRIS at GTC (Cepa, 2010). The second one is featured by a high resolution (R 4000), which is guaranteed through diffractive elements like echelle or echellette grating. Among this group, successfully examples are HIRES at Keck (Vogt, 2002), ESO UVES (Dekker et al., 2000), CRIRES (Käufl, 2008) or the most recent ESO X-SHOOTER (Vernet et al., 2011).
The resolution plays a key role in the era of 10 m class telescopes since the only way to increase the sensitivity of a spectrum, in terms of detectable features and accuracy, is to increase it as much as possible while maintaining a good signal-to-noise ratio (SNR) over a wide spectral range. Current focal reducer spectrographs, like the GTC-OSIRIS, already provide diffraction gratings that allow to secure spectra with R 2000 but, unfortunately, their spectral range is very narrow. Therefore, to obtain a spectrum from 4000 to 10000 Å, it would require to observe the same source multiple times, thus wasting an enormous amount of awarded time. On the other hand, deciding to operate in alternative facilities based on echelle gratings (e.g. ESO-XSHOOTER or Keck-ESI), a scientist could secure spectra with wide wavelength coverage at high resolution (R 4000). Nevertheless, spectrographs like GTC-OSIRIS or EFOSC are much simpler, widely diffused in a large number of optical telescopes and with a flexible design that includes imaging capabilities. Therefore, an improvement of these facilities that allow to fill the gap between the two layouts is really attractive.
In most astrophysical topics, the increase of the resolving power of secured spectra permits to achieve many scientific advantages. For example, the use of ESO-XSHOOTER spectrograph produced a vast number of spectra of QSOs at R > 5000, allowing to better understand the physical state and chemical composition of the IGM (López et al., 2016; D’Odorico et al., 2013, 2016). Another interesting topic tackled with the same instrument is the determination of the redshift of BL Lac objects. These sources are active nuclei of massive elliptical galaxies whose emission is dominated by a strong non-thermal continuum (Falomo et al., 2014; Shaw et al., 2013; Massaro et al., 2016; Sandrinelli et al., 2013) that prevents the determination of their distance that is, however, mandatory for constraining models of their emission or to better understand absorption of hard -rays by Extragalactic Background Light (EBL). In fact for example, Pita et al. (2014); Landoni et al. (2014) demonstrated that this problem could be mitigated by securing spectra with high SNR and increased resolution to detect fainter spectral features, necessary to estimate the redshift (and thus the distance) of the source.
As already pointed out, it is possible to collect spectra of astrophysical sources at high resolution (R > 4000) with focal reducer instruments but the price to pay is a limited spectral range. A clever solution could be the substitution of the single high R element, whose range is limited, with a new dispersive device capable to increase spectral coverage, simultaneously recording multiple high R spectra in different ranges (multiplexing). Being able to deliver such dispersive element will achieve a great improvement of the expected throughput of already commissioned spectrographs. In this paper, we focus on the GTC-OSIRIS as a candidate and demonstrator for housing our innovative device. In particular, we report on two different cases. The first one allows to secure two spectra in a single shot increasing the resolution by a factor of 2 while the second challenges instruments like X-SHOOTER combining three high resolution spectral regions simultaneously. This work is organized as follows: in Section 2 we report on the theoretical background and the design principle of these multiplexed devices. In Section 3 we discuss the expected performances on the sky through simulations, while in Section 4 we give our conclusions.
2 Grating Multiplexing – theory and applicability
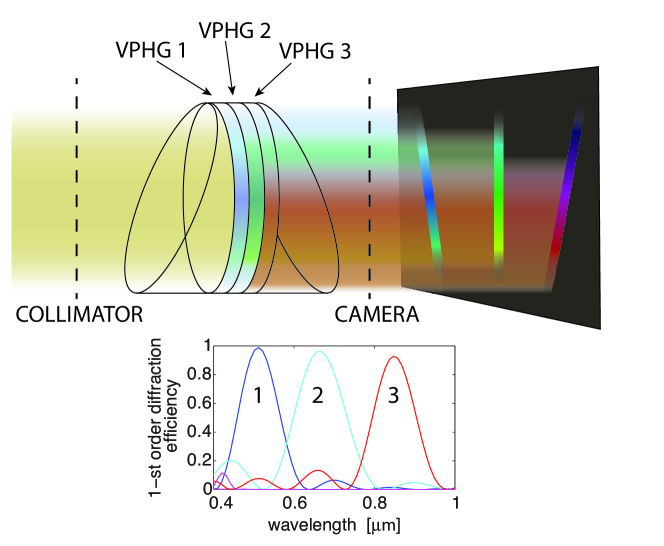
As highlighted in the introduction, being able to simultaneously record multiple spectra of wavelength ranges, or alternatively, to have a high resolution element that covers a very wide spectral range, brings a huge advantage to the astronomical community. In particular, depending on the optical layout, a spectrograph would benefit of the possibility to increase the resolution or the spectral range, maintaining the same exposure times. Otherwise, a typical focal reducer imager, like FORS or OSIRIS, would benefit from the combination of very low dispersion gratings to acquire multiple snapshots of the same field in different bands simultaneously, as depicted in the cartoon of Figure 1.
In the present study we have tried to answer to these needs, testing the feasibility of a new type of dispersive element, that can result in a huge technological boost for those instruments that are becoming obsolete and for the new ones that are yet to be built.
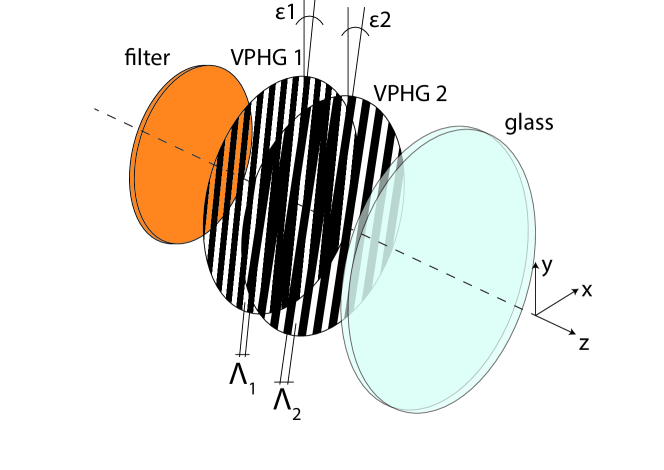
The general idea is to place multiple gratings (multiplexed), stacked subsequently, in a way that they will produce simultaneously spectra of different wavelength regions. The basic concept of a transmissive element is sketched in Figure 2.
Each spectrum in the instrument’s detector is designed to cover a specific wavelength range, according to the scientific case that has to be studied. Consequently, the design phase is indeed a crucial part in the definition of the characteristics of the multiplexed dispersive element. Moreover, strategies to separate the spectra avoiding their overlapping should be considered.
In this particular configuration, since the grating layers are superimposed, the key idea is to apply a small rotation along optical axis ( in Figure 2) between the layers, in order to separate (along the y direction) the different spectra appearing on the detector.
Being able to secure multiple spectra with one exposure, the analyzed spectral range is extended (maintaining the same resolution R) or the resolution of the system in the same spectral range is significantly increased. This system is therefore suitable for upgrading an already built instrument, giving a great enhancement by a simple replacement of the dispersive element, which preserves all the existing abilities (e.g. the imaging in FOSC).
The type of dispersive element that we have considered in this study is the transmissive Volume Phase Holographic Grating, VPHG (Barden et al., 1998). They consist in a periodic modulation of the refractive index (n) in a thin layer of a photosensitive material. These elements represent today the most used dispersive elements in astronomy and yet the element whose performances are most difficultly surpassed in both low and medium resolution spectrographs (Spanò et al., 2006; Baldry et al., 2004; Pazder & Clemens, 2008).
Since many different VPHGs are usually integrated inside astronomical spectrographs and each of them is a custom designed grating, each astronomical observation can take advantage of specific dispersive elements with features tailored for achieving the best performances. Accordingly, the design and manufacturing of highly efficient and reliable VPHGs require photosensitive materials where it is possible to control both the refractive index modulation and the film thickness , in order to tune the device’s efficiency.
Regarding the holographic materials, up to now Dichromated Gelatins (DCG) is considered the reference material thanks to the very large modulation of the refractive index that can be stored (Liang-Wen et al., 1998; Bianco et al., 2012), which turns into relative large bandwidth in high dispersion gratings. Unfortunately this material requires a complex chemical developing process making it difficult for large scale and large size production. Moreover, the material is sensitive to humidity, therefore, it is necessary to cover the grating with a second substrate, burdening the control of the wavefront error.
The availability of holographic materials with similar performances, but with self-developing properties is desirable, because they will not require any chemical post-process and moreover, the n formation could be monitored and set during the writing step.
Photopolymers are a promising class of holographic materials and today, they are probably the best alternative to DCG, thanks to the improved features in terms of refractive index modulation, thickness control and dimension stability (Lawrence et al., 2001; Bruder et al., 2011; Ortuño et al., 2013; Fernández et al., 2015). A lot of studies have been carried out to understand deeply the behavior of this class of materials. Moreover, the formation of the refractive index modulation has been recently studied (Gleeson & Sheridan, 2009; Gleeson et al., 2011; Li et al., 2014a, b), through the development of models that predict the trends as function of the material properties and writing conditions (Kowalski & McLeod, 2016).
We already demonstrated in other papers the use of photopolymers for making astronomical VPHGs with performances comparable to those provided by VPHGs based on DCGs and good aging performances (Zanutta et al., 2014a), but with a much simpler production process (Zanutta et al., 2016b). Therefore, we think that the big advantages of this novel holographic material could be the key point to realize the multiplexed dispersive element.
The newly (Bruder & Fäcke, 2010; Berneth et al., 2011, 2013) developed photopolymer film technology (Bayfol HX® film) evolved from efforts in holographic data storage (HDS) (Dhar et al., 2008) where any forms of post processing is unacceptable. These new instant developing recording media open up new opportunities to create diffractive optics and have proven to be able to record predictable and reproducible optical properties (Bruder et al., 2009). Depending on the application requirements, the photopolymer layer can be designed towards e.g. (high or low) index modulation, transparency, wavelength sensitivity (monochromatic or RGB) and thickness to match the grating’s wavelength and/or angular selectivity.
Since the material consists in the holographic layer coupled with a polymeric substrate with a total thickness of ca. 60 - 150 m, it can be laminated or deposited one on top of the other after having been recorded, making straightforward the stacking realization.
Clearly, another possibility is to holographically record multiple gratings inside the same layer but, as described later, in order to optimize the efficiency curves, usually very different thicknesses are required for each grating, therefore this strategy will not let us have the advantage to tune the response curves in the design process.
2.1 Working principle
As stated at the beginning of this section, the design concept consists in placing a set of transmission VPHGs stacked subsequently (multiplexed) (see Figure 2). As highlighted in the figures, this device will form one single optical element whose dimensions are comparable to standard VPHGs already available in the target instrumentation.
Some attempts have been made to explore this idea (Muslimov et al., 2016; Battey et al., 1996) but, although steps have been made in the right direction, the proposed solutions are limited by the necessity of a newly designed spectrograph, and do not take into consideration the crucial efficiency optimization that, without proper design, will make the device ineffective.
Hence, to preserve integration simplicity, one has to mix materials, design strategies and required performances, in order to produce multiplexed dispersive elements that could be easily integrated in an available instrument. This gives to astronomers the possibility to enhance the resolution (and spectral coverage) by simply replacing the disperser already installed in the optical path.
Regarding the material, thanks to the crucial capability to finely tune the refractive index modulation n (Zanutta et al., 2016a) and the slenderness of the film containing the grating, Bayfol HX® photopolymers by Covestro gave us the possibility to design the multiplexing element to:
- 1.
-
2.
tune the single stacked efficiency in such a precise way that they will not interfere with each other and obviate to all the problems related to the realization of these devices;
-
3.
match the design requirements and obtain high efficiency;
-
4.
stack multiple layers of gratings in one single device for the simultaneous acquisition of multiple spectra with a broad wavelength band.
In the multiplexed device, each layer will generate a portion of the spectrum that all together will compose the total dispersed range required. Such pieces, on the detector, will be disposed one on the top of each other, resulting in a total spectral range that is far wider than the one obtainable using a single grating with a comparable dispersion.
2.2 Issues in details: the geometrical effect
Although the stack of subsequent diffraction elements brings many advantages, some constraints and critical points arise and should be discussed.
The first one is purely a geometrical effect and is related to the propagation of the incoming beam throughout multiple dispersing elements that must not interfere with each other. For this reason, it has to be taken into account that the incoming beam is diffracted multiple times (since it encounters two or more dispersive elements) according to the grating equation
| (1) |
with the number of the diffracted order, the line density of the VPHG and , the incidence and diffracted angles respectively.
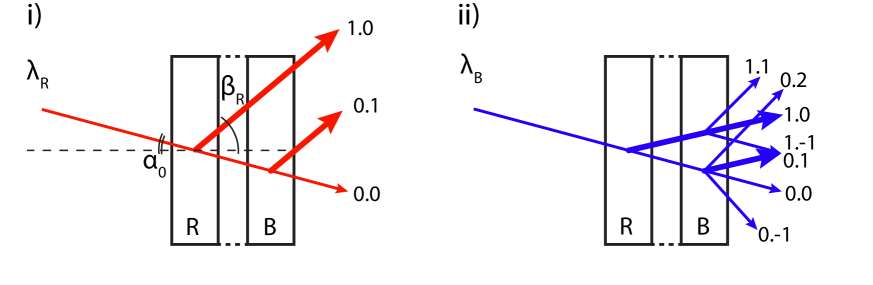
Fixing , different combinations of diffraction orders can occur, resulting in light diffracted in different directions. In particular let us consider for simplicity an example of two stacked multiplexed elements as shown in Figure 3. Each grating is optimized for dispersing efficiently a specific wavelength range (labelled B for blue and R for red). Let’s suppose that the two possess the same line density. If a red monochromatic wavelength (case i) enters the multiplexed device, it will be firstly diffracted by the R grating in all the possible orders, that will eventually enter the second grating. Each of these beams are in turn recursively diffracted by the B grating, but only few of them possess the correct direction for further propagation (total internal reflection TIR can occur) to the detector.
Otherwise, when a blue monochromatic beam is considered (case ii, for equal incidence angle) each diffracted order will possess a smaller diffraction angle (with respect of the previous case) due to the shorter wavelength, therefore it is possible that some overlapping between blue and red orders would occur since more diffraction orders have a direction that can potentially enter the detector.
2.3 Issues in details: the efficiency depletion due to subsequent gratings
In the design of VPHGs for an astronomical spectrograph, after having satisfied the dispersion and resolution requirements, which fix parameters like the line density () of the gratings and the incidence and diffraction angles ( and ), the optimization of the diffraction efficiency (both peak efficiency and bandwidth) is necessary.
To perform this task, the main parameters to be considered are:
-
1.
the refractive index modulation n;
-
2.
the active film thickness d;
-
3.
the slanting angle (i.e. the angle between the normal of the grating surface and the normal of the refractive index modulation plane).
Considering a sinusoidal refractive index modulation, and working in the Bragg regime (the light is sent only in one diffraction order other than the zero), the well-known Kogelnik model can be used to compute the gratingÕs efficiency (Kogelnik, 1969). For small angles, large diffraction efficiency is achieved when the product n is equal to half of the wavelength and this is the starting point in the optimization process. As already stressed, during the VPHG design, not only the peak efficiency is important, but also the efficiency at the edges of the spectral range. According to the Kogelnik model, the spectral bandwidth () of the diffraction efficiency curve is proportional to (Barden et al., 2000):
| (2) |
In this equation, is the incidence angle, is the line density of the grating and it is evident that the bandwidth is inversely proportional to and the thickness of the grating . Hence, the optimization of the diffraction efficiency curves, acting on the n and , provides large differences in the grating response.
If a grating works in the Bragg regime, the largest peak efficiency and bandwidth is obtained for very thin films and large n. Undoubtedly, the n upper value is determined by the performances of the holographic material. If the VPHG works in the Raman-Nath regime (Moharam & Young, 1978), it diffracts the light with a non-negligible efficiency in more than one diffraction order and this is the case of low dispersion gratings and should be considered to avoid the further explained second order contamination (see Section 2.4).
For such gratings, the light diffracted in high orders is proportional to n2, ergo it is better to increase the film thickness and reduce the n in order to achieve a large peak efficiency.
The availability of an holographic material that can exploit a precise ability to tune the n (Zanutta et al., 2014b, 2016b), is therefore crucial for the design of multiplexed elements, in order to be able to adjust the efficiency response of each dispersive layer.
In the multipexing context, it is important to evaluate how a grating with a certain efficiency affects the response of the following one. In order to give a feeling of the complexity of the problem, let us reconsider the two-multiplexing device in Figure 3. The total multiplexed efficiency on the detector will not merely be the sum of the single layer efficiencies , , with the wavelength and the initial incidence angle.
The notation "1st" indicates the diffraction order at which the efficiency refers to, meaning that the system is aligned to work out the 1st order.
The spectrum generated by the R grating, before reaching the detector, has to pass through the B grating, and this will eventually diminish its intensity. To complicate that, we add the fact that each wavelength of the R spectrum possess different diffraction angles (which became the incidence angles for the B grating) and therefore this varies the response from the second grating, according to the grating equation (eq. 1). The resulting R efficiency will be then:
| (3) |
Moreover, the light that enters the second layer has already been processed by the previous gratings, therefore, its final efficiency will be the product of the leftover intensity, times the efficiency of the B grating:
| (4) |
Practically, the goal is to obtain gratings with negligible overlapping efficiencies.
2.4 Issues in details: spectral range and Second Order Contamination
A critical point in spectroscopy is the contamination of recorded spectra, usually obtained through the first diffraction order, by light coming from other diffraction orders, usually the second. Since signals of the different orders are overlapped, there is no possibility to remove the unwanted light a posteriori with data reduction. Therefore, dispersive elements with spectral range greater than to will inevitably suffer of this problem.
This issue is well known in astronomy and it is usually avoided by placing order-sorting filters coupled with the dispersing element or in a filter wheel in the optical path of the instrument. The filters serve to block the light at lower wavelength that can overlap to the acquired spectrum. Another approach is to reduce as much as possible the efficiency of the unwanted orders.
Although in VPHGs, it is possible to mitigate these effect by varying parameters, such as thickness and n, in order to finely tune the efficiency curve, we decided to limit the wavelength range of the multiplexed device, adopting a spectral band where no contamination occurs. However, we will show another strategy that deals with the second orders in the forthcoming "Part II" of this work.
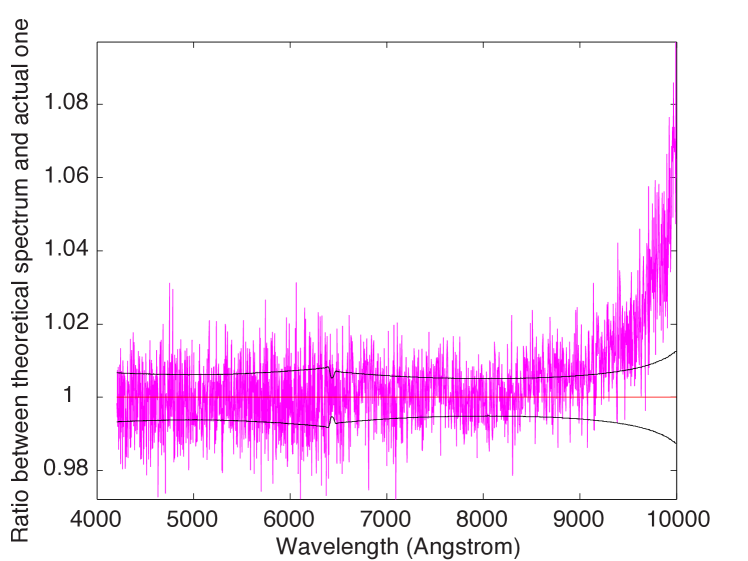
In Figure 4 we report the effects of second order contamination with a multiplexed device designed to work in an extended wavelength range [4200 - 10000 ]. We have simulated two different spectra: the first one contaminated with photons coming from the second order, while the other one considering only the contributions from the first order. We also assumed a SNR of about 100. The ratio between the two signals (magenta line) is a rough estimation of how much unwanted light appears as a bump in the collected data. In fact, according to this figure, the ratio between the two is within the noise level (solid black lines) up to , indicating the two spectra are undistinguishable. Surpassing this wavelength the ratio is higher than the noise level, meaning that photons from the second order are superimposing in the spectrum.
3 Design concepts and expected performances
3.1 Theoretical framework
In order to understand the spectral behavior of a multiplexing dispersive element, we choose to study the feasibility of this system considering an astronomical instrument that could take advantage of the multiplexing technology.
The resolving power of a spectrograph, R (or simply resolution) is:
| (5) |
where is the length of the illuminated area on the grating by the collimated beam, is the angular slit width (projected on the sky) and is the diameter of the telescope. For a correct interpretation of the results, it has to be pondered that, the optical layout of the spectrograph (such as the ratio of telescope diameter and the collimated beam in the spectrograph) can be used as a rule of thumb to quantify the advantage of this approach.
In this paper we present the case of the focal reducer OSIRIS, installed at the 10 m telescope Gran Telescopio Canarias, as candidate facility for the on-sky commissioning of the multiplexed device. We have chosen to exploit two different case studies, changing the number of elements in the multiplexed device. A two-stacked multiplexed device with an approximate resolution of R 2000, and a three-stacked multiplexed device with a resolution of about R 5000. The first one was intended to compete with observations carried out at the same facility for the determination of redshift lower limit of the TeV -ray BL Lacertae (BL Lac) object S4 0954+258 (see Landoni et al. (2015a) and the next sections) while the second one is intended to be compared with medium-high state-of-the-art resolution spectrographs such as ESO-XSHOOTER (Vernet et al., 2011; López et al., 2016). In this section, we demonstrate the design and applicability of the two cases. For each of them, we present the analysis to determine the efficiency behavior, taking into account the dispersion and spectral range that each VPHG should show in relation to the instrument specifications. This activity is carried out both through optical ray-tracing and Rigorous Coupled Wave Analysis RCWA simulations (Moharam & Gaylord, 1981). The outputs of this calculation are the most suitable efficiency curves for each stack that will guarantee the higher overall diffraction efficiency and are computed varying the key parameters described in Section 2.3.
After the grating design, the subsequent step is to assess, through simulations, the expected on-sky performances of each device. Thus, we build up syntethic simulated spectra (starting from powerlaw model, as in the case of BL Lac, or template spectrum as in the case of QSO) of the targets according to the expected signal-to-noise ratio (SNR) in each pixel defined as:
| (6) |
where is the number of expected counts from the target source evaluated as:
| (7) |
where is the input spectrum in ph sec-1 cm-2 , A is the collecting area of the telescope, are the efficiencies of atmosphere transmission, telescope, spectrograph, multiplexed device and CCD (we consider a slit efficiency of about 0.80 arcsec) and is the total integration time. The quantity is evaluated in the same way considering a flat spectrum normalized in V o R band to a flux that corresponds to 21 mag arcsec-2, which is a typical value for the La Palma sky brightness. The read-out-noise (RON) of the detector is assumed equal to 7 e-/pix. For each simulation, we consider a seeing of 0.80 with a slit width of 0.60′′ to be comparable with the current available instrumentation specifications and performances (Cepa, 2010). The plate scale of the system is assumed to be 0.30 arcsec/pix while the efficiencies of the telescope and optics of the spectrograph are derived from literature (Cepa, 2010).
3.2 Two-multiplexed grating case
This first case that we took into consideration is a two stacked multiplexed device, for OSIRIS and in GRISM mode, that can cover in one single exposure a spectral range from 4000 to 8000 with a resolution of approximately 2000.
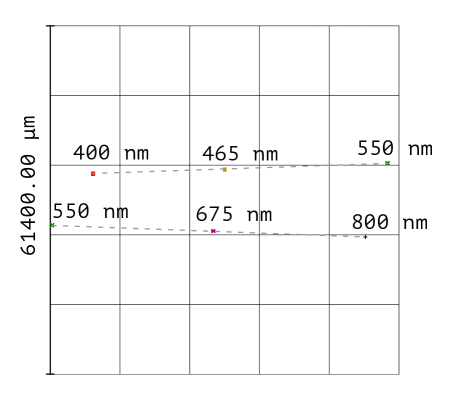
In order to achieve that, the dispersive element splits the wavelength range in two parts, that are imaged on the detector one on top of the other. The inter-spectra-separation depends on the tilt of the two gratings in the diffraction element. In this particular scenario, the minimum distance between the two is approximately 2’ (projected angle on the sky), but merely because we have chose arbitrarily a tilt value of 2.5¡ (see Figure 5). The two dispersive elements share the same prisms and thus the same incidence angle.
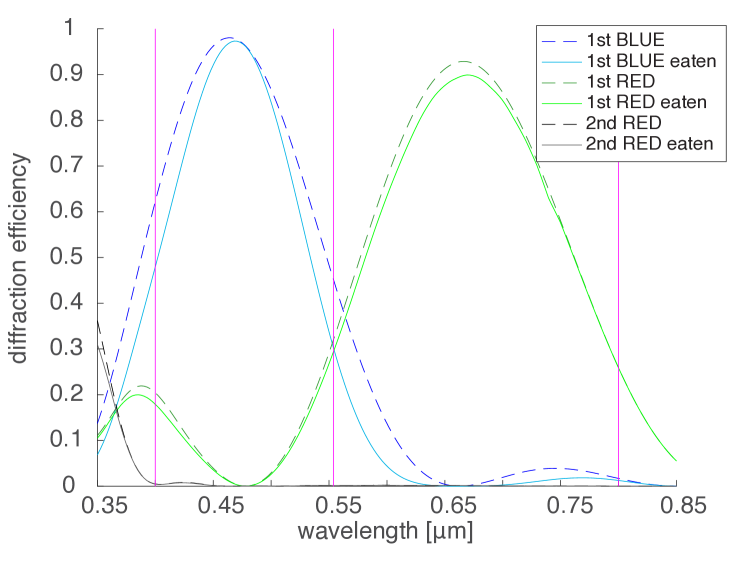
In Table 1 the specifications of the gratings that have been designed are reported, while in Figure 6 we presented the calculated efficiency curves of the layers that compose the device. With respect of this last figure, a long-pass filter at 4000 is installed in the device in order to avoid contamination from the second order. Moreover the VPHG, which disperses the light in the range 5500 - 8000 , has been designed to suppress as much as possible the contribution from the second order, which remains outside the spectral range.
As highlighted in the previous sections, an important effect that has to be taken into account is that the diffracted intensity will be dimmed as light gradually passes through the VPHG layers but, in this configuration, thanks to the precise design process, this effect is minimized. Indeed, for each grating layer, a specific value of n, and slanting angle was chosen in order to ensure the compatibility between the efficiency curves.
In the hypothesis that the sequence is first the RED grating and second the BLUE grating, the wavelengths that are diffracted by the RED grating (dotted green in Figure 6), are then transmitted through the BLUE layer with the resulting efficiency plotted in solid green. On the other hand, the wavelengths that have to be diffracted by the BLUE grating, must firstly pass though the RED layer, with a resulting efficiency that is plotted in solid blue.
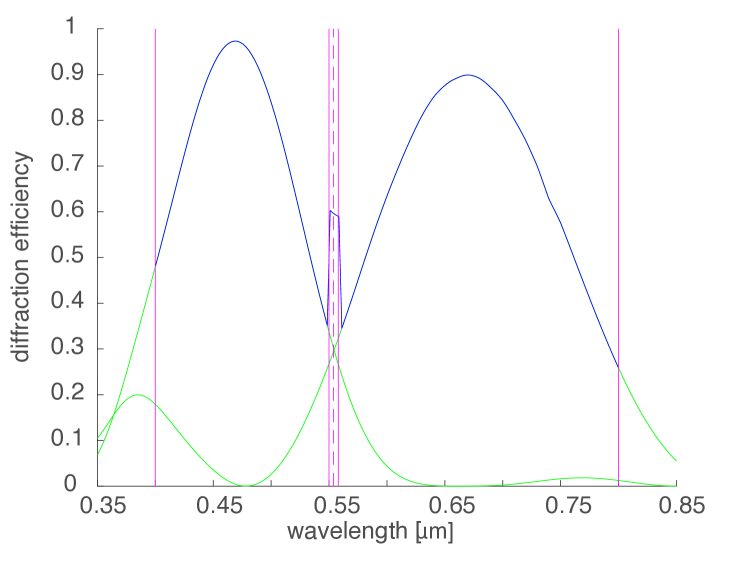
After accounting for all of these effects, the obtained efficiency curve for the multiplexed dispersive element is reported in Figure 7. The bump in the central region is due to light diffracted by both gratings and that falls on the detector in different places.
Finally we remind that the efficiencies presented in the simulations do not take into consideration the material absorptions or the reflection losses that could arise to the presence of interfaces inside the device. Nevertheless we expect that these effects could be negligible at this level and are of the order of few percent points.
| grating | l/mm | range | R0.6 | dispersion | |
|---|---|---|---|---|---|
| [nm] | [nm] | [Å/ px] | |||
| blue 2 | 1500 | 400-558 | 475 | 2232 | 0.52 |
| red 2 | 1000 | 550-800 | 675 | 2086 | 0.78 |
3.2.1 The case of S4 0954+65
S4 095465 is a bright BL Lac object identified for the first time by Walsh et al. (1984) which exhibits all the properties of its class. In particular, the source presents a strong variability in optical, with R apparent magnitudes usually ranging between 15 and 17 (Raiteri et al., 1999), linear polarisation (Morozova et al., 2014) and a radio map that shows a complex jet-like structure. This BL Lac has recently caught attention since it was detected with the Cherenkov telescope MAGIC with a 5- significance (Mirzoyan, 2015). The determination of redshift of BL Lac objects (in particular for TeV sources) is mandatory to assess their cosmological role and evolution, which appears to be controversial due to redshift incompleteness (Ajello et al., 2014) and to properly understand their radiation mechanism and energetics (see e.g Falomo et al. (2014) and references therein). When BL Lacs are detected at TeV regime, the knowledge of their distance is unavoidable since they could be exploited as a probe of the Extragalactic Background Light (EBL, see e.g Domínguez et al. (2011), Franceschini et al. (2008)) allowing to understand how extremely high energy photons propagate from the source to the Earth and interact with the EBL through - absorption. Unfortunately, the determination of the redshift of BL Lacs has proven to be difficult (see e.g. Shaw et al. (2013), Landoni et al. (2013), Massaro et al. (2016)) since their very faint spectral features are strongly diluted by their non-thermal emission (see the review of Falomo et al. (2014)).
In the era of 10 m class telescopes (like the GTC), the research in this field has reached the so called "photon starvation regime" since the only way to significantly increase the SNR is the adoption of extremely large aperture telescope (like ELT) (Landoni et al., 2013).
On the other end, one can greatly increase the resolution of the secured spectra, maintaining a high SNR, decreasing the minimum Equivalent Width (EWmin), allowing to measure fainter spectral features (see e.g. Sbarufatti et al. (2006), Shaw et al. (2013)).
In particular, S4 095465 has been observed by Landoni et al. (2015b) after its outburst on the night of February 28th, 2015. The object was observed with two grisms (R1000B and R1000R) in order to ensure a spectral coverage from 4200 to 10000 Å adopting a slit of 1.00′′ with a resolution of R 800. For each grism, the total integration time was 450s that corresponds to about 0.5 hrs of telescope allocation time (including overheads). The collected data allowed to disprove previous redshift claims of (Stickel et al., 1993; Lawrence et al., 1996) and to infer a lower limit to the distance of thanks to EW and SNR 100.
In order to further increase the lower limit to the redshift or, even better, detect faint spectral features arising from the host galaxies that harbors this BL-Lac, the only straightforward solution with this state-of-the-art instrumentation is to drastically increase the resolution of the collected spectrum.
Considering the case of GTC and OSIRIS, the only available opportunity is to observe the target with the GRISMs R2500. Unfortunately these gratings possess a very narrow spectral range so in order to ensure the wavelength coverage similar to the required (4000 - 8000 Å), one must collect four different spectra. This turns out in a telescope allocation time of about 2 hrs (including overheads).
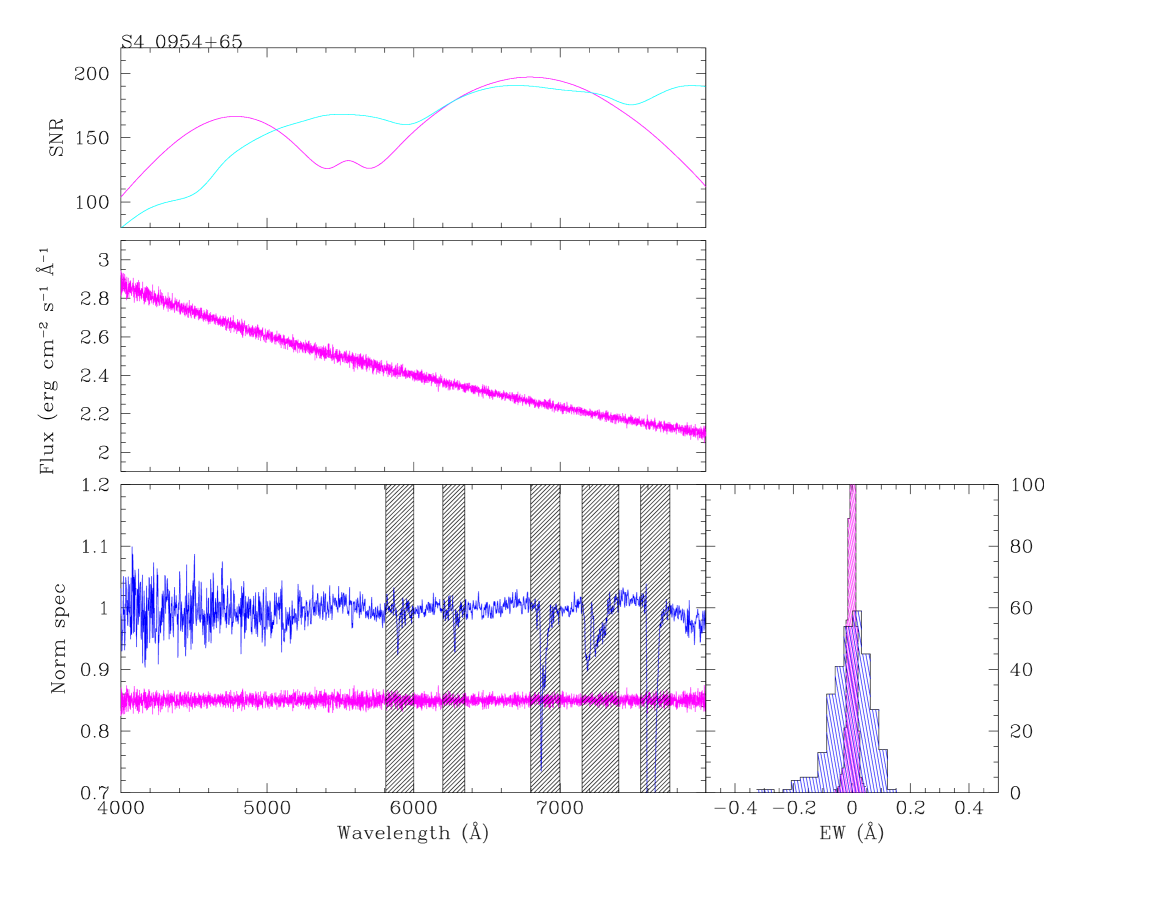
By the adoption of the two VPHG multiplexed device, the observer is able to collect simultaneously two spectra with a whole spectral range from 4000 to 8000 Å with a resolution of approximately 2000. The simulated spectra obtained with this device is reported in Figure 8 along with the comparison of the R1000B+R observed one.
We also report the distribution of minimum detectable Equivalent Width, estimated following the recipes detailed in Sbarufatti et al. (2005) (histogram in the bottom right corner of Figure 8).
The detectable EWmin on the spectrum simulated by assuming the new dispersing element is 0.03, which is a factor of 5 lower than the compared one. This turns in a lower limit to the redshift of putting the source at a plausible redshift region where the absorption from the EBL becomes severe and making this TeV object an excellent probe for the study of the EBL through absorption.
In this figure we also report the expected SNR obtained with our device (solid magenta in the top left box), and the one simulated assuming the currently available R2500 devices at the GTC.
3.3 Three-multiplexed grating case
For the science cases that require a wide spectral range with a moderate resolution, nowadays the only possibility to fulfill the requirements is to adopt an echelle grating based instrument, which is capable to secure wide wavelength ranges in a reasonable number of shots . Otherwise according to OSIRIS GRISMs specifications, in the GTC manual, up to six different setups (and exposures) are required to obtain the same result just in terms of spectral range, since the maximum resolution is approximately .
In this section we present a possible application of multiplexed VPHGs, aiming to refurbish the dispersive elements of OSIRIS at GTC, in order to reach the closest possible performance with respect to UV and VIS arm of X-SHOOTER.
In order to cover a wide spectral range with a resolution of approximately 4500, we have designed two multiplexed dispersive elements, each one composed by three stacked layers, therefore they will produce on the detector three spectra for each single exposure. With these two devices together, in just two exposures, we can cover a range from 3500 to 10000 .
While the number of dispersive layers could be theoretically further increased, due to complexities in calculations, possible transparency issues and manufacturing alignment, in this work we decided to set the limit to three elements.
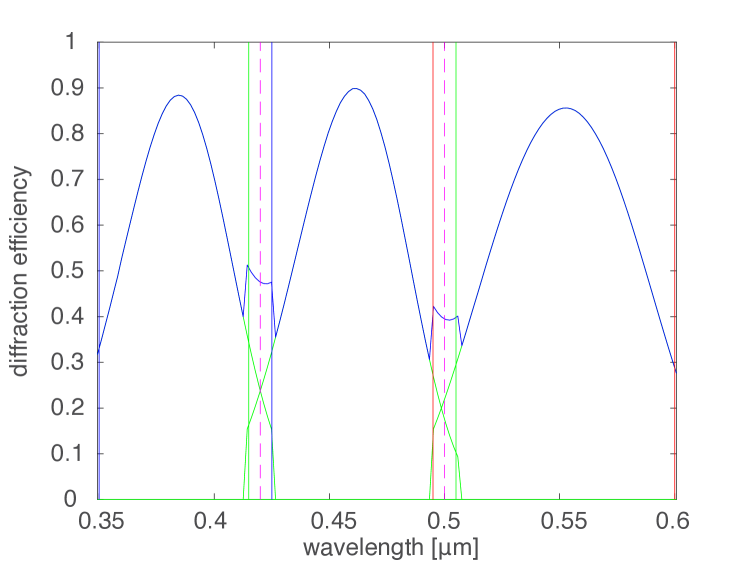
3.3.1 BLUE device, from 350 to 600 nm
The first (of two) multiplexed device will be responsible for the dispersion of the light in the range 3500 – 6000 , therefore hereafter it will be identified as the BLUE device. It is composed by three dispersing layers, each of them generating the peaks in the summed efficiency displayed in Figure 9 (solid blue curve). For this case, we did not report the plot with the contributions that generate the overall efficiency, since the general procedure is the same that in the two-multiplexed case. As highlighted in the previous case, the vertical solid lines identify the size of the detector with respect to each spectra: since the total range will appear divided in three parts, the upper is displayed with solid blue boundaries, the central with green and the lower with red. As some small portions of the range will overlap, bumps in efficiency in the regions between the peaks appear.
In Table 2, we report the specifications of the three gratings that have been designed for this BLUE element along with the calculated resolution and dispersion that is achievable integrating this device in the OSIRIS spectrograph.
| grating | l/mm | range | R0.6 | dispersion | |
|---|---|---|---|---|---|
| [nm] | [nm] | [Å/ px] | |||
| BLUE 3.1 | 2850 | 385 | 354-425 | 4339 | 0.24 |
| BLUE 3.2 | 2400 | 460 | 411-498 | 4430 | 0.29 |
| BLUE 3.3 | 1980 | 550 | 493-600 | 4346 | 0.35 |
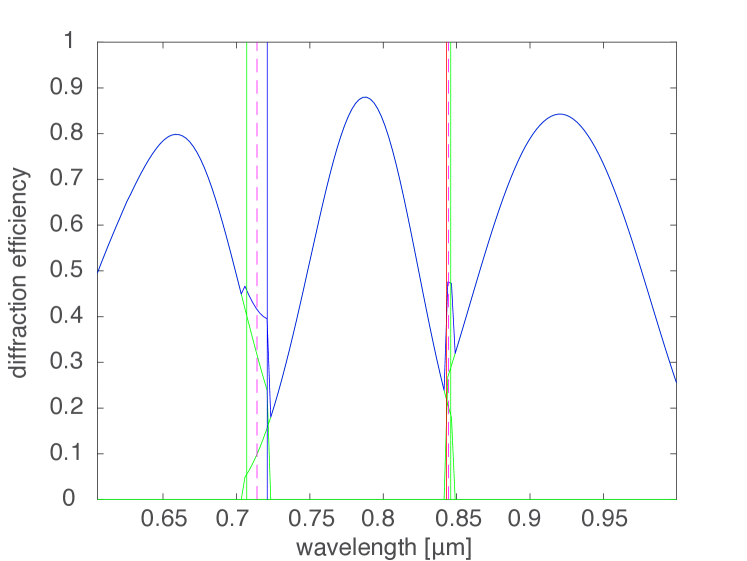
3.3.2 RED device, from 600 to 1000 nm
This second multiplexed device will be responsible to disperse the light in the spectral range from 6000 to 10000 , therefore hereafter it will be identified as the RED device. Figure 10 (solid blue curve) reports the overall efficiency curve that can be produced by the three dispersing layers composing this device.
In Table 3, we report the specifications of the gratings that have been designed for this RED element along with the calculated resolution and dispersion that is achievable integrating this device in the OSIRIS spectrograph.
| grating | l/mm | range | R0.6 | dispersion | |
|---|---|---|---|---|---|
| [nm] | [o] | [Å/ px] | |||
| RED 3.1 | 1750 | 655 | 605-721 | 4825 | 0.39 |
| RED 3.2 | 1480 | 775 | 707-846 | 4851 | 0.46 |
| RED 3.3 | 1240 | 920 | 843-1000 | 4814 | 0.55 |
3.3.3 Application to Extragalactic Astrophysics. The characterisation of Intergalactic medium
The study of the Intergalactic and Circumgalactic medium (IGM and CGM) is a powerful tool to investigate the properties of the cool (and clumpy) gaseous halos between the observer and the source, that lies at a certain . The only way to investigate the IGM or the CGM is through absorption lines imprinted in the spectra of distant QSO, as demonstrated in the last few years by e.g Prochaska et al. (2014); Landoni et al. (2016b); López et al. (2016) since its surface brightness is extremely faint to be probed directly, and only few examples are know to succeed in the detection of emission of Ly- lines in the CGM (e.g Arrigoni Battaia et al. (2015)). This research field is actively growing and, recently, has begun to probe not only the physical state and the chemical composition of the IGM but also the three-dimensional distribution of the gas allowing scientists to build up an actual tomography of the cool Universe between background quasars and the Earth. For example, in this context one of the most recent and successfully survey is the CLAMATO survey (Lee et al., 2014). In this projects, authors aims to to collect spectra for 500 background Lyman-Break galaxies (LBGs) in 1 sq degree area to reconstruct a 3D map with an equivalent volume of (100 h-1Mpc)3.
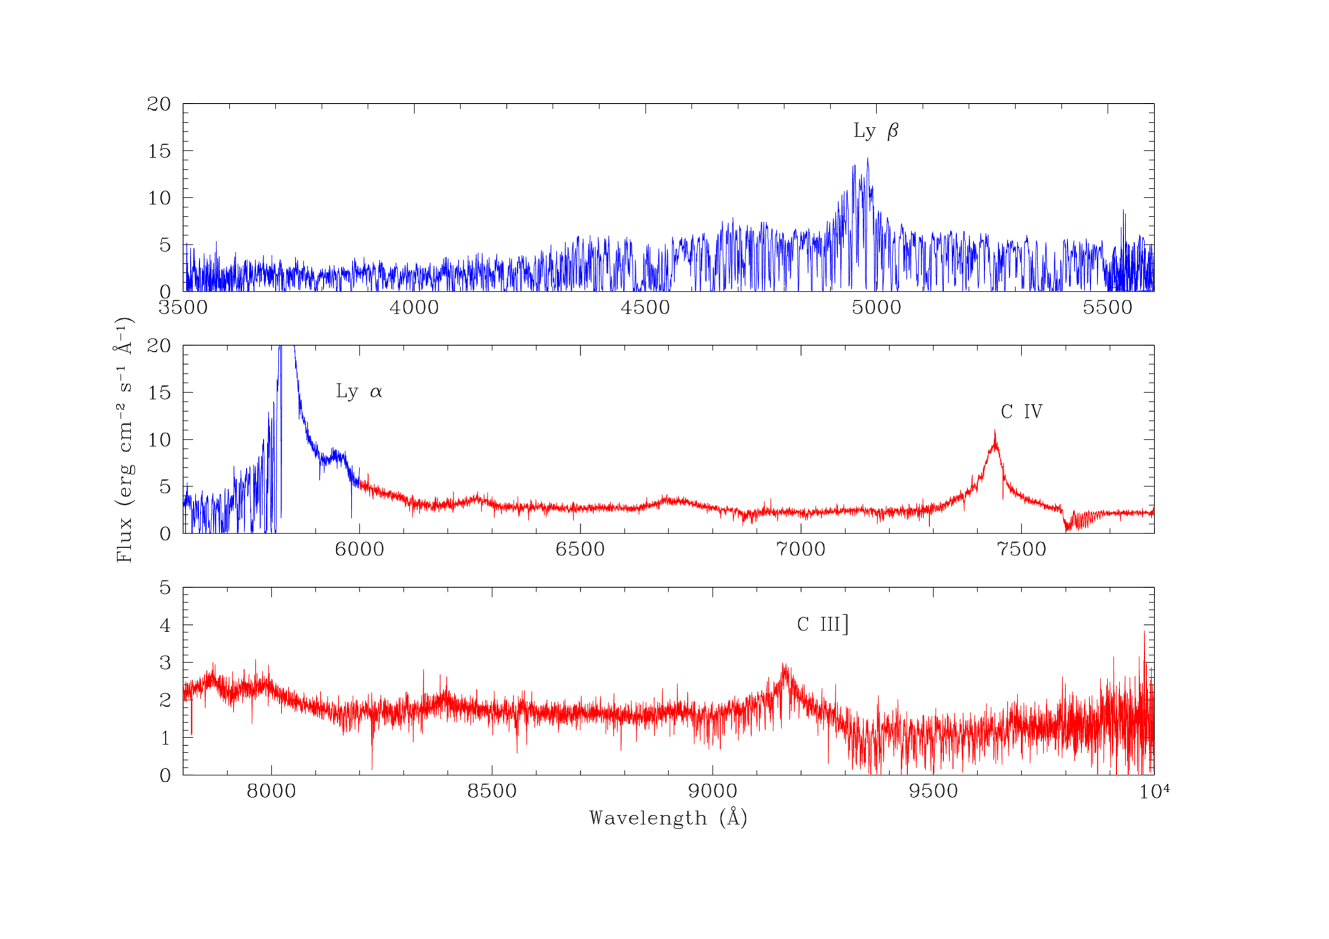
The key step in these spectroscopic studies is the availability of moderate-high resolving power (R 5000) and wide spectral coverage, in order to probe as much as possibile absorption lines, perform diagnostic ratio to probe the interplay between galaxies and the intergalactic medium (IGM). However, such observations are typically time consuming and require good SNR at moderate R, a particularly high challenge for distant QSOs which tend to be faint. For all of these reason, the availability of new instrumentation available to collect spectra in a wide spectral range (3500-1 m) at R > 4000 would be really advantageous allowing to further increase the availability of telescopes able to tackle these kind of surveys, especially for facilities with moderate telescope aperture. In order to demonstrate the applicability of our new device, we simulated the expected performance by assuming to observe for for each grating a QSO (template taken from López et al. (2016)) at redshift z = 3.78 with m. The overall obtained spectrum is reported in Figure 11. In particular the solid blue line corresponds to emission spectrum of the quasar secured with the BLUE multiplexed device. The absorption lines, imprinted by Lyman- intervening systems and used to probe the IGM, are clearly detected and resolved in most of the cases. The solid red line, instead, report the spectrum recorded with the RED multiplexed device where emission line from C IV and C III] are visibile. Results reported in Figure 11 are obtained with a total integration time of about 400s while, by comparison, to obtain the same results at half resolution with grisms available at GTC-OSIRIS would require more than 1000s, since it should be observed four times with 4 different gratings.
As highlighted in the previous paragraphs, the X-SHOOTER spectrograph is able to obtain similar results with a broader band in a single snapshot. Although this outcome is obviously outside the capabilities of our proposed solution, the multiplexing VPHG allows to cover in just two snapshot a comparable quality (in terms of R, SNR and spectral range) in the UV and visible band. Therefore, the integration of such element in a facility like OSIRIS would allow to scientifically compete with key-science projects that require spectroscopic capabilities otherwise available only with major instrument commissioning.
4 Conclusions
We have demonstrated the theoretical feasibility and the advantages of an innovative dispersive element, able to greatly increase the performances of the existing spectrograph at the state of the art 10 m telescope GTC. Thanks to the advantages derived by the adoption of the photopolymeric material considered in the simulations, we achieved to increase by at least a factor of two in terms of resolution (and thus in the spent observing time), without changes in the optical layout of the spectroscopic instrument. We have also shown that in the case of the three-multiplexed VPHG, it is possible to reach with GTC OSIRIS, approximately the performances of the UV and VIS arm of X-SHOOTER (when operating in medium resolution) in just two exposures of the same target. Even though in this work we have selected GTC OSIRIS for the simulations, the philosophy behind this multiplexing design could be applied to almost every focal reducer spectrograph, donating the discussed advantages to all the instruments, allowing them to handle scientific cases that would be otherwise out of reach for these facilities. In the forthcoming second part of this work, we will realize and integrate the multiplexed device in a spectrograph for science verification, focusing on the observational cases highlighted in the simulations in this paper.
Acknowledgements
This work was partly supported by the European Community (FP7) through the OPTICON project (Optical Infrared Co-ordination Network for astronomy) and by the INAF through the TECNO-INAF 2014 ÒInnovative tools for high resolution and infrared spectroscopy based on non-standard volume phase holographic gratingsÓ.
References
- Ajello et al. (2014) Ajello M., Gasparrini D., Romani R. W., Shaw M. S., 2014, in American Astronomical Society Meeting Abstracts #224. p. 410.09
- Appenzeller et al. (1998) Appenzeller I., et al., 1998, The Messenger, 94, 1
- Arrigoni Battaia et al. (2015) Arrigoni Battaia F., Yang Y., Hennawi J. F., Prochaska J. X., Matsuda Y., Yamada T., Hayashino T., 2015, ApJ, 804, 26
- Baldry et al. (2004) Baldry I. K., Bland-Hawthorn J., Robertson J., 2004, Publications of the Astronomical Society of the Pacific, 116, 403
- Barden et al. (1998) Barden S. C., Arns J. A., Colburn W. S., 1998, in Astronomical Telescopes & Instrumentation. pp 866–876
- Barden et al. (2000) Barden S. C., Arns J. A., Colburn W. S., Williams J. B., 2000, Publications of the Astronomical Society of the Pacific, 112, 809
- Battey et al. (1996) Battey D. E., Owen H., Tedesco J. M., 1996, Spectrograph with multiplexing of different wavelength regions onto a single opto-electric detector array
- Berneth et al. (2011) Berneth H., Bruder F.-K., Fäcke T., Hagen R., Hönel D., Jurbergs D., Rölle T., Weiser M.-S., 2011, in Proc. SPIE. p. 79570H
- Berneth et al. (2013) Berneth H., Bruder F.-K., Fäcke T., Hagen R., Hönel D., Rölle T., Walze G., Weiser M.-S., 2013, in SPIE Optics+ Optoelectronics. pp 877603–877603
- Bianco et al. (2012) Bianco A., Pariani G., Zanutta A., Bertarelli C., 2012, in SPIE Astronomical Telescopes+ Instrumentation. pp 84502W–84502W
- Bruder & Fäcke (2010) Bruder F., Fäcke T., 2010, International Journal of Materials Research, 101, 199
- Bruder et al. (2009) Bruder F.-K., et al., 2009, Journal of Photopolymer Science and Technology, 22, 257
- Bruder et al. (2011) Bruder F.-K., Hagen R., Roelle T., Weiser M.-S., Fäcke T., 2011, Angewandte Chemie International Edition, 50, 4552
- Buzzoni et al. (1984) Buzzoni B., et al., 1984, The Messenger, 38, 9
- Cepa (2010) Cepa J., 2010, Astrophysics and Space Science Proceedings, 14, 15
- D’Odorico et al. (2013) D’Odorico V., et al., 2013, MNRAS, 435, 1198
- D’Odorico et al. (2016) D’Odorico V., et al., 2016, MNRAS, 463, 2690
- Dekker et al. (2000) Dekker H., D’Odorico S., Kaufer A., Delabre B., Kotzlowski H., 2000, in Iye M., Moorwood A. F., eds, Proc. SPIEVol. 4008, Optical and IR Telescope Instrumentation and Detectors. pp 534–545, doi:10.1117/12.395512
- Dhar et al. (2008) Dhar L., Curtis K., Fäcke T., 2008, Nature photonics, 2, 403
- Domínguez et al. (2011) Domínguez A., et al., 2011, MNRAS, 410, 2556
- Falomo et al. (2014) Falomo R., Pian E., Treves A., 2014, A&ARv, 22, 73
- Fernández et al. (2015) Fernández R., Gallego S., Francés J., Pascual I., Beléndez A., 2015, Optical Materials, 44, 18
- Franceschini et al. (2008) Franceschini A., Rodighiero G., Vaccari M., 2008, A&A, 487, 837
- Gleeson & Sheridan (2009) Gleeson M. R., Sheridan J. T., 2009, Journal of optics A: pure and applied optics, 11, 024008
- Gleeson et al. (2011) Gleeson M. R., Guo J., Sheridan J. T., 2011, Optics express, 19, 22423
- Käufl (2008) Käufl H. U., 2008, in , Precision Spectroscopy in Astrophysics. Springer, pp 227–230
- Kogelnik (1969) Kogelnik H., 1969, Bell Labs Technical Journal, 48, 2909
- Kowalski & McLeod (2016) Kowalski B. A., McLeod R. R., 2016, Journal of Polymer Science Part B: Polymer Physics, 54, 1021
- Landoni et al. (2013) Landoni M., Falomo R., Treves A., Sbarufatti B., Barattini M., Decarli R., Kotilainen J., 2013, AJ, 145, 114
- Landoni et al. (2014) Landoni M., Falomo R., Treves A., Sbarufatti B., 2014, A&A, 570, A126
- Landoni et al. (2015a) Landoni M., Falomo R., Treves A., Scarpa R., Reverte Payá D., 2015a, AJ, 150, 181
- Landoni et al. (2015b) Landoni M., Falomo R., Treves A., Scarpa R., Payá D. R., 2015b, The Astronomical Journal, 150, 181
- Landoni et al. (2016a) Landoni M., Zanutta A., Bianco A., Tavecchio F., Bonnoli G., Ghisellini G., 2016a, The Astronomical Journal, 151, 35
- Landoni et al. (2016b) Landoni M., Falomo R., Treves A., Scarpa R., Farina E. P., 2016b, MNRAS, 457, 267
- Lawrence et al. (1996) Lawrence C. R., Zucker J. R., Readhead A. C. S., Unwin S. C., Pearson T. J., Xu W., 1996, ApJS, 107, 541
- Lawrence et al. (2001) Lawrence J., O’Neill F., Sheridan J., 2001, Optik-International Journal for Light and Electron Optics, 112, 449
- Le Fèvre et al. (2003) Le Fèvre O., et al., 2003, in Iye M., Moorwood A. F. M., eds, Proc. SPIEVol. 4841, Instrument Design and Performance for Optical/Infrared Ground-based Telescopes. pp 1670–1681, doi:10.1117/12.460959
- Lee et al. (2014) Lee K.-G., et al., 2014, ApJ, 795, L12
- Li et al. (2014a) Li H., Qi Y., Sheridan J. T., 2014a, JOSA B, 31, 2638
- Li et al. (2014b) Li H., Qi Y., Sheridan J. T., 2014b, JOSA B, 31, 2648
- Liang-Wen et al. (1998) Liang-Wen X., Shihong L., Bi-Xian P., 1998, Applied optics, 37, 3678
- López et al. (2016) López S., et al., 2016, A&A, 594, A91
- Massaro et al. (2016) Massaro F., et al., 2016, Ap&SS, 361, 337
- McLean et al. (2012) McLean I. S., et al., 2012, in SPIE Astronomical Telescopes+ Instrumentation. pp 84460J–84460J
- Mirzoyan (2015) Mirzoyan R., 2015, The Astronomer’s Telegram, 6999
- Moharam & Gaylord (1981) Moharam M., Gaylord T., 1981, JOSA, 71, 811
- Moharam & Young (1978) Moharam M., Young L., 1978, Applied optics, 17, 1757
- Morozova et al. (2014) Morozova D. A., et al., 2014, AJ, 148, 42
- Muslimov et al. (2016) Muslimov E., Pavlycheva N., Valyavin G., Fabrika S., 2016, Astrophysical Bulletin, 71, 357
- Ortuño et al. (2013) Ortuño M., Fernández E., Fuentes R., Gallego S., Pascual I., Beléndez A., 2013, Optical Materials, 35, 668
- Pazder & Clemens (2008) Pazder J. S., Clemens J. C., 2008, in SPIE Astronomical Telescopes+ Instrumentation. pp 70184U–70184U
- Pita et al. (2014) Pita S., et al., 2014, A&A, 565, A12
- Prochaska et al. (2014) Prochaska J. X., Lau M. W., Hennawi J. F., 2014, ApJ, 796, 140
- Raiteri et al. (1999) Raiteri C. M., et al., 1999, A&A, 352, 19
- Sandrinelli et al. (2013) Sandrinelli A., Treves A., Falomo R., Farina E. P., Foschini L., Landoni M., Sbarufatti B., 2013, AJ, 146, 163
- Sbarufatti et al. (2005) Sbarufatti B., Treves A., Falomo R., Heidt J., Kotilainen J., Scarpa R., 2005, AJ, 129, 559
- Sbarufatti et al. (2006) Sbarufatti B., Treves A., Falomo R., Heidt J., Kotilainen J., Scarpa R., 2006, AJ, 132, 1
- Shaw et al. (2013) Shaw M. S., et al., 2013, ApJ, 764, 135
- Snodgrass et al. (2008) Snodgrass C., Saviane I., Monaco L., Sinclaire P., 2008, The Messenger, 132, 18
- Spanò et al. (2006) Spanò P., et al., 2006, arXiv preprint astro-ph/0603763
- Stickel et al. (1993) Stickel M., Fried J. W., Kuehr H., 1993, A&AS, 98, 393
- Vernet et al. (2011) Vernet J., et al., 2011, A&A, 536, A105
- Vogt (2002) Vogt S. S., 2002, in Bash F. N., Sneden C., eds, Astronomical Society of the Pacific Conference Series Vol. 270, Astronomical Instrumentation and Astrophysics. p. 5
- Walsh et al. (1984) Walsh D., Beckers J., Carswell R., Weymann R., 1984, Monthly Notices of the Royal Astronomical Society, 211, 105
- Zanutta et al. (2014a) Zanutta A., Bianco A., Insausti M., Garzón F., 2014a, in SPIE Astronomical Telescopes+ Instrumentation. pp 91515X–91515X
- Zanutta et al. (2014b) Zanutta A., Landoni M., Bianco A., Tomasella L., Benetti S., Giro E., 2014b, Publications of the Astronomical Society of the Pacific, 126, 264
- Zanutta et al. (2016a) Zanutta A., Orselli E., Fäcke T., Bianco A., 2016a, in SPIE Astronomical Telescopes+ Instrumentation. pp 99123B–99123B
- Zanutta et al. (2016b) Zanutta A., Orselli E., Fäcke T., Bianco A., 2016b, Optical Materials Express, 6, 252