Time-domain Brillouin scattering assisted by diffraction gratings
Abstract
Absorption of ultrashort laser pulses in a metallic grating deposited on a transparent sample launches coherent compression/dilatation acoustic pulses in directions of different orders of acoustic diffraction. Their propagation is detected by the delayed laser pulses, which are also diffracted by the metallic grating, through the measurement of the transient intensity change of the first order diffracted light. The obtained data contain multiple frequency components which are interpreted by considering all possible angles for the Brillouin scattering of light achieved through the multiplexing of the propagation directions of light and coherent sound by the metallic grating. The emitted acoustic field can be equivalently presented as a superposition of the plane inhomogeneous acoustic waves, which constitute an acoustic diffraction grating for the probe light. Thus, the obtained results can also be interpreted as a consequence of probe light diffraction by both metallic and acoustic gratings. The realized scheme of time-domain Brillouin scattering with metallic grating operating in reflection mode provides access to acoustic frequencies from the minimal to the maximal possible in a single experimental configuration for the directions of probe light incidence and scattered light detection. This is achieved by monitoring of the backward and forward Brillouin scattering processes in parallel. Applications include measurements of the acoustic dispersion, simultaneous determination of sound velocity and optical refractive index, and evaluation of the samples with a single direction of possible optical access.
Key words: picosecond laser ultrasonics, time-resolved Brillouin scattering, inhomogeneous plane acoustic wave, acousto-optics
pacs:
43.35.Sx, 78.20.hc, 78.35.+c, 81.70.Cv, 43.38.ZpI Introduction
Picosecond acoustic interferometry (PAI) is a powerful opto-acousto-optic technique for nondestructive and non-contact testing of transparent materials at the nanoscale.Thomsen et al. (1986); Grahn et al. (1989); Wright and Hyoguchi (1991); Wright (1992); O’Hara et al. (2001); Devos et al. (2005); Mechri et al. (2009); Steigerwald et al. (2009); Yarotski et al. (2012); Dehoux et al. (2012); Chen et al. (2014); Nikitin et al. (2015); Dehoux et al. (2016) First, using an ultrashort pump laser pulse, a propagating picosecond coherent acoustic pulse (CAP) is launched into the material. Second, partial scattering of a continuously delayed in time ultrashort probe laser pulse by the launched CAP is used to monitor the propagation of this nanometers scale acoustic perturbation through the material. Weak light pulses scattered by the CAP interfere at the photodetector with the probe light pulses of significantly higher amplitude reflected from various interfaces of the sample, such as the interfaces of the tested material with air and with the optoacoustic transducer, for example. The signal of transient optical reflectivity is proportional, in leading order, to the product of the amplitudes of these two scattered light fields. Thus, a heterodyning of a weak field against a strong one is achieved. The detected signal of time-resolved optical reflectivity in this so-called pump-probe scheme contains a sinusoidal oscillating component whose physical origin is the Brillouin scattering (BS) of the probe light by the CAP. The frequency of this oscillation depends on the angle between the propagation directions of the probe light and the coherent acoustic waves. It is precisely equal to the shift in the frequency of the scattered light that would be caused by the thermal phonons propagating in the same direction as the CAP and could be resolved using optical spectrometers in classic frequency-domain BS (FDBS) experiments.Fabelinskii (1968); Hayes and Loudon (1978); Dil (1982); Polian (2003) That is why the PAI is also often called time-domain Brillouin scattering (TDBS).
An important limitation of TDBS in comparison with FDBS is that a significantly narrower part of the acoustic spectra is accessible by TDBS. In FDBS, by varying the angle between the directions in which probe light is incident and in which scattered light is detected, the direction of the thermal phonons for testing can be selected.Thomsen et al. (1986); Grahn et al. (1989); Wright (1992) Because thermal phonons are available in all directions, this approach is very flexible providing the opportunity to significantly vary the angle between the directions of the probe light and the phonon wave vectors. Thermal phonons of highest frequency are accessible in the so-called back-scattering configuration,Wright (1992) when the probe light is scattered by the counter-propagating or co-propagating phonons (annihilation or creation of phonons, respectively). Thermal phonons of lowest frequency are detectable in the forward scattering configuration/geometry when the probe light and the phonons are propagating along nearly orthogonal directions, as in the so-called platelet configuration/geometry.Polian (2003) In TDBS the situation is very different. In common TDBS experiments the lateral dimensions of the optoacoustic generators are controlled by the size of the laser pump focus and typically significantly exceed the spatial lengths of the CAP emitted by them in the materials. Thus, the diffraction length of the emitted CAP in typical experiments significantly exceeds its attenuation length, while the direction of the CAP is quasi-perpendicular to the sample surface illuminated by the pump laser pulse, and fixed. Then the only possibility to vary the frequency of the tested phonon is to change the direction of the probe light propagation relative to the fixed direction of CAP propagation. However, most of the TDBS applications are for the diagnostics of either thin coatings/multilayers deposited on the bulk samples or thin plates/membranes with an optical access to the launched CAP only through the surfaces normal to CAP propagation direction. The maximum angle of the probe light transmitted through the air/material surface relative to the direction of CAP propagation is theoretically , where is the refractive index of the material at the probe wavelength , when in air the light is skimming along the surface. Thus for , the angle is smaller than 45∘. In the resulting backscattering-type configuration the frequency of the phonon tested by the TDBS is Lin et al. (1993); Côte and Devos (2005); Lomonosov et al. (2012)
| (1) |
where is the longitudinal sound velocity of the material and is the angle of incidence in air. Thus for , even the lowest frequency theoretically accessible by TDBS, , is close to the maximum one, . For more convenient but still large angle of incidence, , the estimate is . Thus, the tunability of the Brillouin frequency expressed in Eq. (1) is limited by refraction at the air/sample interface. This indicates the limitations in application of the TDBS for revealing and identifying the frequency dispersion of the material properties such as, for example, sound velocity and attenuation. Another limitation of the typical TDBS scheme is that, in accordance with Eq. (1), when fixing the external angle of probe incidence and measuring the Brillouin frequency (BF), , we get information on the combination of two material parameters ( and ). Then to determine them independently the TDBS measurements should be conducted at least at two different angles ,Côte and Devos (2005); Tomoda et al. (2007); Lomonosov et al. (2012) while in FDBS there exists an experimental forward scattering configuration, which is called platelet configuration,Polian (2003) providing the opportunity to measure sound velocity by a single measurement without determining the optical refractive index.
To get access in the TDBS experiments to larger angles of BS, including those of forward-type scattering, and, as a consequence, to broaden the spectrum of the detectable/accessible phonons and to measure the sound velocity within a single mutual orientations of the optical excitation and detection, we propose to use gratings consisting of periodically arranged pump light absorbing parallel bars. The bars could be metallic, for example, as in our experiments (Fig. 1). When the grating with a period is applied for the generation of the CAPs instead of a metallic thin film, typically used for this purpose, the coherent acoustic waves will be emitted not only normally to the plane of the gratings but also in all directions corresponding to the possible diffraction of the acoustic wave by this grating, thus, multiplexing the propagation directions of CAPs in the sample. Additionally the grating can diffract both transmitted and reflected probe light, thus, multiplexing the propagation directions of the probe laser pulses inside the sample. Both these factors should potentially lead to an increase of the maximum angles between the propagation directions of the coherent sound and of the probe light, and give access for TDBS to forward-type photon scattering processes. Moreover, application of the grating should provide an opportunity to monitor simultaneously the same acoustic mode, for example longitudinal, at different frequencies.
II Earlier experiments with metallic grating diffracting probe light in transmission mode
After realizing these theoretical predictions experimentally in the schema presented in Fig. 1, we have found that a part of them could have been confirmed just through the dedicated analysis of the experimental results published much earlier in Ref. Lin et al., 1993. In this publication the pump-probe optical schema was for the first time successfully applied to reveal the elastic motions of the metallic grating deposited on the samples surface (gold rods on fused silica, the same combination of materials as in our experiments). The principle difference in comparison with our optical experiments is in conducting pumping and probing of the samples from the grating side of the sample. The experimental setup was similar to Fig. 1 but the sample was placed upside down: both pump and probe light comes from the front side (with grating) of the sample. The title of this publication, “Study of vibrational modes of gold nanostructures by picosecond ultrasonics”, and its abstract, both emphasize the successful identification of the low-lying frequencies in the transient reflectivity spectrum with the normal modes of the nanorods coupled to the substrate. Because of this fact and the years passed we forgot that in Ref. Lin et al., 1993 three additional high-lying frequencies (modes I–III in Fig. 10 of Ref. Lin et al., 1993) had been detected and reproduced by the solutions of the theoretically formulated problem, although the origin of not all of them had been understood even qualitatively. The origin of mode I was identified with the backscattering-type process described in Eq. (1) without any influence of the grating on it. The origin of the mode II was related with the influence of the grating on the probe light field only, i.e., without accounting for the difference in the directivity patterns of the CAPs emitted by the metallic grating and a metallic thin film. Finally the origin of mode III was not understood. Based on our proposal that grating directs both the probe light and the generated acoustic waves in different orders of the diffraction, the interpretation of the physical origin of the modes II and III is straightforward. If in the coordinate system presented in Fig. 1 the wave vector of the probe photon incident from air on the sample is given by , where , then in transmission from air into the sample the probe field is diffracted by the grating in multiple directions defined by the wave vectors . Here is the grating wave number, is the wave number of the probe photon in the sample, while indicates the order of the diffraction peak. The probe light field backscattered by the phonons should have the propagation directions described by , . Only the light propagating along these directions, when transmitted from the sample into the air, could be diffracted by the grating in the detection direction, given in Ref. Lin et al., 1993 by . Note that the indexes and are introduced for the photon incident on the phonon and scattered by the phonon, respectively. These photons are propagative in the limited number of the diffraction orders defined by and evanescent in the rest. The wave vector of the acoustic phonon participating in the BS is given by the law of the momentum conservation,Fabelinskii (1968); Hayes and Loudon (1978); Dil (1982); Polian (2003) where the plus sign corresponds to absorption of the acoustic phonon (anti-Stokes) and the minus sign to its emission (Stokes). Then modulus of the wave vector of the coherent acoustic phonon which has participated in the BS is
| (2) |
Here the difference in the frequencies of the incident and scattered photons is neglected, , as usually, while the parameters are introduced by us to account for the variety of possible directions of incident and scattered light, in the general case. In the experiments in Ref. Lin et al., 1993, corresponds to monitoring of the backscattered light only, because the forward scattered light does not return to the detection region. The proposed Eq. (2) provides the frequency of the mode I as in Eq. (1) when . The proposed Eq. 2 reproduces Eq. (14) from Ref. Lin et al., 1993 when and, thus, reveals the physical sense of the parameter in Ref. Lin et al., 1993. The derived condition also confirms the suggestion in Ref. Lin et al., 1993 that in the mode II the light is scattered by the plane acoustic front propagating in the direction normal to the surface. In fact, the projection of the phonon wave vector along the surface (along the axis) is proportional to the difference between the projections of the photons wave vectors, , and, thus, for the revealed it is equal to zero. The phonon scattering light in mode II propagates normally to the surface. Moreover the experimentally observed mode II corresponds to . So the origin of the mode II is the scattering by the CAP of the light directed by the metallic grating in such diffraction order whose direction is the closest to the CAP propagation direction. Finally, Eq. (2) attributes the origin of the mode III to the following two degenerate in frequency processes. In the first one the metallic grating directs the incident light like in mode II, i.e. in the diffraction order closest to the surface normal, but then the coherent acoustic wave scatters light in such direction towards the front surface of the sample, from which it can be detected without additional diffraction (). In the second one the acoustic wave backscatters non-diffracted (zeroth order) probe light in the diffraction order of light closest to the surface normal, from which it is returned to the detection direction by the optical grating in transmission from the sample into the air (). In both these processes the acoustic waves are not just reflecting the incident light like the mirrors but are modifying the direction of the scattered light relative to one predicted by the Snell’s law. One can say that the acoustics waves are diffracting the incident light and are functioning as diffracting gratings with the wave number . It is natural in the following to use for the acoustic field, generated in the sample by pump laser pulses incident on the metallic grating, the term acoustic grating because it is periodic along the axis. Note, that this terminology was used already for example for the description of the acoustic waves generated by laser induced gratings, i.e., by the intensity interference patterns that can be created by two light beams incident on the sample surface at angles and .Gusev (2009, 2010); Kouyate et al. (2011); Kouyaté et al. (2016) It was demonstrated that the acoustic field emitted by the laser gratings can be decomposed into the so-called plane inhomogeneous acoustic modes,Gusev (2009, 2010); Kouyate et al. (2011); Kouyaté et al. (2016) i.e., the acoustic waves with plane phase fronts parallel to the laser-intensity grating but modulated in amplitude with the pattern of the laser intensity grating. Thus these modes can be naturally called acoustic gratings. In the experiments in Ref. Lin et al., 1993 and in our experiments presented below in Section III (Fig. 1) acoustic gratings are generated by the metallic gratings. Their ability not just to reflect/transmit but to diffract the incident light is due to their amplitude periodic modulation. Using the suggested terminology all the high-lying frequency modes detected in Ref. Lin et al., 1993 can be explained by processes involving only two diffractions of probe light by the gratings, i.e., either two diffractions by metallic grating (mode II) or one diffraction by the metallic grating plus one diffraction by the acoustic grating (mode III). Although in these experiments only the backscattering-type processes were observed and only those involving first diffraction orders, they are in favor of our proposal formulated in the Introduction that in the experiments with gratings multiple frequencies corresponding to BS processes with different angles between sound and light propagation directions can be detected simultaneously.
III Experiments with metallic grating diffracting probe light in reflection mode
In our TDBS experiments conducted from the opposite side of the sample (Fig. 1) than in Ref. Lin et al., 1993, we have additionally detected the BFs corresponding to forward scattering processes, to the processes involving three diffractions of probe light (two by metallic grating and one by acoustic grating) and also to the processes involving light from the higher diffraction orders than the first order. The gold gratings are made by the electron beam lithography and lift off technique on a fused silica substrate of thickness 1 mm. Insert in Fig. 1 shows a schematic structure of the sample. Two samples with different nominal grating periods, nm and nm, are prepared. We refer the former sample as “45deg”, whereas the latter as “60deg”, because they are prepared to have the first order diffraction peaks near these directions for the reflected probe light incident normally at the grating. The designed width of each rod is half the period, but the actual width is somewhat larger. The thickness of the gold rods is about 50 nm. A 2 nm thick Cr layer is formed between the SiO2 substrate and the Au film to improve the adhesion.
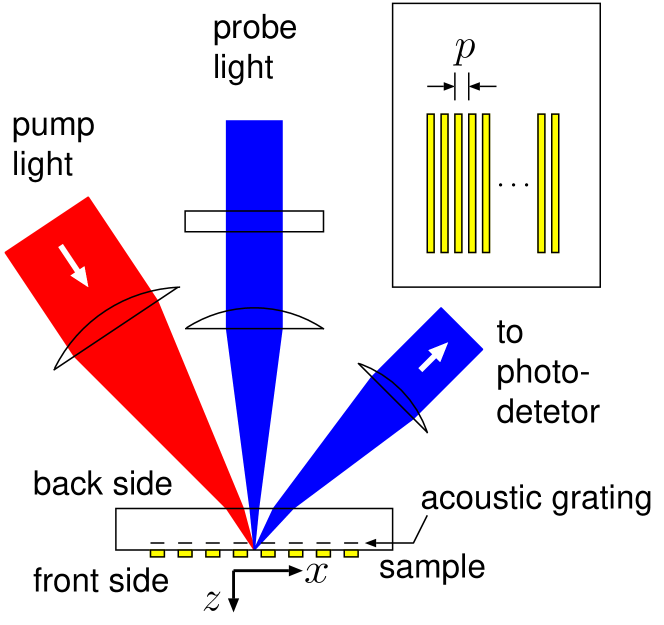
A standard laser picosecond setup is used. A mode-locked Ti:sapphire laser with a regenerative amplifier is used as the light source. The pulse width is 100 fs and the repetition frequency is 260 kHz. The fundamental light pulses with the central wavelength 800 nm are focused to the grating structure from the back side (the side without grating) of the sample (Fig. 1). The pulse energy is 80 nJ/pulse and the diameter of the focused region is 100 m, covering nearly completely the rectangular grating area, which lateral dimensions are similar (100 m by 100 m). The absorption of pump laser pulses in the metallic grating generates acoustics waves propagating in the sample along different orders of acoustic diffraction, as it is described in the Introduction. Alternatively the launched acoustic field could be viewed as inhomogeneous plane waves or acoustic grating propagating normally to the sample surface.Gusev (2009, 2010); Kouyate et al. (2011); Kouyaté et al. (2016) The acoustic grating, propagating normal to the metallic grating is the result of the interference of the acoustic waves propagating along positive and negative orders of the acoustic diffraction.
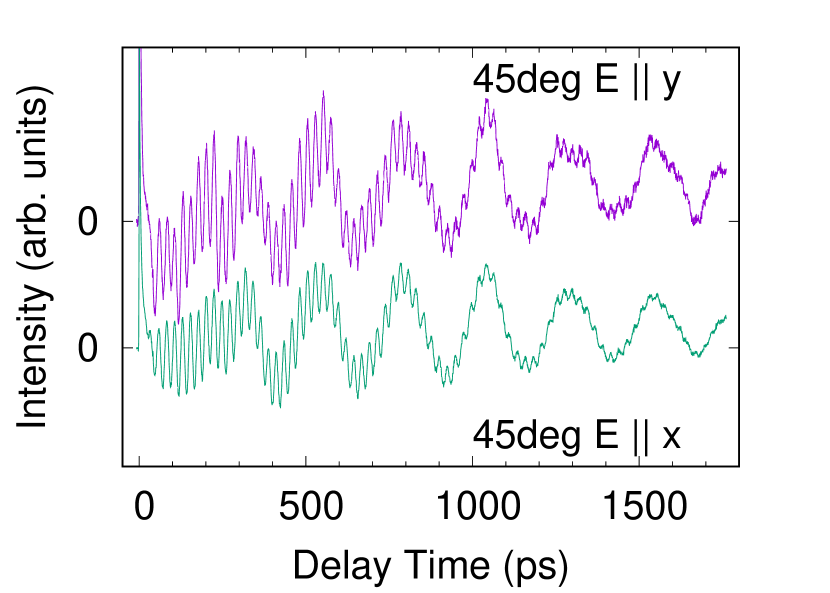
The frequency doubled light pulses with the central wavelength 400 nm are focused to the grating structure from the back side with the normal incidence. The pulse energy is 4 nJ/pulse and the diameter of the focused region is 10 m. The probe light scattered by the complete structure in the first order of diffraction is fed in the photo detector to reveal the modulation of the light intensity caused by the acoustic waves. (Fig. 1). The polarization of the incident probe light is chosen as in parallel with the grating period ( axis, ) or in parallel with the gold bars ( axis, ). Figure 2 shows the raw data of the transient variation of the intensity of the diffracted light for 45deg and 60deg samples with two probe polarizations and . The delay time is the time between the pump and probe light pulse arrival to the sample.
(a)
(b)
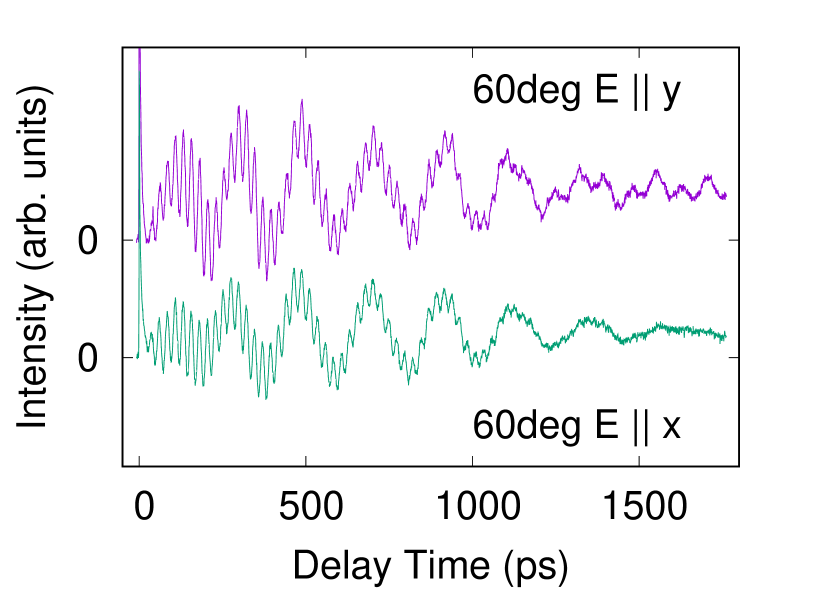
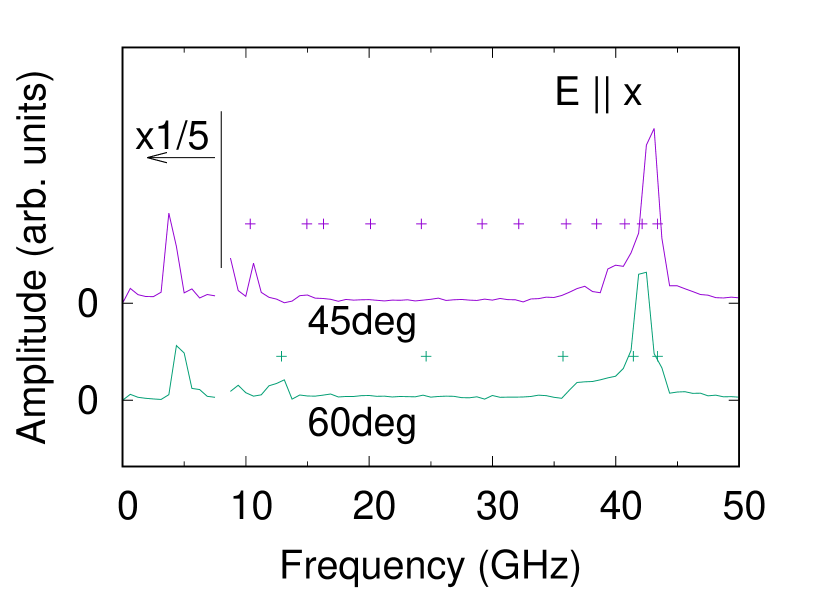
Each transient curve consists of two contributions: a slow oscillating components with a period around 200 ps, and a fast oscillating components with a period around 20 ps and resembles the curves presented in Fig. 2 of Ref. Lin et al., 1993. This indicates a possible splitting of the photo-induced motion of the sample into low-lying frequency modes and high-lying frequency modes as in Ref. Lin et al., 1993. To get further understanding, the obtained temporal signal is Fourier transformed with respect to the delay time. Figure 3 shows the norm of Fourier amplitude as a function of frequency.
(a)
(b)
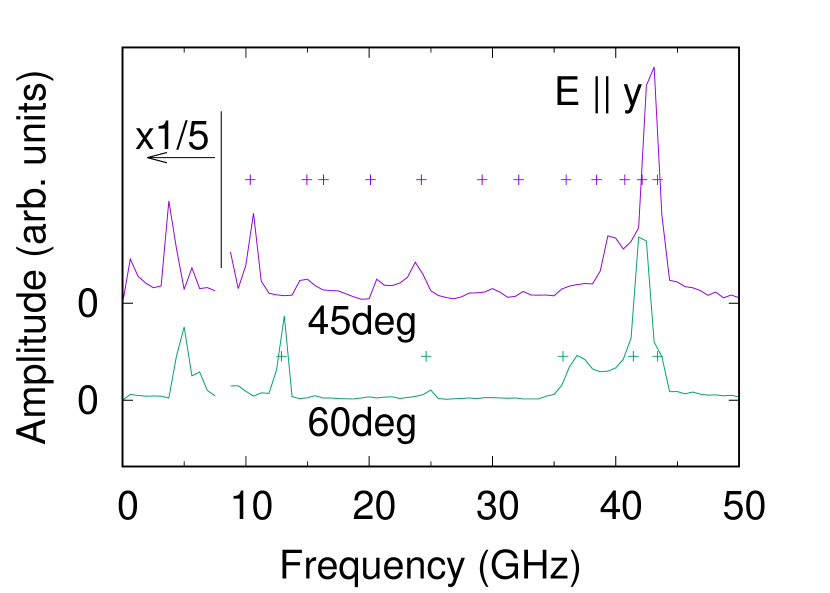
In the low-lying part of the spectrum below 8 GHz, where the amplitudes in Fig. 3 are intentionally attenuated, we detect, similar to Ref. Lin et al., 1993, up to three different modes. Following Ref. Lin et al., 1993 we attribute them to the oscillations of the gold rods on the sample surface. Although these oscillations are beyond of our interest here, it was straightforward to associate the strongest of the low-lying modes (at 3.8 GHz and 5.0 GHz in the 45deg and 60deg samples, respectively) with the L (longitudinal) mode defined in Ref. Lin et al., 1993. This was achieved using the results of numerical calculations of the resonance frequency of the rods with different widths and thicknesses presented in Fig. 8 of Ref. Lin et al., 1993 and accounting for the fact that frequency of the strongest mode in our experiments scales approximately inverse proportional to its width.
High-lying parts of the observed spectra in our experiments are always containing larger number of frequency peaks in comparison with Ref. Lin et al., 1993. For example in 45deg sample in case of probe polarization the number of the frequencies that can be identified is twelve (see Fig. 3 (b) and Table 1), i.e., four times larger than that in Ref. Lin et al., 1993. All the experimentally observed modes in the high-lying part of the spectrum can be attributed to particular BS processes theoretically contributing to Eq. (2), when accounting for the differences between our experimental configuration and samples and those in Ref. Lin et al., 1993. The first and the most important advantage of the optical probing the sample from the back side (Fig. 1) consists in the additional opportunity to monitor forward-type BS processes by the TDBS. This opportunity is related to the fact that in our experiments the metallic grating acts on the probe light in the reflection mode while in the optical schema of Ref. Lin et al., 1993, i.e., when the sample in Fig. 1 is placed upside down and probed from the front side, it acts on the probe light in the transmission mode only. This can be qualitatively understood considering four types of the probe light scattering sequences which are contributing to the reflection of light by the sample in the direction of the detector. Accounting for the fact that the scattering of light by the acoustic grating is much weaker than by the metallic one, only the sequences with a single scattering by the acoustic grating should be considered. The first and the simplest sequence is the diffraction of the probe light normally incident on the acoustic grating in reflection/backscattering mode towards the detector. This process corresponds to , , , in Eq. (2). We remind here that the parameters numerate the diffraction orders, while fix the direction of the probe light propagation along the z axis. The detection direction is , in our experiments. The second sequence including backscattering of light by the acoustic grating includes: a) the transmission of the probe light through the acoustic grating without diffraction, b) reflection or diffraction of light by metallic grating in the different orders of the diffraction, c) reflection/backscattering of light by the acoustic grating in the different orders of the diffraction (the process with , and arbitrary in Eq. (2)), d) reflection or diffraction of the light by the metallic grating in the direction of its detection. Two other sequences include forward scattering of light by the acoustic grating (). The third sequence consists in: a) forward scattering of the probe light normally incident on the acoustic grating in the different orders of the diffraction (the process with , , and arbitrary in Eq. (2)) and b) reflection or diffraction of the light by the metallic grating in the direction of its detection. The fourth sequence includes: a) the transmission of the probe light through the acoustic grating without scattering, b) reflection or diffraction of light by metallic grating in the different orders of the diffraction and c) forward scattering/transmission of the light by the acoustic grating in the direction of the first order of the diffraction (the process with , , arbitrary and in Eq. (2)). It is worth noting here that in our 1 mm thick samples in order to be detected the light scattered from region of the acousto-optic interaction towards the back surface should propagate in the direction of the detection. In fact, because of the large thickness of the sample in comparison with the lateral dimension of the metallic and acoustic gratings, the light scattered in the other diffraction orders after the reflection from the back surface does not incident on the metallic and acoustic gratings and, thus, it cannot be later redirected by them to the detector.
We have found that for the identification of all BFs detected in all four conducted experiments it is sufficient to account only for the propagating incident and scattered light fields in the processes defined by Eq. (2), although only the light directed to the detector should be obligatory propagating (because of the large distance between the region of its diffractions/scatterings and the back surface of the sample). Although in the second of the above described sequences both incident and scattered light fields could be potentially evanescent, while in the third and the forth sequences the evanescent could be the scattered and the incident light, respectively, it was sufficient for us to account (in addition to the zeroth order of the diffraction) only for the first and the second orders of the diffracted light in the 45deg sample and for the first order of the diffracted light in the 60deg sample. With the refractive index of the fused silica in our sample the light in all other diffraction orders is evanescent (). Thus it was possible to explain all the observed BFs only by the BS processes with the momentum conservation diagrams presented in Fig. 4. In this Figure and later on the state of the incident photon (left column) is identified by , while the state of the scattered photon (upper row) by . Blue, green and red arrows are presenting the wave vectors of the incident photon, scattered photon and the phonon, respectively.
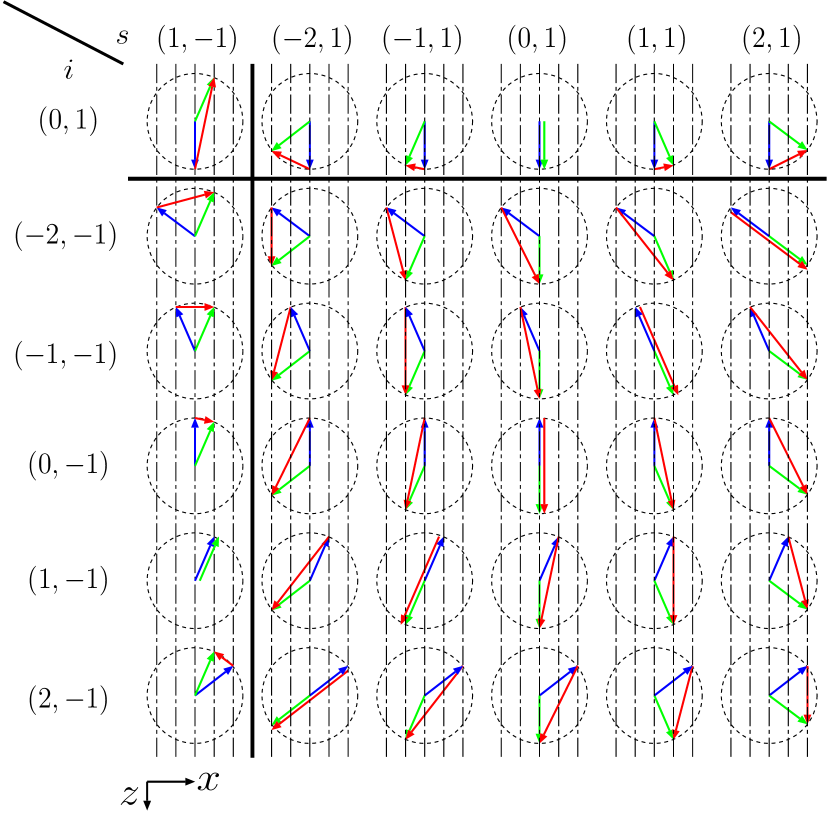
The wave vector diagrams for the Brillouin scattering processes, corresponding to the four probe light transmission/reflection sequences described above, are presented in the upper left, lower right, upper-right and lower-left parts of Fig. 4, respectively. They are separated by continuous black lines. Equation (2) (for ) provided opportunity to calculate the frequencies of all scattering processes depictured in Fig. 4. The calculated BFs are presented in Table 1 together with the experimentally registered. For completeness we listed in the left column in Table 1 all the cases of degeneracy, i.e., when different scattering configurations in space actually correspond to the same angle between the propagation directions of the incident photon and the phonon. The notation “NA” in Table 1 marks the processes involving the photons from the second diffraction order in the 60deg sample, which are evanescent. It was not required to account for these processes to explain the totality of our experimental observations.
| config. | 45deg | 60deg | ||||
|---|---|---|---|---|---|---|
| calc. | exp. | exp. | calc. | exp. | exp. | |
| 10.35 | 10.6 | 10.6 | 12.90 | 13.1 | 12.9 | |
| 20.10 | 20.6 | – | 24.62 | 25.0 | – | |
| 38.44 | 39.4 | 39.8 | 35.72 | 36.9 | 36.8 | |
| 42.13 | 42.5 | 43.0 | 41.42 | 41.9 | 41.9 | |
| 43.38 | 43.3 | 43.1 | 43.38 | 43.4 | 43.4 | |
| 14.95 | 15.0 | – | NA | NA | NA | |
| 24.24 | 23.7 | – | NA | NA | NA | |
| 29.16 | 30.0 | – | NA | NA | NA | |
| 32.12 | 32.5 | – | NA | NA | NA | |
| 35.98 | (36.5 ) | (37.4) | NA | NA | NA | |
| 16.30 | – | – | NA | NA | NA | |
| 40.72 | – | – | NA | NA | NA | |
IV Discussion
We have already noted above that the larger number of Brillouin frequencies accessible in our experiments in comparison with those in Ref. Lin et al., 1993 is due to the ability to monitor forward scattering processes in the configuration presented in Fig. 1. Another reason is in the larger number of the diffraction orders with propagating probe light in our 45deg sample. We have checked that in Ref. Lin et al., 1993 in the samples with 400 nm and 600 nm periodicity of the metallic grating only the photons in the zeroth and the first diffraction orders could be propagative. In our 45deg sample the photons are propagative additionally in the second diffraction order importantly increasing the number of the efficient BS configurations as it could be appreciated from the lower part of the Table 1, where the theoretical interpretation of the detected BFs necessities the participation in the BS the photons from the second diffraction order. The fact, the photons in the second diffraction order are propagating in 45deg sample and are evanescent in the 60deg samples also explains our experimental observations that larger number of the BFs were detected in the first of this samples (see Fig. 3 and Table 1).
It was expected that the propagation of the probe light in the higher diffraction orders would require the participation in the BS processes of the phonons launched in the higher orders of diffraction, i.e., higher orders of light diffraction by the acoustic grating, in comparison with the earlier experiments. This is confirmed by our experimental results presented in Table 1 and explained by the diagrams in Fig. 4. Only in one of the processes, , involving the first diffraction orders of light (dominating in the upper part of the Table 1 above the thick horizontal line in its center) the participation of the phonon of the second diffraction order, i.e., with the projection of the phonon wave vector on the x axis equal to , is required, for explaining the particular experimentally detected frequency. Note, that two other processes in the upper part of the Table 1, and , due to phonons emitted by the optoacoustic generator in the second and the fourth diffraction orders, respectively, are possible. However, these processes are degenerate in BF with the process , taking place without diffraction but just through the reflection of light by the plane compression/dilatation acoustic wave. The latter process takes place without diffracted acoustic waves and is dominating over two other processes contributing to the same BF. Consequently, accounting for the processes and is not necessary for the explanation of our experimental observations. They are presented in Table 1 only for the sake of completeness. Thus, the experimental BFs from the upper part of Table 1 can be explained by the processes involving photons of the zeroth and the first diffraction orders only. At the same time the participation of the phonons from the second and even from the third diffraction orders (see for example ) is largely required in the processes with the photons from the second diffraction order in the lower part of Table 1.
To explain all the available experimental data, we do need to account for the phonon which is neither propagating nor decaying along the axis. The experimental frequencies of 20.6 GHz and 25.0 GHz, observed only in the experiment with polarization of probe light in 45deg and 60 deg samples, respectively, can be currently associated only with the scattering of light by longitudinal phonons skimming along the sample surface. The corresponding scattering process is .
The observation of the BFs only when using probe light polarized along the metallic rods, i.e., , is rather common to our experiments (see Fig. 3 and Table 1). We attribute these observations to higher reflection/diffraction of polarized light in comparison with the light polarized along the direction of grating periodicity, i.e., , both by metallic and acoustic gratings. On the one hand, this hypothesis is consistent with the known applications of metal gratings as birefringent light polarizers.Zhou and Liu (2005); Zhang et al. (2006) On the other hand, the scattering of polarized light may have lower efficiency than that of when the propagation direction of the scattered light is nearly perpendicular to the direction of the polarization which is induced by the incident light and the acoustic waves.Kouyaté et al. (2016); Born and Wolf (1999)
Our experimental results confirm that the application of the diffraction grating in the TDBS experiments provides opportunity to overcome some limitations of the TDBS technique discussed in the Introduction. First the proposed experimental scheme provides opportunity to detect simultaneously multiple Brillouin frequencies from the highest possible BF in the backscattering configuration, GHz, to the lowest possible BF in the forward scattering configuration, GHz (see the first and the last line in the upper part of Table 1). This significantly broadens the frequency band of the TDBS from (see Introduction) to . The highest BF detected in our experiments does not depend on the grating, while the lowest detected frequency is controlled by the grating period as it can be appreciated from the diagrams in Fig. 4 of the several degenerate processes providing access to this frequency. It could be additionally diminished by the increasing the period of the grating. The comparison of the lowest BFs detected in our two samples (first line in Table 1) supports this expectation. Thus the frequency range accessed by TDBS could be additionally broadened by the dedicated preparation of the grating.
Our experiments demonstrate that the TDBS measurement in a single experimental configuration with diffraction grating, i.e., without any modification of the directions for optical pumping and probing of the sample, is sufficient to extract refractive index, n, and sound velocity, , of the material. For this purpose any two of the experimentally detected frequencies, which in Eq. (2) depend both on and , could be used. It is also possible to determine the refractive index and sound speed by fitting simultaneously larger number the measured frequencies in order to increase statistically the reliability in their determination, if required.Lomonosov et al. (2012) Moreover the detection of the BF corresponding to the forward scattering process of light by the skimming longitudinal wave, , provides opportunity to determine sound velocity without knowledge of the refractive index. In this process (see Fig. 4) and the determination of the sound velocity requires just the knowledge of the grating period, . If our experiments were accomplished differently, with probe light incident on the sample at angle to the sample normal and the scattered light detected in the direction of mirror-type reflection, i.e., as in Ref. Lin et al., 1993 but from the backside of the sample, the processes of forward scattering of probe light by the skimming longitudinal wave would be still accessible by the TDBS. For example, if the angle is chosen such that , then the acoustic grating composed of acoustic waves skimming along the surface could scatter the probe light incident on it from the back surface of the sample forward in the “symmetrically” propagating light with by transmitting it in the -th diffraction order of the grating. Later in the reflection from the metallic grating this probe light could be directed to the detector. Thus the momentum conservation law for scattering of the probe light by the phonons skimming along the surface reads . The first of these equalities can be used to evaluate the sound velocity from the measured BF without knowledge of the optical refractive index. However, there is still a drastic difference in this approach to evaluate sound velocity by TDBS with how it could be accomplished in FDBS. In FDBS for any angle between the direction of probe incidence and probe detection the thermal phonon with the wave vector necessary for the BS exists. For example, in the platelet geometry of the FDBS, which has the same momentum conservation diagram as the geometry providing access to skimming phonons by the TDBS and also provides opportunity to measure sound velocity without knowledge of the optical refraction angle, the thermal phonons with the required exist for any . In the TDBS the coherent skimming phonons can be generated only with wave vectors, which are multiples of the metallic grating wave number, . Thus, to access these phonons the angle of incident should be chosen to satisfy the equality . In both of our samples such measurements could be potentially accomplished only at two different angles of light incidence.
Finally, it is worth mentioning that in our experiments the number of the detected forward scattering processes is smaller than the backward scattering ones (see Fig. 4). This is related to the fact that our scheme allows all possible forward scattering processes to be accessed in the second sequence of the probe light scattering from those described earlier. In this sequence in the acousto-optic interaction both the light incident on the acoustic grating and the scattered probe light can be of the arbitrary diffractions orders, while in the third and the fourth scattering sequences for the detection of the forward scattering processes only one of these light fields could be of an arbitrary diffraction order. This asymmetry in the TDBS scheme could be potentially corrected in the thinner experimental samples with two diffraction gratings deposited on the opposite sides when multiple reflections of the probe light between the surfaces of the sample are becoming important while the second grating (deposited on the back surface of the sample in Fig. 1) could, in particular, transmit in the detection direction in air the probe light incident on it from the sample side along an arbitrary order of diffraction. With the diffraction gratings on both sides of the sample all BS processes possible in the sample, both for forward and backward scattering, could potentially involve incident and scattered light in arbitrary diffraction orders.
V Conclusions
We have performed picosecond ultrasonic interferometry (time-domain Brillouin scattering (TDBS)) measurements in transparent samples with metallic gratings. The pump light pulse absorbed in the metallic grating structure generates acoustic gratings (inhomogeneous plane compression/dilatation acoustic waves) in the substrate. The propagation of the acoustic waves is monitored by delayed probe light pulses. By detecting the modulation of the probe light intensity in the first order diffracted beam, we observed in the time domain Brillouin oscillations with rich frequency spectra. The obtained results are explained by a theoretical model which takes into account all possible configurations of probe light scattering/diffraction by these acoustic gratings, including those where the light itself is diffracted by the metallic grating either before its scattering by the phonons or after this scattering, or both. The agreement between the experimental positions of the Brillouin frequencies and the calculated ones is excellent.
The theory revealed two reasons for the increased number of the BS processes that could be monitored in the scheme of TDBS proposed by us in comparison with the earlier reported experiments with metal gratings.Lin et al. (1993) Our scheme provided for the first time access by TDBS to the forward scattering processes of light by the coherent sound, while one of our gratings provided propagating probe light in higher diffractions orders than in Ref. Lin et al., 1993. Access to forward scattering processes importantly broadens the range of frequencies accessible by the TDBS. This fact in combination with the opportunities to monitor multiple different BS processes/frequencies simultaneously would be advantageous in studying dispersion of sound velocity and sound attenuation in the materials. It is worth noting here that the applications of usual TDBS schemes for studying acoustic wave attenuation are documented for a variety of the media.Lin et al. (1991); Chen et al. (1994); Emery and Devos (2006); Devos et al. (2008); Decremps et al. (2008); Pezeril et al. (2009); Ayrinhac et al. (2011); Maznev et al. (2011); Klieber et al. (2013); Maehara et al. (2014); Danworaphong et al. (2015) The opportunity to monitor in a single measurement the acoustic phonons propagating in different directions could be attractive for revealing the elastic/inelastic anisotropy of the materials, including one that could be caused by non-isotropic loading or by the residual stress. For the studies of the anisotropy it is also extremely advantageous that gratings, as demonstrated by our experiments, can simultaneously launch phonons, detectable by TDBS, in the complete diapason of the angles, i.e., from 0 degrees to 90 degrees relative to their surface. Advantageous in certain practical applications with limited optical access to the samplesNikitin et al. (2015); Decremps et al. (2008); Kuriakose et al. (2016) would be provided by the opportunity to monitor by the TDBS with grating multiple BS processes/frequencies even with incident and the detected/scattered light propagating collinearly (for example in the case of the probe light incident normally on the grating and the detection of either reflected or transmitted light in the directions also normal to the grating surfaces).
Finally some of the functionalities of the proposed scheme could be achieved by replacing the metal gratings by laser-induced gratings that could be generated by the interference pattern of two light beams propagating at an angle. Such gratings can launch acoustic gratings in the sampleGusev (2009, 2010); Kouyate et al. (2011) and also to diffract probe light,Kouyaté et al. (2016) although much less efficiently than the metallic ones. The advantage of laser gratings is in the perspective of the non-contact and non-invasive diagnostics of the samples by TDBS. The drawback is in more technically elaborated optical scheme.
Acknowledgements.
The reported research was conducted in the frame of the project PLUSDIL supported by ANR, under contract ANR-12-BS09-0031. O.M. is partially supported by the Acoustic HUB of Région des Pays de La Loire in France, by a Grant-in-Aid for Scientific Research from Japan Society for the Promotion of Science, and by a research grant from the Murata Science Foundation. We are grateful to Prof. Humphrey J. Maris for the comments. We would like to thank OPEN FACILITY (Hokkaido University Sousei Hall) for the sample fabrication.References
- Thomsen et al. (1986) C. Thomsen, H. T. Grahn, H. J. Maris, and J. Tauc, Opt. Comm. 60, 55 (1986).
- Grahn et al. (1989) H. T. Grahn, H. J. Maris, and J. Tauc, IEEE J. Quantum Electron. 25, 2562 (1989).
- Wright and Hyoguchi (1991) O. B. Wright and T. Hyoguchi, Opt. Lett. 16, 1529 (1991).
- Wright (1992) O. B. Wright, J. Appl. Phys. 71, 1617 (1992).
- O’Hara et al. (2001) K. E. O’Hara, X. Hu, and D. G. Cahill, J. Appl. Phys. 90, 4852 (2001).
- Devos et al. (2005) A. Devos, R. Côte, G. Caruyer, and A. Lefévre, Appl. Phys. Lett. 86, 211903 (2005).
- Mechri et al. (2009) C. Mechri, P. Ruello, J. M. Breteau, M. R. Baklanov, P. Verdonck, and V. Gusev, Appl. Phys. Lett. 95, 091907 (2009).
- Steigerwald et al. (2009) A. Steigerwald, Y. Xu, J. Qi, J. Gregory, X. Liu, J. K. Furdyna, K. Varga, A. B. Hmelo, G. Lüpke, L. C. Feldman, et al., Appl. Phys. Lett. 94, 111910 (2009).
- Yarotski et al. (2012) D. Yarotski, E. F. L. Yan, Q. Jia, Y. Wang, A. J. Taylor, and B. P. Uberuaga, Appl. Phys. Lett. 100, 251603 (2012).
- Dehoux et al. (2012) T. Dehoux, N. Tsapis, and B. Audoin, Soft. Matter. 8, 2586 (2012).
- Chen et al. (2014) I.-J. Chen, P.-A. Mante, C.-K. Chang, S.-C. Yang, H.-Y. Chen, Y.-R. Huang, L.-C. Chen, K.-H. Chen, V. Gusev, and C.-K. Sun, Nano Lett. 14, 1317 (2014).
- Nikitin et al. (2015) S. M. Nikitin, N. Chigarev, V. Tournat, A. Bulou, D. Gasteau, B. Castagnede, A. Zerr, and V. E. Gusev1, 5, 9352 (2015).
- Dehoux et al. (2016) T. Dehoux, K. Ishikawa, P. H. Otsuka, M. Tomoda, O. Matsuda, M. Fujiwara, S. Takeuchi, I. A. Veres, V. E. Gusev, and O. B. Wright, Light Sci. Appl. 5, e16082 (2016).
- Fabelinskii (1968) I. L. Fabelinskii, Molecular scattering of light (Plenum, New York, 1968).
- Hayes and Loudon (1978) W. Hayes and R. Loudon, Scattering of light by crystals (Wiley, New York, 1978).
- Dil (1982) J. G. Dil, Rep. Prog. Phys. 45, 285 (1982).
- Polian (2003) A. Polian, J. Raman Spectrosc. 34, 633 (2003).
- Lin et al. (1993) H. N. Lin, H. J. Maris, L. B. Freund, K. Y. Lee, H. Luhn, and D. P. Kem, J. Appl. Phys. 73, 37 (1993).
- Côte and Devos (2005) R. Côte and A. Devos, Rev. Sci. Instrum. 76, 053906 (2005).
- Lomonosov et al. (2012) A. M. Lomonosov, Ayouch, P. Ruello, G. Vaudel, M. R. Baklanov, P. Verdonck, L. Zhao, and V. E. Gusev, ACS Nano 6, 1410 (2012).
- Tomoda et al. (2007) M. Tomoda, O. Matsuda, and O. B. Wright, Appl. Phys. Lett. 90, 041114 (2007).
- Gusev (2009) V. Gusev, Appl. Phys. Lett. 94, 164105 (2009).
- Gusev (2010) V. Gusev, J. Appl. Phys. 107, 114906 (2010).
- Kouyate et al. (2011) M. Kouyate, T. Pezeril, D. Mounier, and V. Gusev, J. Appl. Phys. 110, 123526 (2011).
- Kouyaté et al. (2016) M. Kouyaté, T. Pezeril, V. Gusev, and O. Matsuda, J. Opt. Soc. Am. B 33, 2634 (2016).
- Lide (2003) D. R. Lide, ed., CRC Handbook of Chemistry and Physics (CRC Press, Boca Raton, Fla., 2003), 84th ed.
- Zhou and Liu (2005) L. Zhou and W. Liu, Opt. Lett. 30, 1434 (2005).
- Zhang et al. (2006) D. Zhang, P. Wang, X. Jiao, C. Min, G. Yuan, Y. Deng, H. Ming, L. Zhang, and W. Liu, 85, 139 (2006).
- Born and Wolf (1999) M. Born and E. Wolf, Principles of Optics (Cambridge University Press, UK, 1999), 7th ed.
- Lin et al. (1991) H. N. Lin, R. J. Stoner, H. J. Maris, and J. Tauc, J. Appl. Phys. 69, 3816 (1991).
- Chen et al. (1994) W. Chen, H. J. Maris, Z. R. Wasilewski, and S. Tamura, Phil. Mag. B 70, 687 (1994).
- Emery and Devos (2006) P. Emery and A. Devos, Appl. Phys. Lett. 89, 191904 (2006).
- Devos et al. (2008) A. Devos, M. Foret, S. Ayrinhac, P. Emery, , and B. Ruffl´, Phys. Rev. B 77, 100201 (2008).
- Decremps et al. (2008) F. Decremps, L. Belliard, B. Perrin, and M. Gauthier, Phys. Rev. Lett. 100, 035502 (2008).
- Pezeril et al. (2009) T. Pezeril, C. Klieber, S. Andrieu, and K. A. Nelson, Phys. Rev. Lett. 102, 107402 (2009).
- Ayrinhac et al. (2011) S. Ayrinhac, M. Foret, A. Devos, B. Rufflé, E. Courtens, and R. Vacher, Phys. Rev. B 83, 014204 (2011).
- Maznev et al. (2011) A. A. Maznev, K. J. Manke, C. Klieber, K. A. Nelson, S. H. Baek, and C. B. Eom, Opt. Lett. 36, 2925 (2011).
- Klieber et al. (2013) C. Klieber, T. Hecksher, T. Pezeril, D. H. Torchinsky, J. C. Dyre, , and K. A. Nelson, J. Chem. Phys. 138, 12A544 (2013).
- Maehara et al. (2014) A. Maehara, N. Nakamura, H. Ogi, and M. Hirao, Jpn. J. Appl. Phys. 53, 086602 (2014).
- Danworaphong et al. (2015) S. Danworaphong, M. Tomoda, Y. Matsumoto, O. Matsuda, T. Ohashi, H. Watanabe, M. Nagayama, K. Gohara, P. H. Otsuka, and O. B. Wright, Appl. Phys. Lett. 106, 163701 (2015).
- Kuriakose et al. (2016) M. Kuriakose, S. Raetz, N. Chigarev, S. M. Nikitin, A. Bulou, D. Gasteau, V. Tournat, B. Castagnede, A. Zerr, and V. E. Gusev, Ultrasonics 69, 259 (2016).