Using Speech Technology for Quantifying Behavioral Characteristics in Peer-Led Team Learning Sessions
Abstract
Peer-Led Team Learning (PLTL) is a learning methodology where a peer-leader co-ordinate a small-group of students to collaboratively solve technical problems. PLTL have been adopted for various science, engineering, technology and maths courses in several US universities. This paper proposed and evaluated a speech system for behavioral analysis of PLTL groups. It could help in identifying the best practices for PLTL. The CRSS-PLTL corpus was used for evaluation of developed algorithms. In this paper, we developed a robust speech activity detection (SAD) by fusing the outputs of a DNN-based pitch extractor and an unsupervised SAD based on voicing measures. Robust speaker diarization system consisted of bottleneck features (from stacked autoencoder) and informed HMM-based joint segmentation and clustering system. Behavioral characteristics such as participation, dominance, emphasis, curiosity and engagement were extracted by acoustic analyses of speech segments belonging to all students. We proposed a novel method for detecting question inflection and performed equal error rate analysis on PLTL corpus. In addition, a robust approach for detecting emphasized speech regions was also proposed. Further, we performed exploratory data analysis for understanding the distortion present in CRSS-PLTL corpus as it was collected in naturalistic scenario. The ground-truth Likert scale ratings were used for capturing the team dynamics in terms of student’s responses to a variety of evaluation questions. Results suggested the applicability of proposed system for behavioral analysis of small-group conversations such as PLTL, work-place meetings etc..
keywords:
Behavioral Speech Processing , Bottleneck Features , Curiosity , Deep Neural Network , Dominance , Auto-encoder , Emphasis , Engagement , Peer-Led Team Learning , Speaker Diarization , Small-group Conversations1 Introduction
Peer-Led Team Learning (PLTL) is a structured methodology where a team leader facilitate collaborative problem solving among small-group of students. PLTL have shown positive outcomes towards learning Snyder et al. [70]. The traditional teaching model lacks one-to-one interaction and peer-feedback unlike PLTL. Peer leaders are expected to give helpful hints and comments during students’ discussion. Peer leaders are not supposed to reveal solutions, in contrast to the traditional teaching model Cracolice and Deming [17].
We established the CRSS-PLTL corpus in Dubey et al. [20] for audio-based analysis of PLTL sessions. Earlier, we developed a robust diarization system that combined bottleneck features (from a stacked autoencoder) with an informed HMM-based joint segmentation and clustering approach Dubey et al. [21]. The minimum-duration of short conversational-turns and number of students were incorporated as side information to the HMM-based diarization system. The output probability density function of each HMM state was modeled using a Gaussian Mixture Model (GMM). Each HMM state was allowed to have several sub-states for ensuring the minimum-duration constraint of conversational-turns. A modified form of Bayesian Information Criterion (BIC) was used for iterative merging and re-segmentation. We continued the merging of HMM states till the number of states was same as that of the speakers.
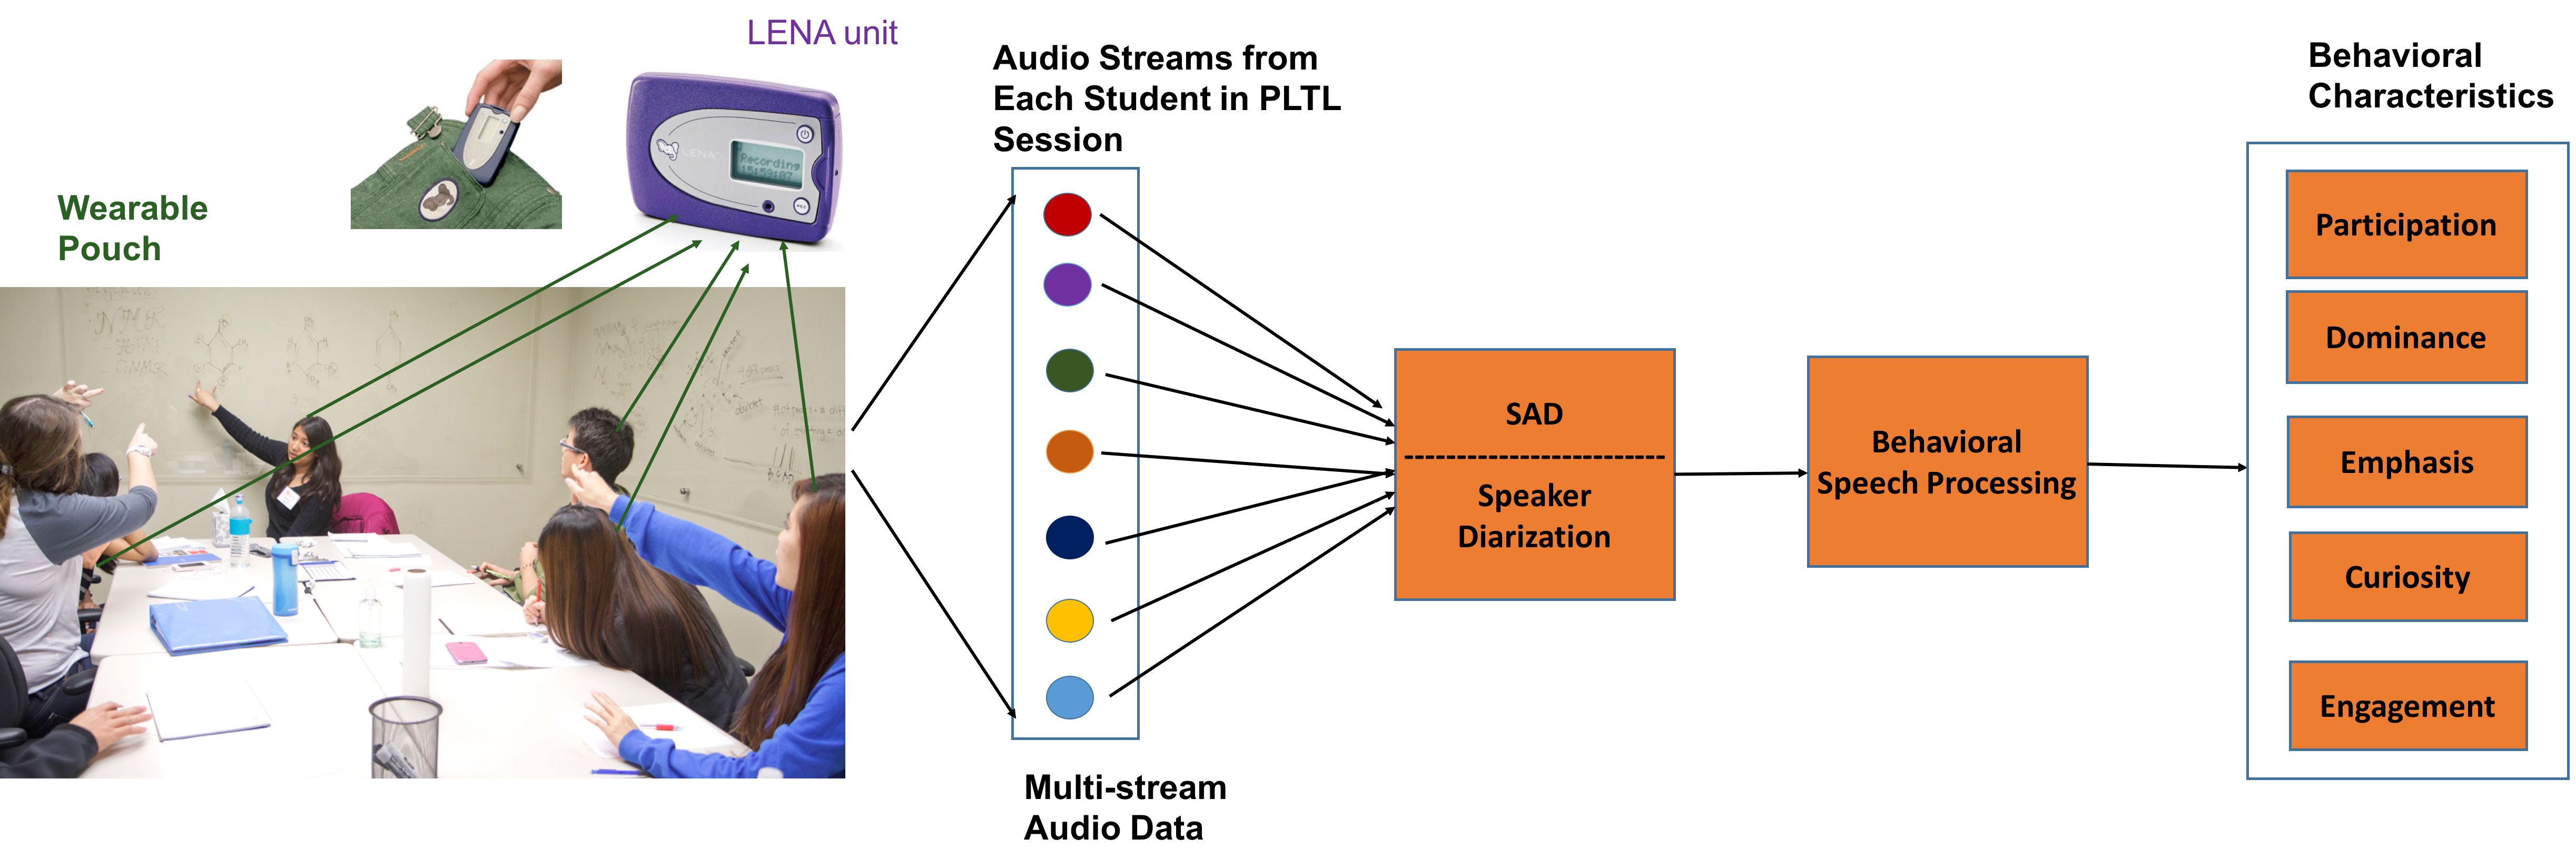
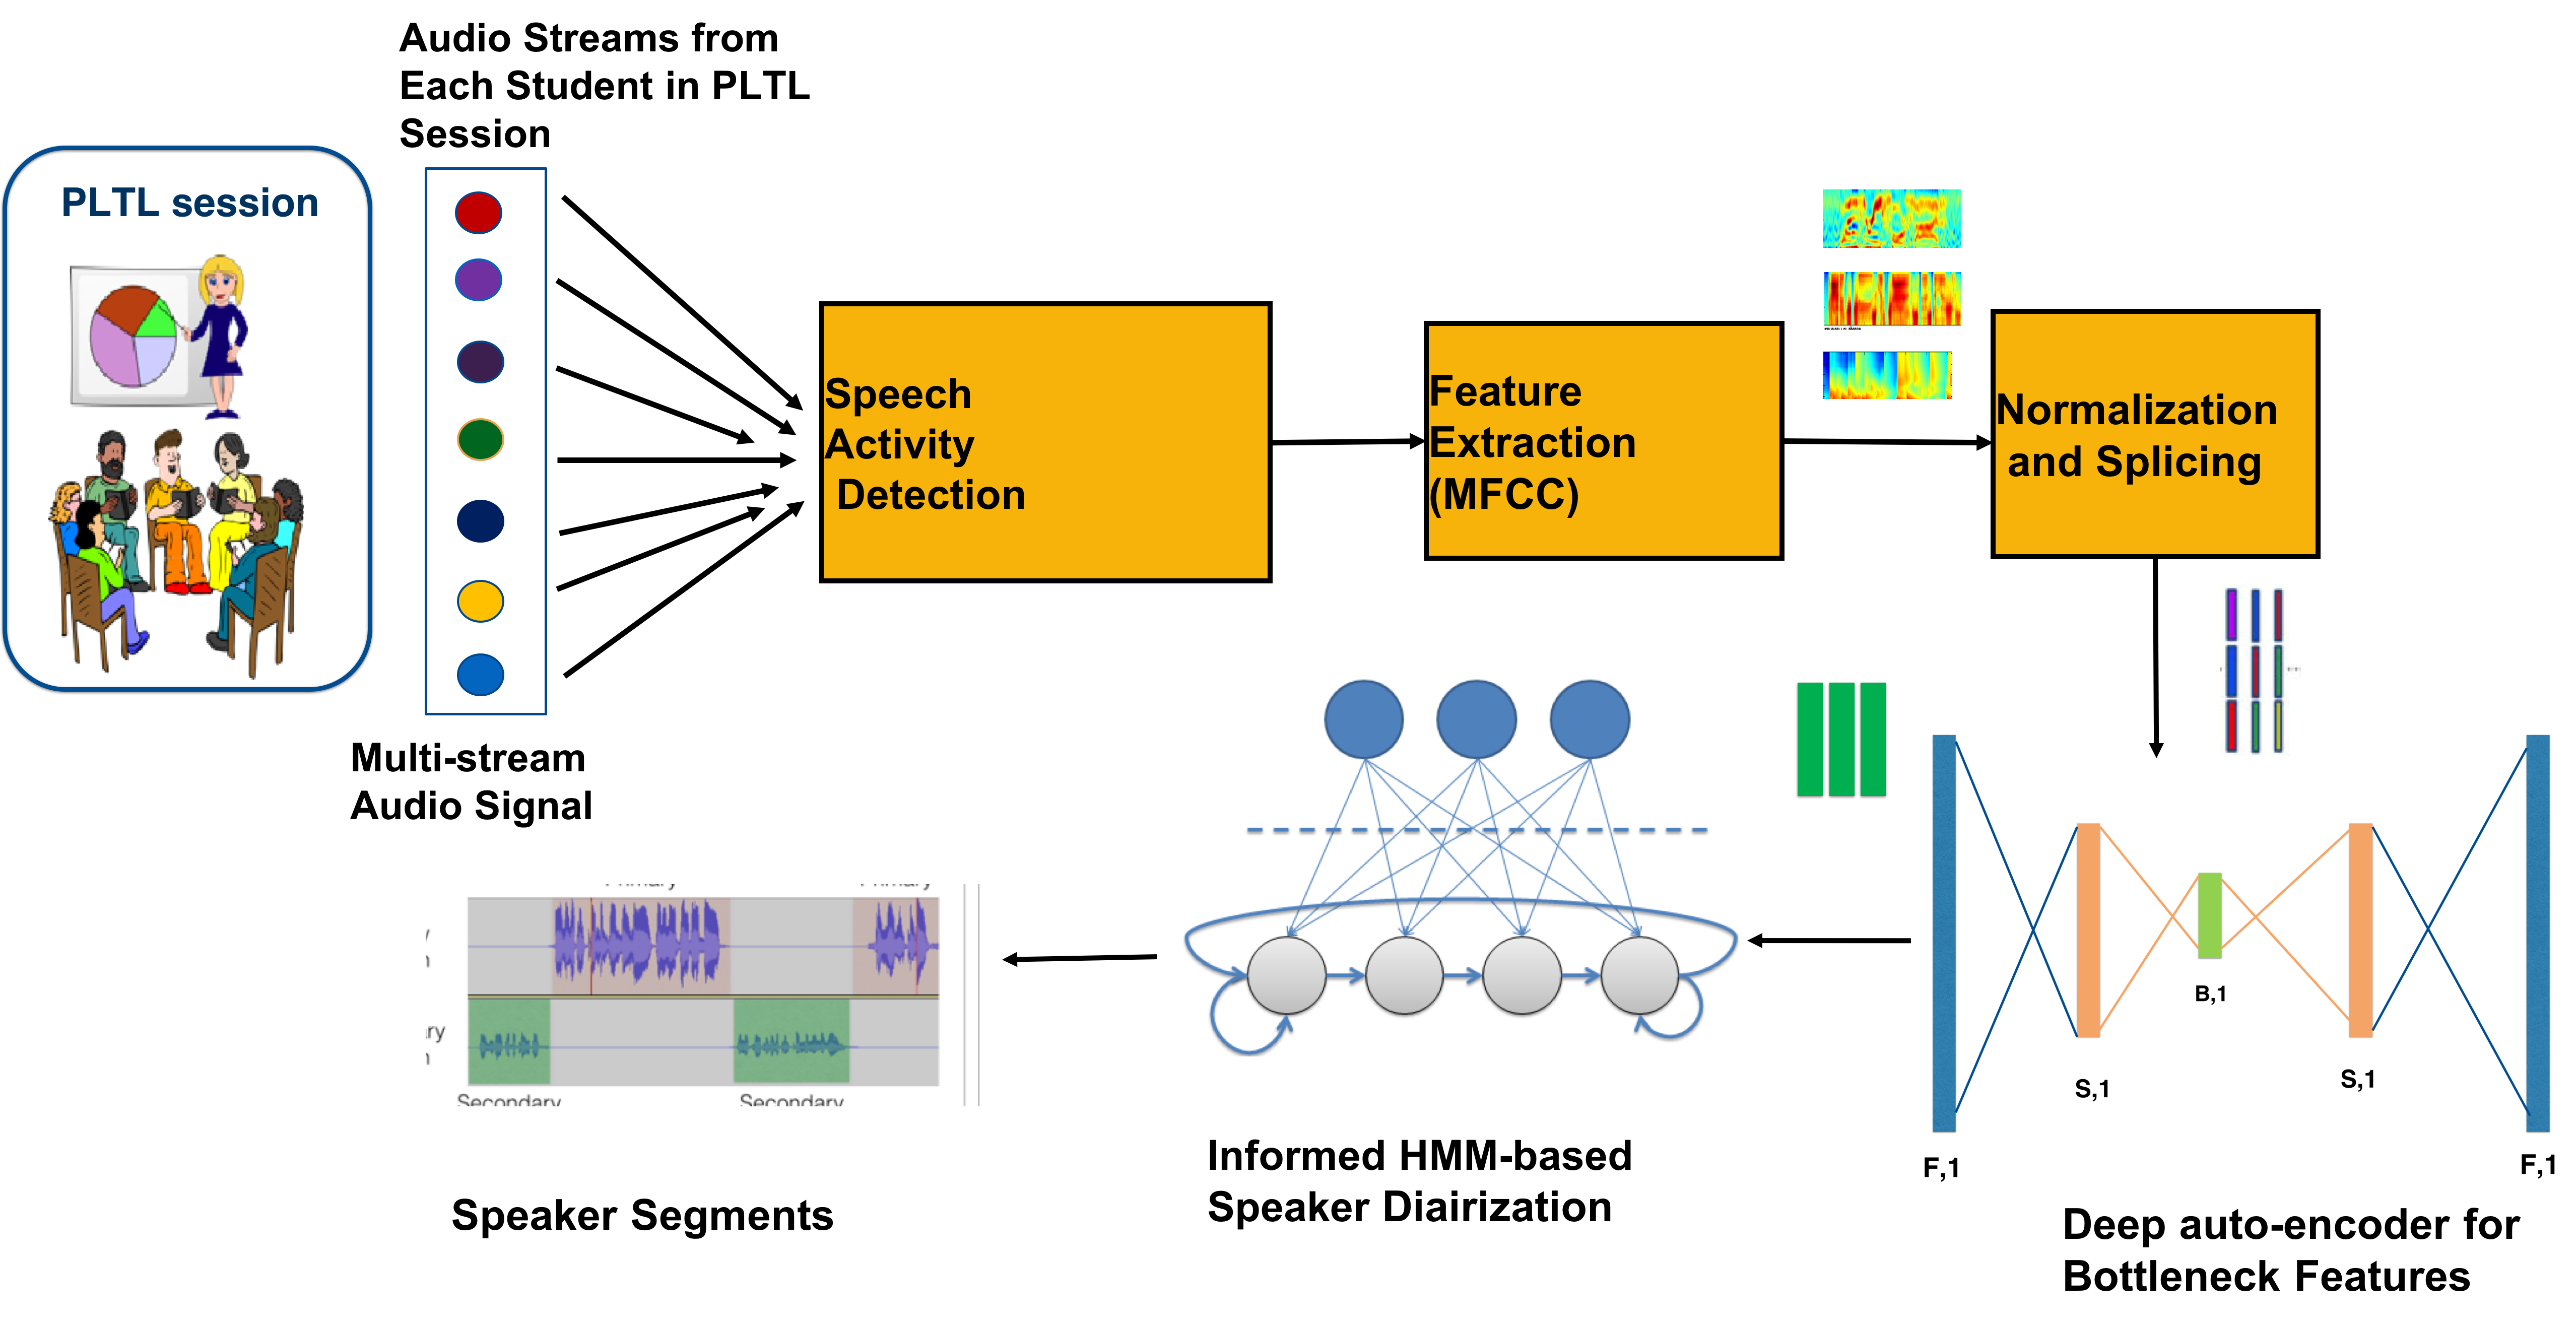
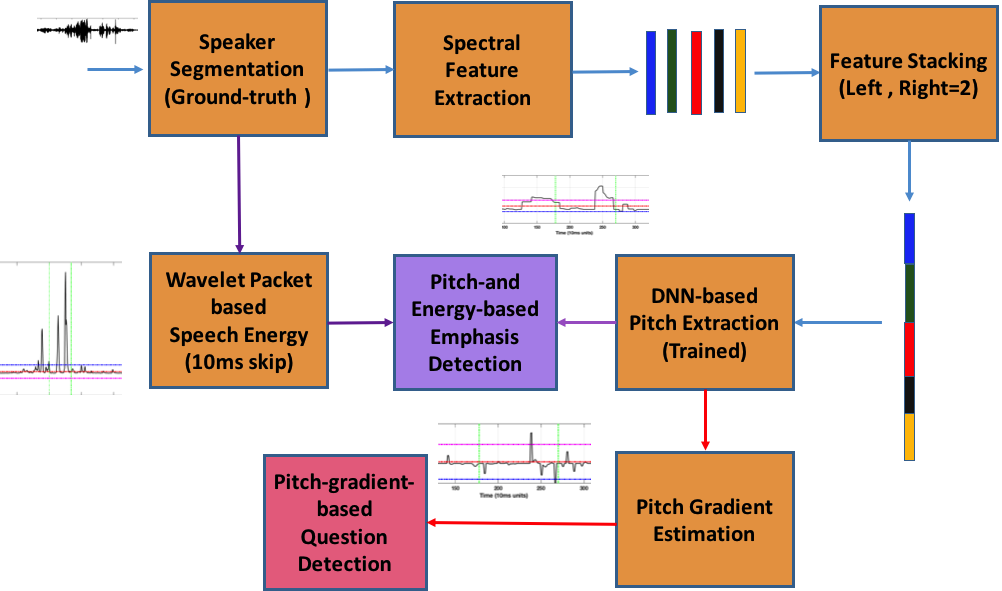
Authors established the domain of behavioral signal processing in Narayanan and Georgiou [58]. It refers to the use of computational methods and signal processing tools for extracting the behavioral patterns in human-human and human-machine communication. The present paper is a step towards extracting behavioral characteristics of students attending a PLTL session using acoustic analysis of their speech signal. Behavioral speech processing block performed acoustic analyses for extracting features that encapsulate behavioral aspects of conversations (See Figure 1). Particularly, the proposed extracted five features namely (1) participation; (2) dominance; (3) emphasis; (4) curiosity and (5) engagement from the speech signal. These features could be used for quantifying the behavioral characteristics in peer-led team learning sessions.
This paper made the following contributions in area of speech technology for behavioral analysis of PLTL sessions:
-
1.
Improved speech activity detection using DNN-based pitch and TO-comboSAD Ziaei et al. [88];
-
2.
Informed-HMM diarization system using bottleneck features obtained from stacked autoencoder;
-
3.
Extracting behavioral characteristics such as participation, dominance, emphasis, curiosity and engagement features from speech signal;
The developed methods were evaluated over disjoint evaluation datasets taken from CRSS-PLTL corpus (See Table 1).
| Eval dataset | Duration(minute) | Description |
|---|---|---|
| Eval-Set-1 | 70 | Diarization |
| Eval-Set-2 | 21 | Participation |
| Eval-Set-3 | 70 | Dominance rating |
| Eval-Set-4 | 30 | Emphasis |
| Eval-Set-5 | 30 | Curiosity (question-inflection) |
| Eval-Set-6 | 70 | Engagement (speech rate) |
| Eval-Set-7 | 87 | Speech Activity Detection |
| S.No. | Description | Assessment Type |
| Q1 | My PLTL group was friendly today | PG |
| Q2 | My PLTL group was engaging today | PG |
| Q3 | My PLTL group was helpful today | PG |
| Q4 | My PLTL group was motivated today | PG |
| Q5 | I learned a lot in today’s PLTL session | SP |
| Q6 | I felt comfortable with the interaction with my PLTL group today | SP |
| Q7 | My participation in today’s PLTL session increased my confidence in the course | SP |
| Q8 | Overall, the PLTL sessions are helping me do better in my course | Overall |
| S.No. | Q1 | Q2 | Q3 | Q4 | Q5 | Q6 | Q7 | Q8 |
| Q1 | 1 | 0.93 | 0.91 | 0.90 | 0.89 | 0.93 | 0.89 | 0.91 |
| Q2 | 0.93 | 1 | 0.92 | 0.93 | 0.90 | 0.92 | 0.0.90 | 0.89 |
| Q3 | 0.91 | 0.0.93 | 1 | 0.90 | 0.91 | 0.91 | 0.91 | 0.92 |
| Q4 | 0.90 | 0.93 | 0.90 | 1 | 0.88 | 0.91 | 0.88 | 0.90 |
| Q5 | 0.89 | 0.90 | 0.92 | 0.88 | 1 | 0.91 | 0.89 | 0.91 |
| Q6 | 0.93 | 0.92 | 0.91 | 0.91 | 0.91 | 1 | 0.92 | 0.92 |
| Q7 | 0.89 | 0.90 | 0.91 | 0.88 | 0.89 | 0.92 | 1 | 0.94 |
| Q8 | 0.91 | 0.89 | 0.92 | 0.90 | 0.91 | 0.92 | 0.94 | 1 |
2 Peer-Led Team Learning
Peer-led team learning (PLTL) is a methodology used for improving learning outcomes in small-group of students attending the same course. PLTL had been adopted in several US universities for various undergraduate courses. Each team is assigned a peer leader who coordinated discussions among students, and facilitated collaborative problem solving. The peer leaders had passed the same course in earlier semester and thus they were aware of the challenges in learning the subject. Peer leader knew the strategies that could help in mastering the technical content of the course. Peer leaders were not supposed to tell the solutions, rather they provided helpful hints and direction that could guide the students to collaboratively solve the problems.
2.1 CRSS-PLTL Corpus
This section briefly describes the CRSS-PLTL corpus that motivated the research discussed in this paper. The CRSS-PLTL corpus contains audio data from five PLTL teams for eleven weeks. Thus, a total of 55 PLTL sessions were recorded, each of which have multi-stream audio data. Each PLTL team had five to eight students and a peer leader. All the five PLTL teams were attending an undergraduate Chemistry course at the University of Texas at Dallas. The audio data collection was longitudinal over a three month window. Each PLTL session was organized for approximately 70 to 80 minutes. Each student wore a wearable pouch containing LENA digital recorder as shown in Figure 1. Thus, we have as many audio streams as students attending the PLTL session. LENA device could record audio signals for long-duration of up to sixteen hours and had been used for a variety of human-to-human communication research, for example adult-child interaction Sangwan et al. [67] etc..
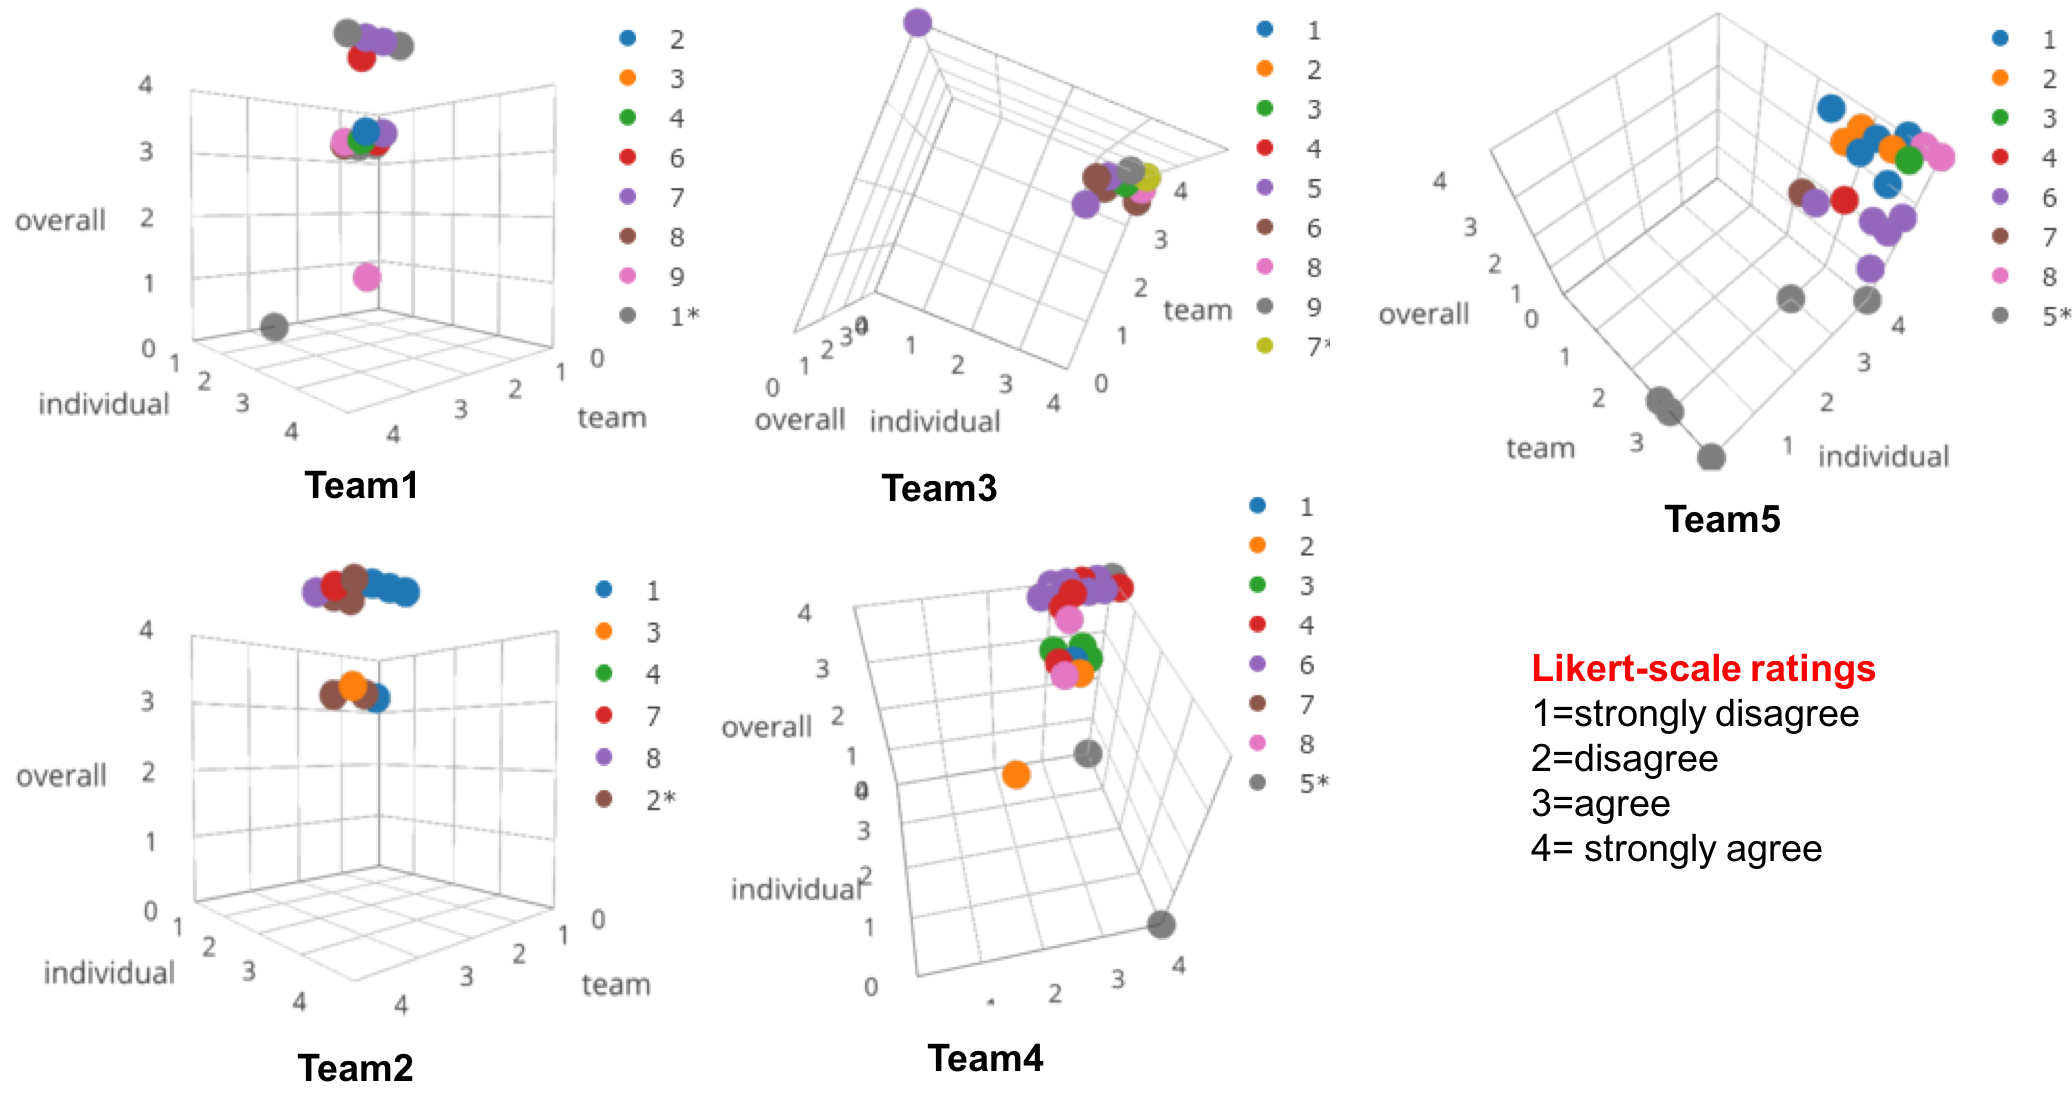
The CRSS-PLTL data contained huge reverberation and noise that pose challenges for speech processing 3. Several instances of significant degradation due to noise and reverberation were common. During such instances, the speech was not intelligible over several streams. After the PLTL session was concluded, each student and the peer leader completed a questionnaire. The questionnaire sought Likert-scale ratings for subjective questions regarding behavior, communication and learning etc. as given in Table 2. We would discuss these questions in Section 2.2, and Table 3. The ground-truth Likert scale ratings were combined into three dimensional scores as explained in Section 2.2 and visualized in Figure 2. Earlier, we introduced the CRSS-PLTL corpus in Dubey et al. [20].
2.2 Listening Tests & Annotation
Table 1 shows the duration and brief description of six evaluation set that were derived from CRSS-PLTL corpus for validation experiments. These seven evaluation datasets were annotated for diarization segments (Eval-Set-1), speech activity detection (Eval-Set-7), participation (Eval-Set-2), dominance(Eval-Set-3), emphasis (Eval-Set-4), curiosity in terms of question-inflection (Eval-Set-5), and engagement in terms of speech rate (Eval-Set-6). The duration of these evaluation sets were provided in Table 1. For analysis of behavioral characteristics such as dominance, emphasis, curiosity (in terms of question-inflection), engagement, we performed intelligent listening test. The annotators performed the listening test for labeling the behavioral characteristics. Different evaluation sets were made out of CRSS-PLTL data for evaluation of each of the behavioral characteristics. Using different (disjoint) evaluation dataset was to make sure that annotation bias was the least as some of the studied behavioral characteristics were correlated.
The evaluation set for question-inflection detection was thirty minute audio data. We used another thirty minutes of data for evaluation of emphasis detection algorithm. For the listening test, an annotator marked the start-time and end-time of audio segments composed of (1) emphasized-speech regions and (2) interrogative utterances/questions. The goal of audio analysis was to detect the temporal boundaries of segments with emphasized-speech and question-inflection.
It is important to note that the semantic aspects were taken into account during ground-truth annotations. For instance, the emphasis was marked on the basis of what was said and how it was spoken in the given context. The same procedure was applied for question-inflections. However, the algorithms developed for detecting these two phenomenon are based on acoustics features only (fundamental frequency and energy). The speaker diarization ground-truth was obtained on Eval-Set-1 that contained 70 minute audio. Participation refers to annotating the percentage time for which a speaker was active in the PLTL session (Eval-Set-2). For measuring the engagement in terms of speech rate, annotators listened to each five minute segment of PLTL session and note down the number of words spoken. Five minutes segment were derived for Eval-Set-6 that consists of 70 minutes audio data. We discuss the results in Section 6. The speech activity detection was evaluated on 87 minutes of audio data from a PLTL session (Eval-Set-7).
The dominance ratings (ground-truth) were obtained on each five minute segment of Eval-Set-3 (70 minutes). There were seven students in Eval-Set-3. For each five-minute segment, we compute a dominance score () for each of the seven students using unsupervised acoustic analysis explained in Section 5.2. Each five-minute segment of Eval-Set-3 was assigning a ground-truth dominance rating () for each student per segment. Three annotators listened to each five-minute segment and assigned a dominance rating () for each student per segment. The ground-truth dominance rating, , was a number between 1 and 5. The speakers who were present in the whole session but did not speak in the chosen segment were assigned a dominance rating, . The scores of and were assigned to the least-and most-dominant students who spoked in that segment. For students who spoke in that segment and were neither least-dominant nor most-dominant, we assigned them a between 2.25 and 4.75. It was possible to score 2.25, 2.50, 2.75, 3.0, 3.25, 3.50, 3.75, 4.0, 4.25, 4.50 and 4.75. However, no fractions other than these were used to ensure consistency in evaluations. We averaged the ground-truth rating () of all three annotator to get a final ground-truth that was used for computing the correlation with unsupervised dominance score ().
2.3 Exploratory Data Analysis
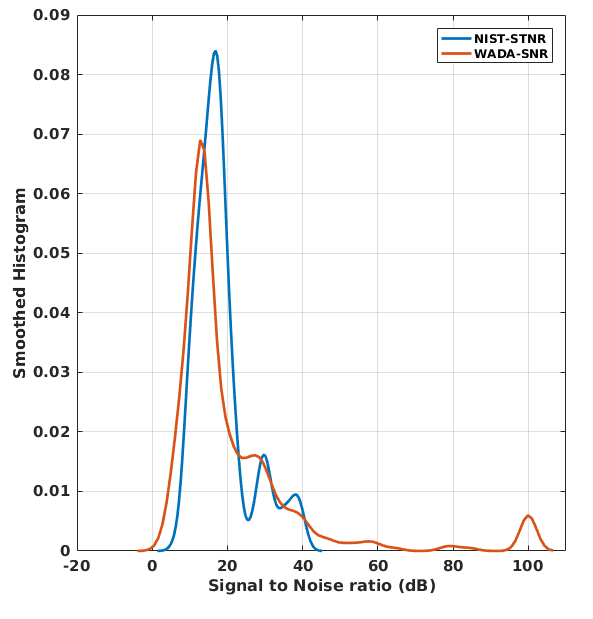
In this section, we discuss general characteristic of PLTL data. Figure 3 shows the distribution of WADA-SNR Kim and Stern [40] and NIST-STNR NIST 60 signal to noise ratios computed over five-minute segments of 36 hours of PLTL data from three teams. Each team has nine audio streams. The NIST-STNR has tri-modal distribution with significant first model. One the other had, WADA-SNR has bi-modal distribution where first model is significant. The SNR over five-minute segments was mostly between 0 and 15 dB that showed moderate-to-high noise levels. In addition, huge reverberation was also present that could not be visualized in this plot.
At the end of PLTL sessions, each student and their peer leader completed a form that contained eight behavioral question with four options on Likert-scale (see Figure 2). Questions (Q1, Q2,…,Q8) were given in Table 2. These questions belong to three categories, namely PLTL group (PG) assessment, students performance (SP) and overall. The questions Q1, Q2, Q3 and Q4 were regarding the PLTL group (PG) and questions Q5, Q6 and Q7 were based on students performance (SP). The last question, Q8 summarizes the overall assessment. These responses were done on a Likert-scale with four choices, namely strongly disagree(1), disagree(2), agree(3), strongly agree(4) (see Figure 2). Each of these eight questions had a response from each student while team leader responded to only PG and overall category of questions.
Table 2 shows the statement of these questions and its categorization as PLTL group (PG) assessment, students performance (SP) and overall. The Spearman’s rank correlation uses ranks instead of the actual values used by the Pearson’s correlation. Table 3 shows the pair-wise Spearman’s rank correlation between ground-truth responses of each question. We could see that among pair-wise correlation between questions Q1 to Q4, the minimum and maximum values were 90% and 93% respectively. The same values for questions Q5, Q6 and Q7 were 89% and 92%. This showed the responses were consistent with respect to categorization. If we see the correlation between Q8 and other questions, we have minimum and maximum values of 89% and 94%. This table gave hints that instead of using responses from eight questions, we could reduce this to a smaller set.
Finally, we averaged the responses to question Q1 to Q4 and called it feature. Similarly, the average of Q5, Q6 and Q7 was called as feature. The Q8’s response was denoted as feature. We did the averaging operations over all responses from each participant. Figure 2 showed these three features , , and for all sessions of each team separately. This serves as visualization of behavioral dynamics of each team.
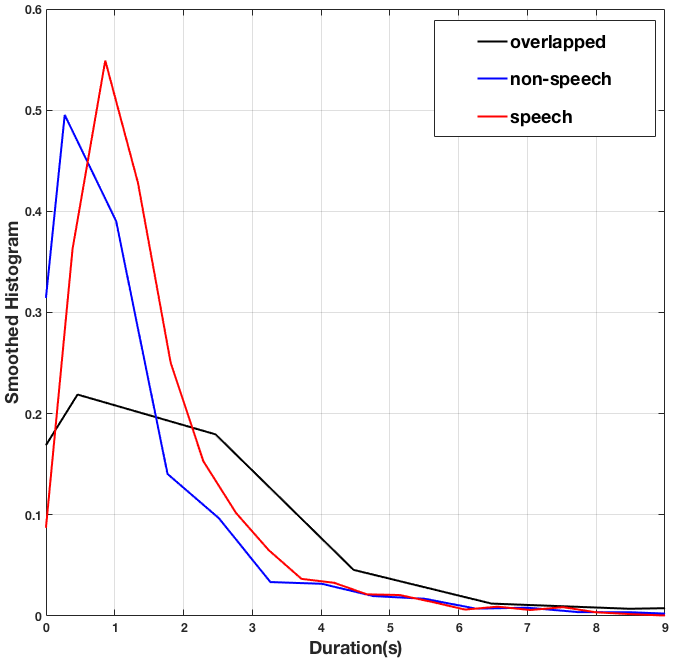
Figure 4 showed the distribution of duration of segments with speech, non-speech and overlapped-speech. We could see that most segments were short with less than 1 second duration. Short-duration segments were challenging with respect to speaker diarization and behavioral speech processing. We used ground-truth information from a PLTL session with approximately 87 minutes of audio data for generating this figure (Eval-Set-7, see Table 1). The overlapped-speech and non-speech accounted for 28.71% and 29.57% of total duration leaving behind 41.72% speech. The total number of overlapped-speech, non-speech and speech segments were 205, 738 and 1316 respectively, for this data. The data used for this analysis were Eval-Set-7 as given in Table 1. We used this dataset for validating the speech activity detection based on fusion of DNN-based pitch estimation and TO-combo-SAD Sadjadi and Hansen [66], Ziaei et al. [88]. The results were shown in Table 7.
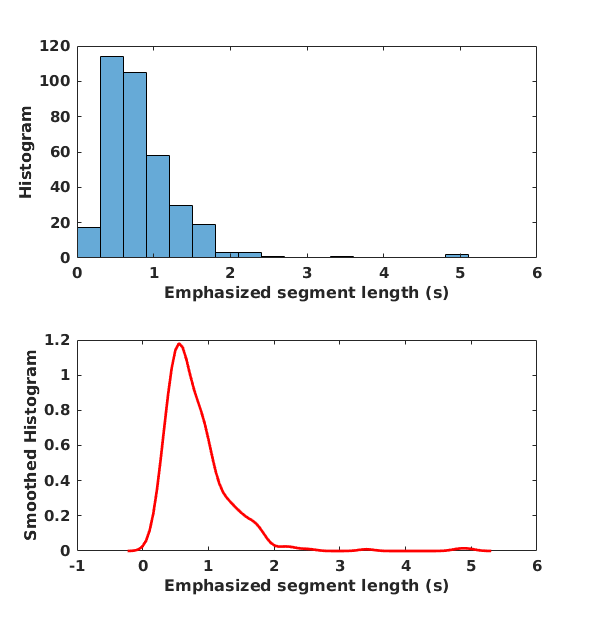
Figure 5 shows the distribution of duration of emphasized speech segments. Ground-truth information from a PLTL session with approximately 80 minute duration was used for generating this figure. It showed that most of the emphasized segments had duration less than 1 second.
3 Proposed Speech System
Figure 1 shows the block diagram of the proposed speech pipeline. The multi-stream audio data from PLTL sessions was first processed with speech activity detection (SAD) and speaker diarization module to get the individual speaker segments. The output of diarization system facilitate behavioral speech processing in second stage. The behavioral speech processing refers to a set of acoustic analyses that extracts the behavioral characteristics such as participation, dominance, emphasis, curiosity and engagement from speech segments.
3.1 Speech Activity Detection
Speech activity detection (SAD) was evaluated on Eval-Set-7 (See Table 1 and the dataset was explained in Section 2.3. The evaluation results of SAD algorithms are collected in Table 7). Figure 4 shows the distribution of duration of speech, non-speech and overlapped-speech segments. Non-speech often contained several noise sources such as mumbling of far-speakers, writing-on-the-white-board noise (impulsive) in addition to noise from fan and other background sources.
We used DNN-based pitch extractor(see Section 3.3) along with TO-combo-SAD Ziaei et al. [88] for SAD. The frames that were assigned zero (0 Hz) pitch were declared non-speech. TO-combo-SAD Sadjadi and Hansen [66], Ziaei et al. [88] was SAD system developed for DARPA RATS data. TO-combo-SAD had shown good performance on naturalistic audio streams such as NASA Apollo mission data. TO-combo-SAD assigned zero (0) for non-speech and one (1) for speech. We fused the output of both systems for accurate speech activity detection. The frames with non-zero pitch were taken as speech frames and assigned one (1) as SAD output. If both system’s output (DNN-based pitch and TO-combo-SAD) were not same, we consider those frames as non-speech. As a results, false alarms were greatly reduced. The non-speech in evaluation dataset has multiple simultaneous sources that results in high false alarm for individual SAD system. We evaluated the SAD system on Eval-Set-7 data as shown in Table 7. and refers to miss rate (true-speech detected as non-speech in ) and false alarm rate (true non-speech detected as speech in ), respectively.
In addition to the proposed fused SAD system, we used a supervised SAD system trained on DARPA RATS data Van Segbroeck et al. [74] and compare its performance with proposed SAD system. The comparison results were shown in Figure 7. This was a supervised Neural Network-based SAD system. The Gammatone, Gabor, long-term spectral variability and voicing features were combined together and used for training the neural network. This system was developed for DARPA Robust Automated Transcription of Speech (RATS) program Van Segbroeck et al. [74]. Authors extracted features using speech characteristics such as spectral shape, spectro-temporal modulations, periodicity (pitch harmonics), and long-term spectral variability. Authors used the features from long context-windows to get combined feature vector. These features were used for training a neural network Van Segbroeck et al. [74]. The evaluation on DARPA RATS corpora showed accurate results, thus validating the applicability of developed SAD system for highly distorted conditions such as those in DARPA RATS Van Segbroeck et al. [74].
It is important to note that the PLTL data has (1) not-so-close microphone; and (2) small movement in students, such as moving to white board and writing something, was frequent event that made SAD a challenging task. In addition, huge reverberation and noise corrupted the speech data further. The informed HMM-based diarization system was shown in Figure 7. We would discuss the proposed bottleneck features and informed HMM-based diarization system in Section 4.3.
| Parameter | Value |
|---|---|
| Sampling rate | 8000Hz |
| Frame rate | 25ms |
| Skip-rate | 10ms |
| Super-segment size | 2s |
| Features | Pitch Estimation Filter with Amplitude Compression Gonzalez and Brookes [29] |
| Splicing context (past) | 2 frames |
| Splicing context (future) | 2 frames |
| Number of Hidden Layers in DNN | 3 |
| Number of Hidden Nodes (three layers) | 1600 |
| Hidden Layer activation | Sigmoid |
| Output Layer activation | Soft-max |
| Output Layer dimension (pitch states) | 68 |
3.2 Speech Energy
Earlier, we used the formant energy for computing the speaker energy. This energy was leveraged for separating the primary and secondary speakers on each channel of the multi-channel PLTL data (wearer was primary speaker and rest secondary) Dubey et al. [20]. More often than not, the wearer was assumed to be the closest to their LENA device as compared to other LENA devices. Thus, the audio channel with highest energy could identify the primary speaker. These intensity differences helped in refining diarization output in one of our previous studies Dubey et al. [20]. Later, we computed the energy of speech signal using wavelet packet decomposition Dubey et al. [21]. We choose wavelet packets over formant energy that was used in our earlier studies Dubey et al. [20].
Formant energy was noise-robust, unlike short-time Fourier transform at the cost of huge computational load. Wavelet packet decomposition was noise-robust and possessed good resolution in time-frequency space with moderate computational load Wickerhauser [82]. Wavelet packets provided good time-frequency resolution with reasonable computational expense. The position, scale and frequency parameters characterize the wavelet packets Wickerhauser [82]. Traditional wavelet decomposition had only two parameters, namely (1) position; and (2) scale. Wavelet packets could be viewed as a generalized form of wavelet decomposition. Wavelet packets provide better signal resolution in terms of scale, position and frequency dependence. Wavelet packets are bases generated from decomposition of a signal using orthogonal wavelet functions. There are several computationally simple methods for estimating wavelet packets, that made them a better choice for signal decomposition than computationally expensive continuous wavelet transforms.
Traditional wavelet decomposition generates approximation coefficient vector and detailed coefficient vector after first level of decomposition. At next level and successive levels of decomposition, only approximation coefficient vector is re-decomposed into its approximate and detailed components. On the other hand, wavelet packet decomposition allows each detailed coefficient vector to be decomposed in the same way as the approximate coefficient vector Wickerhauser [82]. For a speech segment, wavelet packet decomposition generated a complete binary tree allowing a more generic decomposition of the signal. Symlets6 (sym6) wavelet with six levels of decomposition were used for computing the energy. We added the squared wavelet packet coefficient corresponding to the frequency range [50, 2000] Hz for capturing the speech intensity while ignoring the spurious background artifacts and noise. We used the speaker energy for estimating the unsupervised dominance score as discussed in Section 5.2 and also in emphasis detection (see Section 5.4).
3.3 Robust Pitch Estimation
This section describes the robust pitch extraction using deep neural network trained on stacked spectral features (Pitch Estimation Filter with Amplitude Compression) Gonzalez and Brookes [29]. The pitch estimates were later used for detecting curiosity (in terms of question-inflection) and emphasized speech.
We tested various pitch estimation algorithms such as modified autocorrelation method De Cheveigne and Kawahara [19], Sawtooth Waveform Inspired Pitch Estimator Camacho and Harris [13], Subband Autocorrelation Classification Lee and Ellis [45] and deep neural network (DNN) Han and Wang [31]. The state-of-the-art pitch tracking method use a deep neural network (DNN) trained on spectral features Han and Wang [31] for predicting the pitch states. DNN-based pitch tracker was the best among four alternatives we tested. The parameters of system used for pitch extraction is given in Table 4.
We would briefly cover the DNN-based pitch estimator adopted from Han and Wang [31]. The stacked spectral features (Pitch Estimation Filter with Amplitude Compression) Gonzalez and Brookes [29] were used to train three-hidden-layer DNN to learn the pitch states. Viterbi decoding was used to connect the probabilistic pitch states, thus fetching the pitch contours. DNN pitch tracker was robust to high amount of noise and worked well for PLTL data. Authors compared the accuracy of DNN pitch tracker with other methods in Han and Wang [31]. Spectral features used for training DNN (See Figure 9) were developed in Gonzalez and Brookes [29]. The log-frequency power spectra was normalized to capture long-term information and further filtered to suppress the noise and enhance the harmonic structure in speech frames Gonzalez and Brookes [29].
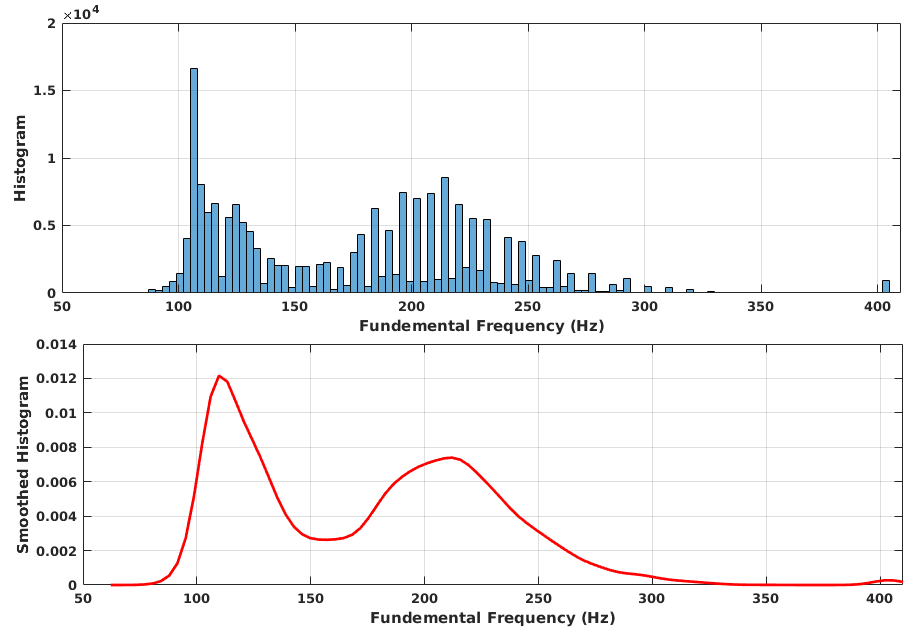
Pitch Estimation Filter with Amplitude Compression features were earlier used for pitch tracking in noise by peak-picking Gonzalez and Brookes [29]. These features were stacked using two past and two future frames as shown in Figure 9 (see Table 4). The reverberation and noise in CRSS-PLTL data posed challenge for pitch extraction that necessitated use of DNN-based pitch tracker. We smoothed the DNN extracted pitch using Savitzky-Golay filter Schafer [68] with third order and 11 frames. The smoothing helped in further correction of pitch values for PLTL data. Figure 6 show the distribution of pitch estimates obtained using DNN-based system. It was obtained on a 80 minute audio from a PLTL session. DNN could accurately estimate the pitch eliminating the pitch doubling that was common in unsupervised methods for pitch estimation. The non-speech frames (corresponding to fundamental frequency of 0 Hz) were dropped for plotting this distribution.
4 Robust Speaker Diarization
4.1 Baseline LIUM Diarization System
We used the LIUM speaker diarization system as the baseline Meignier and Merlin [52]. The standard LIUM system has poor performance as shown in Table 6. Sampling rate of 8 kHz was used for all experiments reported in this paper. The speech data was divided into 25ms frames with 10ms skip-rate. LIUM system uses ILP clustering on i-vectors. LIUM performed best on broadcast news recordings where turns were significantly longer than turns in PLTL. The reason LIUM could not accurately segments the speakers in PLTL data is due several factors such as (1) short conversational-turns; (2) reverberation; (3) non-speech such as noise, laughter etc.; (4) overlapped speech.
We used diarization error rate (DER) as the figure of merit for diarization systems. DER, as defined by the NIST Rich Transcription Evaluation NIST [61], could be computed as,
| (1) |
where was the total number of non-speech segments detected as speech(false alarm), is the total number of the speech segments detected as non-speech (miss), is the total number of speech frames that were clustered as incorrect speakers (error in clustering), and is the total number of ground-truth speech frames.
4.2 Stacked Autoencoder-based Bottleneck Features for Diarization
The proposed scheme was depicted in Figure 7. Deep neural network (DNN) could be used for dimension reduction for high dimensional feature vectors Hinton and Salakhutdinov [32]. Autoencoders were found useful in dimension reduction task Wang et al. [81]. This network was trained in a way that allowed it to learn low-dimensional hidden representation of the data such that taking noisy input, it could reconstruct the input.
Input feature vectors were corrupted with additive random noise. We used 13 dimensional Mel-Frequency Cepstral Coefficients (MFCC). Each feature dimension was mean and variance normalized. We performed splicing of normalized feature vectors by taking five past and future frames. The stacked autoencoder was used for extracting the bottleneck features (bottleneck) from spliced and normalized MFCC features. Several autoencoders were stacked to form a deep network with five layers. Stacked autoencoder was trained using spliced features. Stacked autoencoders were first trained in layer-wise fashion that is a standard way of pre-training. After pre-training, stacked autoencoder was fine-tuned so that it could reconstruct the input features. The input to the stacked autoencoder was corrupted before feeding into it. The reconstruction-loss was minimization criterion for training this network Vincent et al. [77].
We used PDNN toolkit Miao [53] with corruption parameter 0.2, learning rate, and momentum factor parameters of 0.01 and 0.05, respectively for realizing the stacked autoencoder. The parameters of the stacked autoencoder used for bottleneck feature extraction was given in Table 5. The feature vectors (13-MFCC) were first mean and variance normalized. Let was the feature vector, and were the mean and standard deviation vectors, respectively. The normalized feature vector, , is given by .
Since all the channel were delayed and scaled versions of the same speech signal at a given frame, using all channels for diarization was important. Time-spliced feature vectors from each channel were concatenated to form a supervector that consisted of feature vectors corresponding to all PLTL channels. The room where PLTL data was collected has dimensions of 7X10 meters. Thus, the maximum distance between a LENA device and any students (other than the wearer) can be assumed to be within ten meters. Taking the speed of sound in air to be 343 meters per second (m/s), we have the maximum time delay, to be of the order 30ms. This calculation did not accounted for reverberation. We used 25ms windows with 10ms skip-rate for our experiments as given in Table 5. We concatenated the features from all streams. The normalized feature super-vectors were spliced by taking five past and future frames. The concatenation was done to incorporate time and intensity differences between various channels of multi-stream PLTL data. The splicing incorporates the long-term context leading to a better quantification of reverberant and noisy speech frames. For a PLTL group with seven streams, the final dimension of spliced features was 11*7*13-MFCC, i.e., 1001.
4.3 Informed-HMM based Diarization System
In this section, we discuss informed-Hidden Markov Model (HMM) for joint speaker segmentation and clustering. HMM system incorporate the bottleneck features from stacked autoencoder system Gehring et al. [27] along with two dimensions of side information, i.e., (1) number of speakers; and (2) minimum duration of conversational-turns. Hence, we called the system as informed HMM system. The iterative diarization procedure had three steps: (i) initial segmentation, (ii) merging, and (iii) re-estimation.
The diarization for PLTL sessions was different with respect to information available such as speaker-count and turn-statistics. The rapid short-turns, overlapped-speech and significant noise and reverberation made the task challenging. Most of the studied diarization system did not address such challenges Dubey et al. [20], Anguera et al. [3]. PLTL sessions had frequent short-segments of size 0.2s to 1s and few segments of size 1-3s. HMMs had been used in previous studies for various audio segmentation tasks in varied forms Fredouille and Senay [24], Madikeri and Bourlard [48], Kotti et al. [42], Ajmera et al. [1], Huang and Hansen [33]. However, using side information, application to PLTL and using stacked autoencoder-based bottleneck features were novel contributions with respect to speaker diarization.
Initially, we performed over-segmentation by dividing speech into segments where was four to six times the expected number of speakers. A HMM with states was assumed for initial segments. Each HMM state had an output probability density function that was modeled by component Gaussian Mixture Model (GMM). Each state of HMM was allowed to have sub-states to incorporate the minimum duration constraint. All sub-states of a given HMM state (hypothesized speaker cluster) share the GMM corresponding to their state. The HMM system was trained using Expectation-Maximization (EM) algorithm. One step aimed to segment the data such that their likelihoods given corresponding GMM parameters were maximized. In next step, the GMM parameters were re-estimated based on new segmentation. Once HMM was trained, we obtained the Viterbi path for each frame. Following it, we used the Viterbi path for checking the binary merging hypothesis based on modified algorithm Dubey et al. [20]. After the merge iteration finished, a new HMM with less number of states was trained. The whole process was repeated again till the number of HMM states equaled the number of speakers.
We performed merging based on algorithm that was a variant of BIC and eliminated the need of the penalty term. The unsupervised algorithm Dubey et al. [20] was used for deciding the binary hypothesis of merging two segments. This trick was first developed to improve the speaker change detection as compared to BIC Ajmera et al. [2]. In this paper, we used the same techniques for a different binary hypothesis to decide merging of two over-segmented segments or equivalently two HMM states. There are some modifications to algorithm applied for merging most-similar segments (HHM states) at each iteration of the informed HMM-based diarization system. First, the minimum duration of staying in a HMM state was much lower, 0.2s to 0.5s owing to the rapid short conversational-turns. The initial segments were modeled with a Gaussian Mixture Model (GMM) with only components. After merging two initial segments modeled with components, the merged segment was modeled with components. Thus, the number of parameters in GMM model for merged segment is same as the sum of number of parameters in child segments. Consequently, the number of parameters remains the same at each merging step, and hence the penalty term in BIC criterion (See Equation 5) is eliminated.
Let be the feature matrix corresponding to the merged HMM states. Merging two segments, and into can be formulated as the following binary hypothesis: vs. , where denotes merging, and denotes no merging. To facilitate the test, we build models for both hypotheses. GMMs were used to model , and merged segment . Let be the parameter vector of the GMM with component estimated for the merged segment, . Let, and be the parameter vector of the GMMs with and components, estimated for the child segments, and , respectively. Under the assumption of independence and identical distribution of feature vectors in segments and , we can represent the log likelihood and for hypotheses and , respectively as
| (2) |
| (3) |
where is the likelihood of merged segment, given the model, , and so on. The merging decision is made based on the , defined as
| (4) |
However, if we used Bayesian Information Criterion (BIC) for making the merging decision, then corresponding to Equation 4, we have following expression for BIC merging:
| (5) |
where is a constant usually assigned a value of and is the number of feature vectors in merged segment, . Here, is the difference in number of parameters in merged model, and sum of parameters in child models, and . All segments were evaluated for . The segments with were merged. Once the merging done, the new HMM of smaller size was estimated where the GMM for each state was re-estimated using the EM algorithm. The acoustic features belonging to that HMM state (cluster) were used to re-estimate the corresponding GMM.
5 Behavioral Characteristics
5.1 Participation Analysis
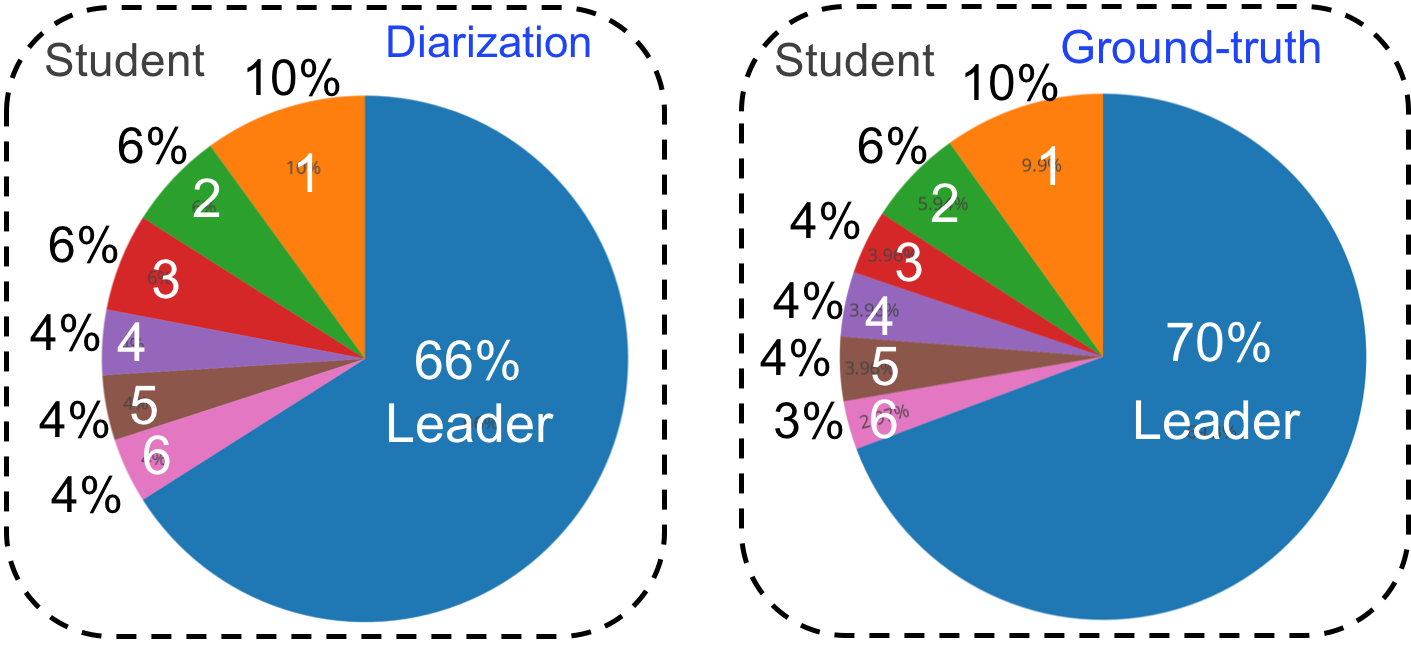
Diarization output could be used for extracting participation analysis, that refers to the percentage of total time for which each speaker and their team leader occupied the conversation floor. Figure 8 shows the participation analysis obtained using 21 minutes of data, Eval-Set-2 (See Table 1) from a PLTL session. The comparison between diarization-based participation analysis and ground-truth clearly shows that even if diarization error rate is non-zero, we can still derive meaningful participation analysis from it. The percentage values were rounded-up for better visualization.
5.2 Dominance Score
Dominance in human-to-human communication had been studied for several decades Young [86]. Dominance is a fundamental aspect of interactions in PLTL sessions. The researchers in social psychology have studied dominance in human interactions Dunbar and Burgoon [22]. The speaking time of speakers were found to be correlated with perceived dominance of individuals in groups Mast [49]. Researchers in social signal processing studied dominance models developed from multi-modal data.
Authors measured the dominance in meeting using the speaker diarization techniques Hung et al. [34]. Authors developed a supervised model for dominance using short-utterances Basu et al. [10]. However, the model was developed and evaluated on a constrained settings that was very different from real-life situations such as PLTL sessions. Authors analyzed the interaction between two individuals who debated for 60 seconds. Such controlled settings and short-duration analyses were not applicable for spontaneous conversations such as those in PLTL sessions. Authors used multi-modal features derived from audio and video streams for analyzing the dominant persons in meetings Hung et al. [35].
Authors used manual transcriptions of meetings for generating semantic metrics that were later used for training static and dynamic models of dominance Rienks et al. [64]. However, they did not process the audio rather the text was processed to build the supervised models. Such systems could not be deployed for analysis of PLTL groups as they required scripting and training supervised classifiers. Authors proposed a dominance model for meetings based on supervised learning using multi-modal data (multi-microphone audio and multi-camera video). The audio and visual data were used for training support vector machine classifier. It was used for training the supervised dominance model for meeting conversations Jayagopi et al. [37]. However, such a system need supervised training on huge amount of labeled multi-modal data and was likely to perform poorly under mismatched conditions. Another limitation was that it could not be used if only audio data were available from PLTL sessions.
We developed an unsupervised feature for measuring dominance Dubey et al. [21]. Dominance score (DS) was assigned to each student by unsupervised acoustic analysis of their speech segments. The proposed DS encapsulates the probability of a given student to be dominant in collaborative problem solving. We considered three features derived from speech corresponding to each speaker. This information was available from informed HMM-based diarization system (see Figure 7).
The three features are turn-taken-sum () Larrue and Trognon [44], speaking-time-sum (), and speaking-energy-sum (). These features were motivated from social psychology literature where the dominance of a speaker was found to be correlated with taking more turns in a conversation, speaking for longer duration Mast [49], and with higher energy Dunbar and Burgoon [22].
These features were correlated among themselves. For example, a person who was taking many turns was likely to speak for longer duration than others. Also, adding the speaker energy for a longer duration would result in higher . The turn-taken-sum () was the number of turns taken by the speaker in a given session. A conversation turn was decided by a speech segment from the speaker cascaded between that from other speakers and/or speech pauses (non-speech). The speaking-time-sum () was the sum of duration of all time-segments (in seconds) belonging to that speaker. The overlapped speech was not taken into account in this sum. Speaking-energy-sum () was sum of energies for that speaker’s segments.
The speech energy was computed using wavelet packet decomposition Wickerhauser [82] as discussed in Section 3.2. The PLTL data had huge reverberation and noise, that necessitated development of better metric for computing speaking energy. We used the Symlets6(sym6) wavelet with six levels of decomposition for computing the speech energy. The coefficients corresponding to frequency range [50, 2000] Hz were summed to get the energy.
After extracting these three features, , and , we normalized each feature dimension. Let be the three dimensional feature-vector, and being the mean vector and standard deviation vector. The normalized feature vector, , is given by . Here, the division is point-wise, the mean and variance were calculated over the entire PLTL session (approximately 70-80 minute audio).
We projected these normalized features onto eigen space corresponding to the highest eigen value of the feature space. This was realized by principal component analysis (PCA) that combined the three features into a single feature, named feature (short form for combined feature). Let us denote the feature by . We computed the feature for each speaker in each segment of the PLTL session. PCA was performed for the whole PLTL session. In this paper, we divided the entire PLTL session into five-minute segments. A dominance score was estimated for each speaker during five-minute segments.
Lets say, was the feature corresponding to speaker. For CRSS-PLTL corpus we have six to nine speakers in sessions including team leader. We defined feature-vector as, , where was the number of speakers. The dominance score (DS) for each speaker was estimated by processing the dominance feature-vector, , through a soft-max function that convert these numbers into probability scores. Thus, we had
| (6) |
for ; where was the dominance score (DS) of the speaker.
Once we have the dominance score, finding the most and least dominant speaker was trivial. The one with highest score was the most dominant person while the one with lowest was least dominant. In PLTL sessions, the dominance score of each students is an important metric with respect to inter-session variability for all sessions of that team. From previously studied supervised dominance models that predicted only the most dominant speaker, such a comparison would not be possible Jayagopi et al. [37], Hung et al. [35], Huang and Hansen [33]. Dominance analysis could help in understanding the role of each team member in a PLTL session with respect to learning of their own and others. It could help in choosing suitable candidates for a PLTL session so as to maximize the learning outcome for each one of them.
5.3 Curiosity: Question-Inflection Detection
Curiosity refers to a desire for gaining new information or skill Renner [63]. Curiosity was defined in the study as "aurally identifiable trait of the internal desire" of PLTL participants to acquire new information or skills. The curiosity is an important trait in learning Renner [63]. A pitch transform was used for synthesis of interrogative sentence in Nagy and Nemeth [57].
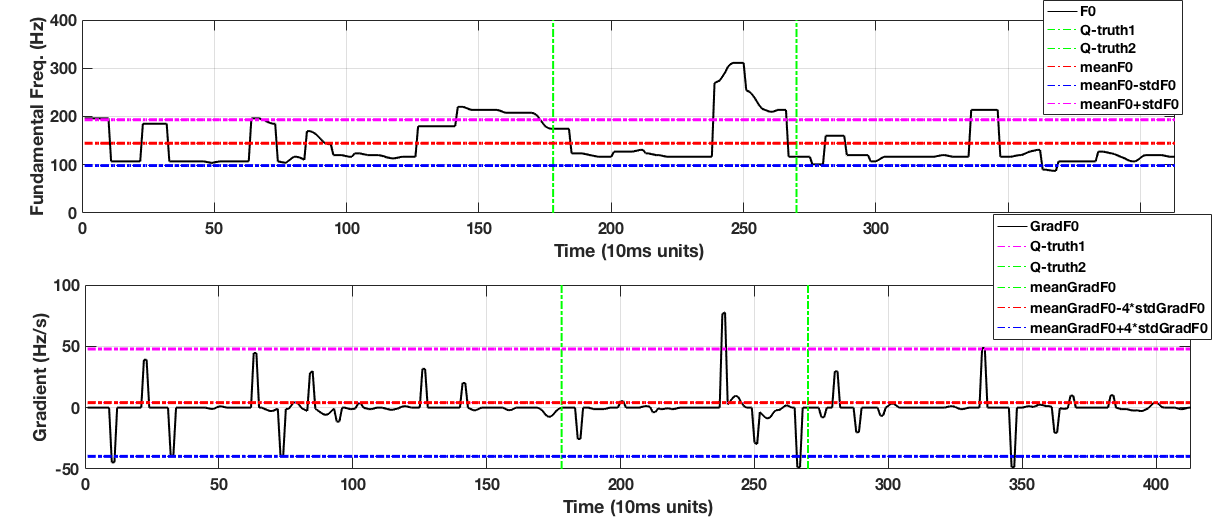
Eval-Set-5 (30 minute audio data) was used for evaluating the algorithm for question-inflection detection. The audio data was annotated for start-time and end-time of each question. The annotation was done over five minute super-segments. The time-stamps for each question-inflection were located. Gradient of the pitch contour for each speaker segment was computed to find the local maximum. Question inflection was detected when the pitch gradient goes above the value of (the mean and std are computed using gradient contour over that segment).
We annotated the start-time and end-time of the segment when question was asked. The mid-point of ground-truth question-boundary was used for computing correlation and root mean squared error with algorithm detected question-inflection point. Figure 10 shows the pitch variations on a question onset and its neighborhood. It also shows the gradient contour and detection of question-inflection.
We designed another experiment to study the pitch-based question-inflection detection. We took the evaluation audio data and estimated the pitch contour for complete signal regardless of speaker-change boundaries. We performed the mean and variance normalization of pitch contour over each two-second non-overlapping segments. Normalization compensated the long-term effects making the pitch contour robust to acoustic variability. Normalized pitch was used for detecting the question-inflection by choosing a threshold. We varied the threshold from minimum to maximum value (of pitch contour) in small steps. For each threshold values, we get miss probability, and probability of false alarm , (in %) with respect to detection of question-inflection.
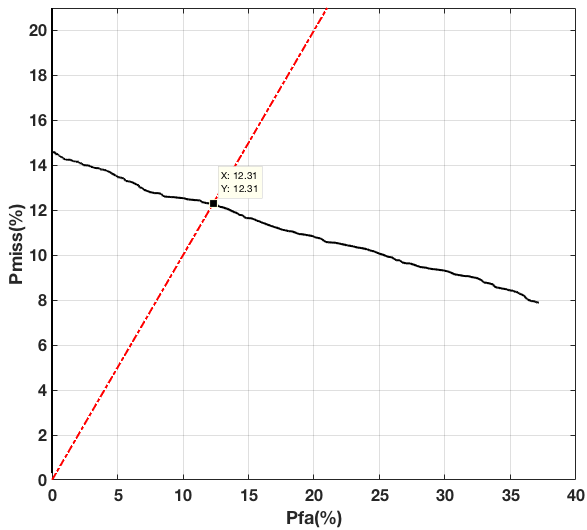
For EER calculation (DET curve), all frames belonging to the time-interval during which a question was asked, were taken as question-inflection points. This is different from root mean squared error and correlation computation where the mid-point of ground-truth question-boundary was compared with point of question-inflection detection. Figure 11 shows the detection error trade-off (DET) curve for Eval-Set-5 data. The equal error rate (EER) was 12.31%. Here, refers to the frames where we had the questions asked but the system failed to detect it (miss). refers to the frames where question-inflection was falsely detected (false alarm). In this paper, we used only single channel data for annotation and evaluation for pitch-based question-inflection detection for simplicity in evaluation.
5.4 Emphasis Detection
Detection of emphasized speech could help in discovering the "hot-spots" in PLTL sessions wherein important discussions might have happened. Such segments could help education researchers in understanding and designing the best practices. Student’s excitement could be captured by detecting such segments. Emphasized speech regions were important with respect to semantic analysis. Such segments could be further processed with natural language processing (NLP) tools. We have the option of using NLP tools on complete session, however using NLP only on few emphasized segment could reduce computations by eliminating segments that were relatively less important. We used the pitch contour and speech energy for detecting the emphasized speech. These regions identify the important regions in audio data.
The emphasis detection from audio had been studied previously Chen and Withgott [15], Arons [6, 5, 7]. Detecting the emphasized regions helped in quick summarization of spoken documents Arons [7]. Such summaries collected the salient features of the recordings and were useful for analysis of technical discussions and daily-life conversations. A HMM-based model trained on huge amount of data was used for emphasis detection in Chen and Withgott [15]. Pitch changes were leveraged for detection of emphasized regions in meetings Kennedy and Ellis [39].
However, the past works Chen and Withgott [15], Arons [6, 5, 7] had not been tested over long-duration spontaneous speech with several speakers (such as six to eight participants in PLTL session). CRSS-PLTL data had short conversational-turns at several instances in addition to noise and reverberation, thus making the task challenging. Since we estimated the pitch contour and do the analysis for each speaker segment, the pitch range of each speaker is automatically taken into account. As the pitch could change abruptly due to speaker changes (for example, from a male to female speaker), it was important to have accurate speaker segments. The proposed algorithm adapted to the pitch and energy range of a speaker (by operating over non-overlapping two-second windows), and then automatically selected the regions of increased pitch-and energy-activity as a measure of emphasis. Increase pitch and speech energy are markers of an emphasized region while pitch information was found to be more important Chen and Withgott [15].
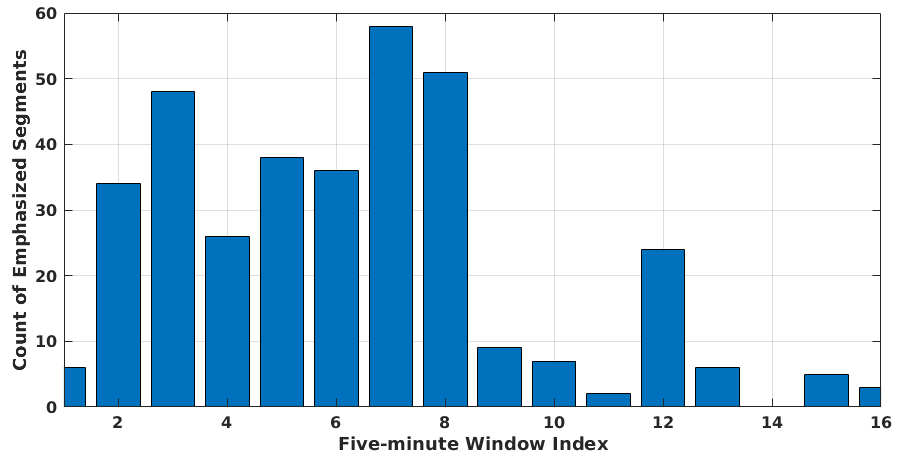
We proposed detection of emphasized speech using inflated speech energy and increased pitch. The wavelet packet decomposition was used for robust estimation of speech energy as explained in Section 3.2. The correlation and root mean squared error between ground-truth (mid-point) and estimated point of emphasis detection were used as figure of merit for this method. Figure 13 showed the distribution of emphasized regions in each five-minute segments of a PLTL session (approximately 80 minutes). We could see the highest number of emphasized speech segment lies in mid of the session. It showed that the "hot-spots" in PLTL sessions were more often during the mid-time.
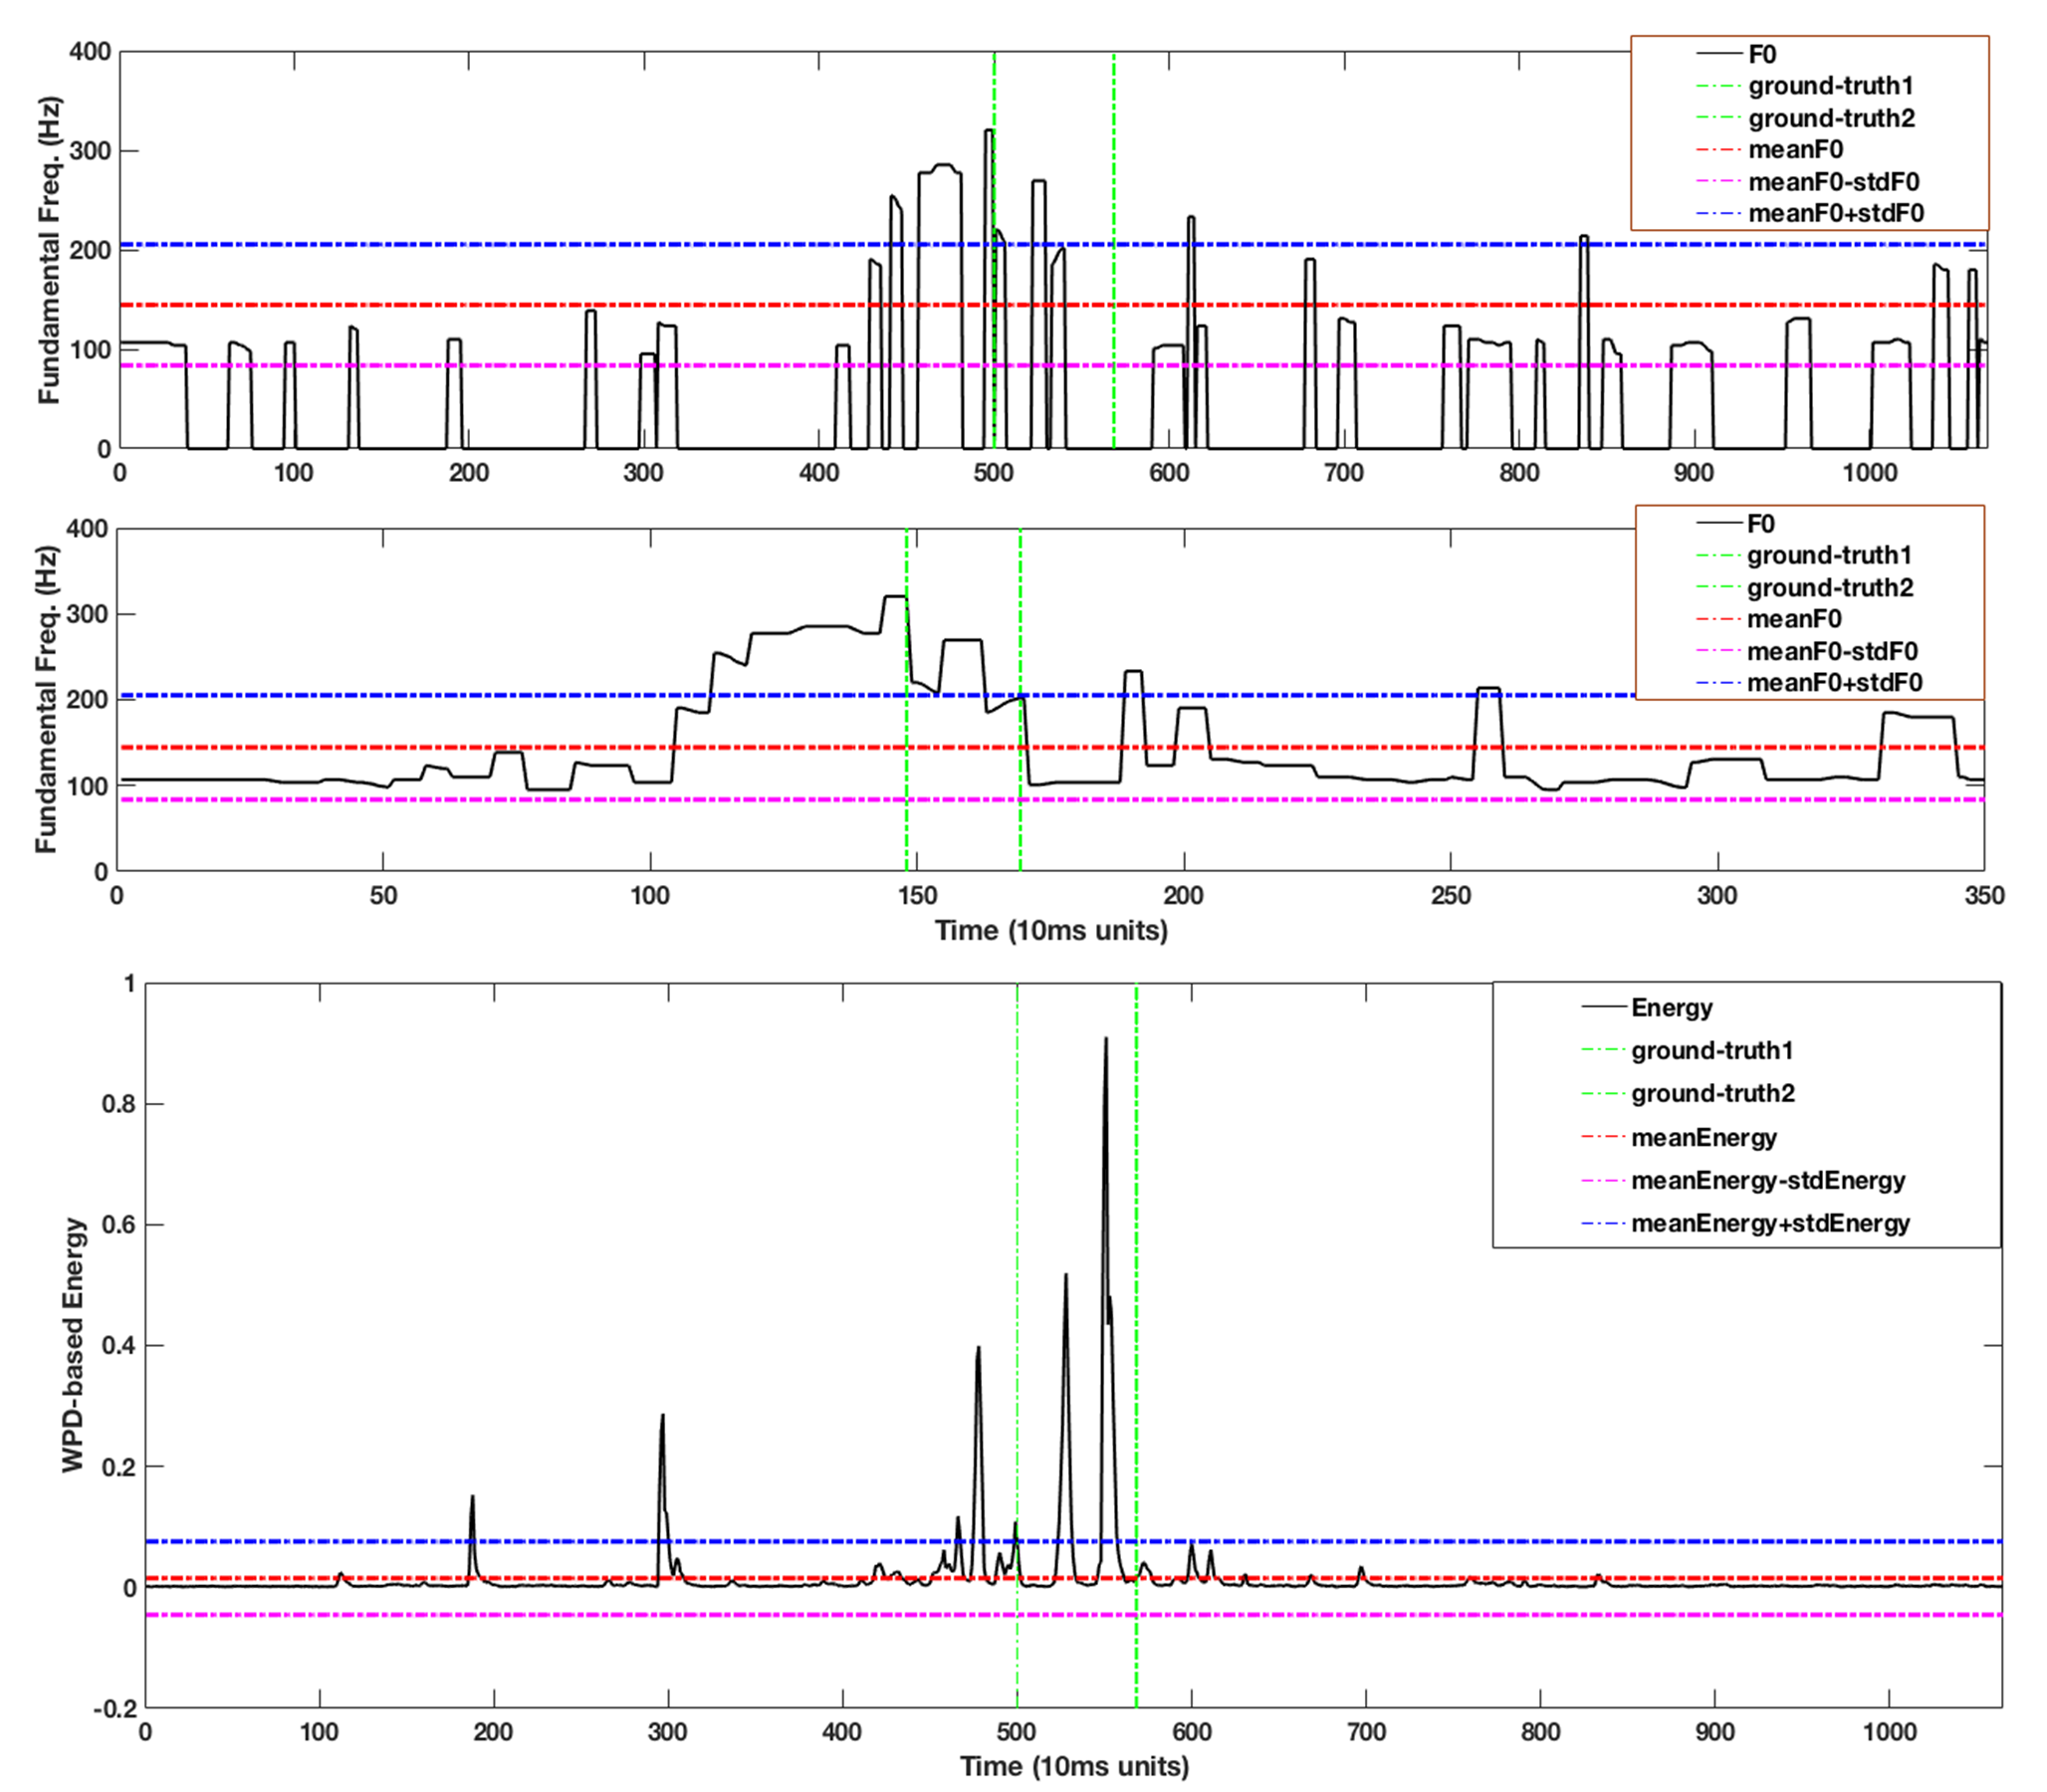
Figure 12 shows detection of emphasized segments using pitch and energy. Emphasis was detected based on two conditions: 1) energy higher than , and 2) pitch higher than . Simultaneous satisfaction of these conditions detected emphasized speech regions. We had the start-time and end-time boundaries for emphasized regions from manual annotation as described in Section 2.2. We took the mid-point of ground-truth emphasis-boundary and estimated its correlation with algorithm computed point of emphasis detection. Also, we calculated the root mean squared error (in units of second), between these two quantities, i.e., ground-truth and estimated detection point. Table 8 shows the evaluation results.
5.5 Engagement: Speech Rate
The speech rate was considered an important aspect of vocal communication Cummins [18]. Speech rate was useful for quantifying the engagement behavior. Increased speech rate showed more engagement. Authors used prosodic cues for studying engagement behaviors in children Gupta et al. [30]. Several interaction scenarios between a child and psychologist were used for validating the developed algorithms. Engagement was predicted using vocal and prosodic cues. Authors concluded that the engagement information was not only reflected in global cues but also in short-term local cues. Three levels of engagement were used for experimental validation. Fusing global and local cues gave the best results. Even though the experiments were validated in constrained settings, it showed that certain prosodic patterns captured the engagement in dyadic interactions Gupta et al. [30].
Several algorithms were developed for estimating the speech rate Morgan and Fosler-Lussier [55], Jiao et al. [38], Wang and Narayanan [80], Ziaei et al. [90]. We benchmarked the method developed in Ziaei et al. [90] on Eval-Set-6 (see Table 1) derived from the CRSS-PLTL corpus. It consisted of 70 minute audio from a PLTL session.
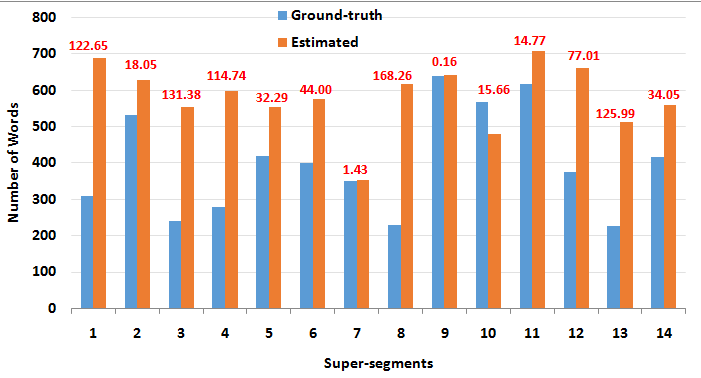
Figure 14 shows the evaluation of word count algorithm Ziaei et al. [90] on Eval-Set-6. We divided the PLTL session into five-minute segments and performed the word count estimation using method proposed in Ziaei et al. [90]. The red numbers above the bars showed the percentage error rate with respect to ground-truth word count. We could see the performance varying from very low to high error rate. The low errors occurred when speaker wore the LENA device and high error was possibly due to the speech of a distant speaker and rapid short-turns from several speakers (six to eight student were in a PLTL session). The reverberation levels were different for each unique position of speakers. Very low error in seventh and ninth segments showed that method worked well when speech quality was good and very high errors in first, third and thirteenth segment shows that method in Ziaei et al. [90] got worse when speaker changes were rapid and some of the speaker were far from the LENA device. It showed the necessity to investigate reverberation-and noise-robust methods for speech rate estimation that could work accurately for naturalistic audio streams.
| Parameter | Value |
|---|---|
| Stacked autoencoder input layer dim. | 1001 |
| Stacked autoencoder second layer dim. | 91 |
| Stacked autoencoder bottleneck layer dim. | 21 |
| Number of hidden layers 7 | 3 |
| First layer activation | tanh |
| Hidden layer activation | sigmoid |
| Initial states in HMM | 12-18 |
| Number of GMM components | 2-5 |
| Minimum duration of HMM states | 0.2s-1s |
| Splicing context (past) | 5 frames |
| Splicing context (future) | 5 frames |
| Features | MFCC |
| Window length | 25ms |
| Skip-rate | 10ms |
| Sampling rate | 8000Hz |
SAD DER(%) LIUM Meignier and Merlin [52] 4.1 35.80 NO SAD 13-MFCC (* 7= 91 from seven streams) 0.5 12 2 41.71 NO SAD 13-MFCC (* 7= 91 from seven streams) 1 12 2 33.23 NO SAD 19-autoencoder 0.5 12 2 16.64 NO SAD 19-autoencoder 1 12 2 15.83 Oracle 13-MFCC (* 7= 91 from seven streams) 1 12 2 19.98 Oracle 13-MFCC (* 7= 91 from seven streams) 0.5 12 2 18.95 Oracle 19-autoencoder 1 12 2 8.05 Oracle 19-autoencoder 0.5 12 2 8.87
6 Results & Discussions
This section discussed the results obtained on various evaluation sets derived from the CRSS-PLTL corpus. Output of the diarization system was used for getting the participation dynamics as explained in Section 5.1. Figure 8 shows the participation analysis of Eval-Set-2 (see Table 1) that consisted of 21 minutes audio data. It was observed that most of the student could speak for comparable time-duration. The team leader occupied the conversation floor for most of the time as peer leader had to facilitate the collaborative problem solving.
| System | System | Pmiss | Pfa |
|---|---|---|---|
| (A) | DNN-based pitch | 16.54 | 28.45 |
| (B) | TO-combo-SAD Ziaei et al. [88] | 15.68 | 42.64 |
| (C) | Fusion of (A) + (B) | 16.00 | 16.64 |
| (D) | USC-supervised-NN Van Segbroeck et al. [74] | 14.68 | 31.70 |
Quantity Correlation root mean squared error(s) EER (%) Question Inflection 0.84 0.51s 12.31 Emphasis 0.78 0.42s –
Table 7 shows the evaluation results on Eval-Set-7 data using methods described in Section 3.1. Figure 4 showed the duration-distribution of speech, non-speech and overlapped-speech segments. Non-speech often contained several noise sources such as mumbling of far speaker, writing-on-white-board noise in addition to noise from fan and other background sources. We used DNN-based pitch extractor (see Section 3.3) for SAD. The frames that were assigned zero(0) pitch were declared non-speech. TO-combo-SAD Ziaei et al. [88] was second SAD system used. Later, we fused the output of both systems. For frames where both system’s output were not same, we consider those frames as non-speech. Consequently, false alarm was greatly reduced. The non-speech in evaluation set had multiple simultaneous sources that resulted in high false alarm for each SAD system. Further, we compared the proposed SAD system a state-of-the art SAD that consists of a neural network trained on multiple feature streams Van Segbroeck et al. [74]. This system was developed at USC for DARPA RATS data. We can see from Table 7 that proposed SAD is competitive with respect to lower false alarm rate and lower miss rate unlike USC-supervised-NN method that had significant false alarm.
The parameters of proposed diarization system was shown in Table 5. The results of diarization system were given in Table 6. It is important to note that MFCC features from all the seven streams were used in HMM-based diarization for comparing its performance with bottleneck features. We could see that bottleneck feature captured useful statistics of multi-stream audio data that resulted in better accuracy using informed HMM-based diarization system.
We extracted 13-dimensional MFCC features from each of the seven streams of the PLTL session. After concatenating the features from each stream we get a feature super-vector of dimensions 91 (=13*7). After splicing the feature super-vectors with five past and future frames (see Figure 7), we get the final dimension of features as 1001 (=11*91). Spliced feature super-vector was fed to a stacked autoencoder for extracting the bottleneck features of dimension 21. Stacked autoencoder with three hidden layers was chosen where the middle hidden layer acted as bottleneck layer. The bottleneck features were fed to the informed HMM-based diarization system. We used the Oracle SAD in the proposed system to validate the accuracy of HMM-based joint segmentation and clustering. However, we performed another case-study by formulating non-speech as an additional HMM state. We compared the diarization accuracy of bottleneck features (derived from raw MFCC features form each of the seven steams) and raw acoustic features (13-MFCC from each of the seven streams). Thus, the concatenation of MFCC features from multi-stream was done in both cases ensuring that it was a fair comparison between two approaches (raw features and bottleneck).
Table 6 showed the diarization accuracy in various cases. The "NO SAD" case refers to not using any SAD labels and modeling non-speech as an additional HMM state. We knew that the non-speech has several distinct varieties, such as silences (with extreme noise of varied types), overlapped speech etc.. This made the diarization, a challenging task without SAD labels. It led to degradation in diarization accuracy (see Table 6). We could see that the bottleneck features combined with HMM was robust with respect to change in minimum duration constraints and to some extent is robust to absence of SAD labels. The state-of-the-art LIUM baseline Meignier and Merlin [52] was borrowed from our earlier work for comparison Dubey et al. [20]. We could see an absolute improvement of approximately 27% in terms of DER over the baseline LIUM system and approximately 12% improvement was due to bottleneck features instead of using raw MFCC features (Oracle SAD, one second time-constraint).
Since the proposed dominance score, (see Section 5.2) was derived using unsupervised acoustic analysis, we used Pearson’s correlation between ground-truth dominance rating () and proposed dominance score (). The correlation between ground-truth and proposed was 0.8748 for Eval-Set-3 (70 minutes). The high correlation value validates the efficacy of proposed dominance score, , for characterizing dominance in PLTL sessions.
We computed pitch contour for each 25ms frame with 10ms skip-rate. For each speaker segment, we incorporated two-second of past and future speech and did the processing using non-overlapping super-segments of two-second duration. The pitch contour of each speaker segment was processed separately for possibility of detecting emphasis or question-inflection. We computed the speech energy based on wavelet packet decomposition as discussed in section 3.2. We computed the correlation between ground-truth mid-point and algorithm detection point as figure of merit for both emphasis and question-inflection detection. We also computed root mean squared error using ground-truth mid-point and detected points. Thus, we have two figures of merits namely correlation and root mean squared error for both, question-inflection and emphasis detection.
Table 8 showed the results on respective evaluation set. In addition, we did the detection error trade-off (DET) analysis for question-inflection as depicted in Figure 11. For getting DET curve we did not use the oracle diarization. We estimated the pitch contour for complete signal and performed the mean and variance normalization over non-overlapping super-segments of duration two-seconds. Thus, the newly generated normalized pitch contour was used for detecting the question-inflection by choosing a threshold. The values that were higher than the threshold corresponds to question-inflection. All frames between start-time and end-time of ground-truth question boundary were used as question-inflection points for the DET analysis. For each of the chosen threshold, we get a probability of false detection, and probability of missing a true question-inflection, . Figure 11 shows the detection error trade-off (DET) curve and the equal error rate (EER), where . The EER value comes out to be 12.31%. The DET and EER analysis supported the hypothesis that pitch was a robust feature for detecting the question-inflection. Table 8 shows the results on evaluation datasets.
7 Conclusions
This paper is a first step towards leveraging speech technology for extracting behavioral characteristics in small-group conversations such as PLTL sessions. Proposed methods were evaluated on CRSS-PLTL corpus. However, these algorithms can be extended to other similar applications such as small-group meetings/conversations.
We established the CRSS-PLTL corpus that contains audio recording of five Peer-Led Team Learning (PLTL) team. Each team has six to eight students and a peer leader. This corpus provides an opportunity for researching speaker diarization and behavioral signal processing for multi-stream data collected in naturalistic scenarios.
We used robust front-end for speech activity detection (SAD) and speaker diarization. Speech segments from all speaker were later processed with behavioral speech processing block that incorporate several acoustic analyses. Speech algorithms extract features capturing the behavioral characteristics such as participation, dominance, emphasis, curiosity and engagement. Results obtained on CRSS-PLTL corpus using proposed techniques are encouraging and motivate use of behavioral speech processing for understanding practical problems in education, human-to-human communication and small-group conversations.
Acknowledgments
Authors would like to thank anonymous reviewers and editors for helpful comments and suggestions that helped in improving the quality of this paper.
Authors would like to thank Professor Shrikanth S. Narayanan, Maarten Van Segbroeck, and Andreas Tsiartas from University of Southern California, USA for providing the software of supervised Neural Network speech activity detection developed for DARPA RATS data.
We would like to thank Ali Ziaei (PullString Inc.), Lakshmish Kaushik and other CRSS colleagues for helpful suggestions and discussions.
This project was funded in part by AFRL under contract FA8750-15-1-0205 and partially by the University of Texas at Dallas from the Distinguished University Chair in Telecommunications Engineering held by J. H. L. Hansen.
References
References
- [1] Ajmera, J., Bourlard, H., Lapidot, I.. Improved unknown-multiple speaker clustering using HMM. Technical Report; IDIAP, year = 2002,.
- Ajmera et al. [2004] Ajmera, J., McCowan, I., Bourlard, H.. Robust speaker change detection. IEEE Signal Processing Letters 2004;11(8):649–651.
- Anguera et al. [2012] Anguera, X., Bozonnet, S., Evans, N., Fredouille, C., Friedland, G., Vinyals, O.. Speaker diarization: A review of recent research. IEEE Trans on Audio, Speech, and Language Processing 2012;20(2):356–370.
- Aran and Gatica-Perez [2013] Aran, O., Gatica-Perez, D.. One of a kind: inferring personality impressions in meetings. In: Proceedings of the ACM International Conference on Multimodal Interaction. 2013. p. 11–18.
- [5] Arons, B.. Techniques, perception, and applications of time-compressed speech. In: Proceedings of 1992 Conference. .
- Arons [1994] Arons, B.. Pitch-based emphasis detection for segmenting speech recordings. In: ICSLP. 1994. .
- Arons [1997] Arons, B.. Speechskimmer: a system for interactively skimming recorded speech. ACM Trans on Computer-Human Interaction 1997;4(1):3–38.
- Barua [2013] Barua, A.. Methods for decision-making in survey questionnaires based on likert scale. Journal of Asian Scientific Research 2013;3(1):35.
- [9] Basalto, N., Bellotti, R., De Carlo, F., Facchi, P., Pantaleo, E., Pascazio, S.. Hausdorff clustering. Phys Rev E ;78:046112.
- Basu et al. [2001] Basu, S., Choudhury, T., Clarkson, B., Pentland, A., et al. Learning human interactions with the influence model. Conference on Neural Information Processing Systems (NIPS); 2001. .
- Bengio et al. [2007] Bengio, Y., Lamblin, P., Popovici, D., Larochelle, H., et al. Greedy layer-wise training of deep networks. Advances in neural information processing systems 2007;19:153.
- Boud et al. [1999] Boud, D., Cohen, R., Sampson, J.. Peer learning and assessment. Assessment & Evaluation in Higher Education 1999;24(4):413–426.
- Camacho and Harris [2008] Camacho, A., Harris, J.G.. A sawtooth waveform inspired pitch estimator for speech and music. The Journal of the Acoustical Society of America 2008;124(3):1638–1652.
- Carlson et al. [2016] Carlson, K., Turvold, C.D., Curran, E., Marcus, M., Loe, M.. Assessing the impact of a multi-disciplinary peer-led-team learning program on undergraduate STEM education. Journal of University Teaching & Learning Practice 2016;13(1):5.
- Chen and Withgott [1992] Chen, F.R., Withgott, M.. The use of emphasis to automatically summarize a spoken discourse. In: IEEE International Conference on Acoustics, Speech and Signal Processing (ICASSP). 1992. p. 229–232.
- Cota et al. [1995] Cota A. A.and Evans, C.R., Dion, K.L., Kilik, L., Longman, R.S.. The structure of group cohesion. Personality and Social Psychology Bulletin 1995;21:572–572.
- Cracolice and Deming [2001] Cracolice, M.S., Deming, J.C.. Peer-led team learning. The Science Teacher 2001;68(1):20.
- Cummins [2009] Cummins, F.. Rhythm as entrainment: The case of synchronous speech. Journal of Phonetics 2009;37(1):16–28.
- De Cheveigne and Kawahara [2002] De Cheveigne, A., Kawahara, H.. YIN, a fundamental frequency estimator for speech and music. The Journal of the Acoustical Society of America 2002;111(4):1917–1930.
- Dubey et al. [2016a] Dubey, H., Kaushik, L., Sangwan, A., Hansen, J.H.L.. A speaker diarization system for studying peer-led team learning groups. In: ISCA INTERSPEECH. 2016a. p. 2180–2184.
- Dubey et al. [2016b] Dubey, H., Sangwan, A., Hansen, J.H.L.. A robust diarization system for measuring dominance in peer-led team learning groups. In: IEEE Spoken Language Technology Workshop (SLT). 2016b. p. 319–323. doi:10.1109/SLT.2016.7846283.
- Dunbar and Burgoon [2005] Dunbar, N.E., Burgoon, J.K.. Perceptions of power and interactional dominance in interpersonal relationships. Journal of Social and Personal Relationships 2005;22(2):207–233.
- Ellyson and Dovidio [1985] Ellyson, S.L., Dovidio, J.F.. Power, dominance, and nonverbal behavior: Basic concepts and issues. Springer, 1985.
- Fredouille and Senay [2006] Fredouille, C., Senay, G.. Technical improvements of the e-hmm based speaker diarization system for meeting records. In: MLMI. Springer; volume 4299; 2006. p. 359–370.
- Gallardo-Antolın et al. [2006] Gallardo-Antolın, A., Anguera, X., Wooters, C.. Multi-stream speaker diarization systems for the meetings domain. In: Proc. Int’l Conf. Spoken Language Processing (ICSLP). 2006. p. 2186–2189.
- Galliano et al. [2009] Galliano, S., Gravier, G., Chaubard, L.. The ester 2 evaluation campaign for the rich transcription of french radio broadcasts. In: ISCA INTERSPEECH. 2009. p. 2583–2586.
- Gehring et al. [2013] Gehring, J., Miao, Y., Metze, F., Waibel, A.. Extracting deep bottleneck features using stacked auto-encoders. In: IEEE International Conference on Acoustics, Speech and Signal Processing (ICASSP). 2013. p. 3377–3381.
- Ghaemmaghami et al. [2015] Ghaemmaghami, H., Dean, D., Sridharan, S.. A cluster-voting approach for speaker diarization and linking of australian broadcast news recordings. In: IEEE International Conference on Acoustics, Speech and Signal Processing (ICASSP). 2015. p. 4829–4833. doi:10.1109/ICASSP.2015.7178888.
- Gonzalez and Brookes [2014] Gonzalez, S., Brookes, M.. PEFAC-a pitch estimation algorithm robust to high levels of noise. IEEE Trans on Audio, Speech, and Language Processing 2014;22(2):518–530.
- Gupta et al. [2016] Gupta, R., Bone, D., Lee, S., Narayanan, S.. Analysis of engagement behavior in children during dyadic interactions using prosodic cues. Computer Speech & Language 2016;37:47–66.
- Han and Wang [2014] Han, K., Wang, D.. Neural network based pitch tracking in very noisy speech. IEEE Trans on Audio, Speech, and Language Processing 2014;22(12):2158–2168.
- Hinton and Salakhutdinov [2006] Hinton, G.E., Salakhutdinov, R.R.. Reducing the dimensionality of data with neural networks. Science 2006;313(5786):504–507.
- Huang and Hansen [2006] Huang, R., Hansen, J.H.L.. Advances in unsupervised audio classification and segmentation for the broadcast news and NGSW corpora. IEEE Trans on Audio, Speech, and Language Processing 2006;14(3):907–919.
- Hung et al. [2008] Hung, H., Huang, Y., Friedland, G., Gatica-Perez, D.. Estimating the dominant person in multi-party conversations using speaker diarization strategies. In: IEEE International Conference on Acoustics, Speech and Signal Processing (ICASSP). 2008. p. 2197–2200.
- Hung et al. [2007] Hung, H., Jayagopi, D.B., Yeo, C., Friedland, G., Ba, S.O., Odobez, J., Ramchandran, K., Mirghafori, N., Gatica-Perez, D.. Using audio and video features to classify the most dominant person in a group meeting. Number LIDIAP-CONF-2007-016; 2007. .
- Huttenlocher et al. [1993] Huttenlocher, D.P., Klanderman, G.A., Rucklidge, W.J.. Comparing images using the hausdorff distance. IEEE Trans on Pattern Analysis and Machine Intelligence 1993;15(9):850–863.
- Jayagopi et al. [2009] Jayagopi, D.B., Hung, H., Yeo, C., Gatica-Perez, D.. Modeling dominance in group conversations using nonverbal activity cues. IEEE Trans on Audio, Speech, and Language Processing 2009;17(3):501–513.
- Jiao et al. [2015] Jiao, Y., Berisha, V., Tu, M., T. Huston, T., Liss, J.. Estimating speaking rate in spontaneous discourse. In: 49th Asilomar Conference on Signals, Systems and Computers. 2015. p. 1189–1192.
- Kennedy and Ellis [2003] Kennedy, L.S., Ellis, D.P.W.. Pitch-based emphasis detection for characterization of meeting recordings. In: IEEE Workshop on Automatic Speech Recognition and Understanding (ASRU). 2003. p. 243–248.
- Kim and Stern [2008] Kim, C., Stern, R.M.. Robust signal-to-noise ratio estimation based on waveform amplitude distribution analysis. In: ISCA INTERSPEECH. 2008. p. 2598–2601.
- Kling and Salomone [2015] Kling, T.P., Salomone, M.. Creating a peer-led cooperative learning program to improve STEM retention. Change: The Magazine of Higher Learning 2015;47(6):42–50.
- Kotti et al. [2008] Kotti, M., Moschou, V., Kotropoulos, C.. Speaker segmentation and clustering. Signal processing 2008;88(5):1091–1124.
- [43] Landrum, A.R., Hilgard, J., Akin, H., Li, N., Kahan, D.M.. Measuring interest in science: The science curiosity scale ;.
- Larrue and Trognon [1993] Larrue, J., Trognon, A.. Organization of turn-taking and mechanisms for turn-taking repairs in a chaired meeting. Journal of Pragmatics 1993;19(2):177–196.
- Lee and Ellis [2012] Lee, B.S., Ellis, D.P.W.. Noise robust pitch tracking by subband autocorrelation classification. In: ISCA INTERSPEECH. 2012. p. 707–710.
- Lerch [2012] Lerch, A.. An introduction to audio content analysis: Applications in signal processing and music informatics, 2012.
- Lyle and Robinson [2003] Lyle, K.S., Robinson, W.R.. A statistical evaluation: Peer-led team learning in an organic chemistry course. Journal of Chemical Education 2003;80(2):132.
- Madikeri and Bourlard [2015] Madikeri, S., Bourlard, H.. KL-HMM based speaker diarization system for meetings. In: IEEE International Conference on Acoustics, Speech and Signal Processing (ICASSP)). 2015. p. 4435–4439.
- Mast [2002] Mast, M.S.. Dominance as expressed and inferred through speaking time. Human Communication Research 2002;28(3):420–450.
- Matell and Jacoby [1971] Matell, M.S., Jacoby, J.. Is there an optimal number of alternatives for likert scale items? study. Educational and psychological measurement 1971;31:657–674.
- McCowan et al. [2005] McCowan, L., Gatica-Perez, D., Bengio, S., Lathoud, G., Barnard, M., Zhang, D.. Automatic analysis of multimodal group actions in meetings. IEEE Trans on Pattern Analysis and Machine Intelligence 2005;27(3):305–317.
- Meignier and Merlin [2010] Meignier, S., Merlin, T.. LIUM SpkDiarization: an open source toolkit for diarization. In: CMU SPUD Workshop. 2010. .
- Miao [2016] Miao, Y.. PDNN: a python toolkit for deep learning. URL https://wwwcscmuedu/ ymiao/pdnntkhtml 2016;.
- Miro et al. [2012] Miro, X.A., Bozonnet, S., Evans, N., Fredouille, C., Friedland, G., Vinyals, O.. Speaker diarization: A review of recent research. IEEE Trans on Audio, Speech, and Language Processing 2012;20(2):356–370.
- Morgan and Fosler-Lussier [1998] Morgan, N., Fosler-Lussier, E.. Combining multiple estimators of speaking rate. In: IEEE International Conference on Acoustics, Speech and Signal Processing (ICASSP). 1998. p. 729–732.
- Mottley and Roth [2013] Mottley, J.G., Roth, V.. Peer-led team learning: Adjunct to lectures in an electrical engineering course for non-majors. In: IEEE Frontiers in Education Conference. 2013. .
- Nagy and Nemeth [2016] Nagy, P., Nemeth, G.. Improving HMM speech synthesis of interrogative sentences by pitch track transformations. Speech Communication 2016;82:97–112.
- Narayanan and Georgiou [2013] Narayanan, S., Georgiou, P.G.. Behavioral signal processing: Deriving human behavioral informatics from speech and language. Proceedings of the IEEE 2013;101(5):1203–1233.
- Ning et al. [2006] Ning, H., Liu, M., Tang, H., Huang, T.S.. A spectral clustering approach to speaker diarization. In: ISCA INTERSPEECH. 2006. p. 2178–2181.
- [60] NIST, . NIST-STNR, speech signal to noise ratio howpublished = "https://www.nist.gov/information-technology-laboratory/iad/mig/nist-speech-signal-noise-ratio-measurements", year = 2016, ".
- NIST [2004] NIST, . Rich transcription spring meeting recognition evaluation plan. http://www.nist.gov/speech/; 2004.
- Pikrakis [2014] Pikrakis, A.. Unsupervised audio segmentation based on restricted boltzmann machines. In: IEEE International Conference on Information, Intelligence, Systems and Applications. 2014. p. 311–314.
- Renner [2006] Renner, B.. Curiosity about people: The development of a social curiosity measure in adults. Journal of personality assessment 2006;87(3):305–316.
- Rienks et al. [2006] Rienks, R., Zhang, D., Gatica-Perez, D., Post, W.. Detection and application of influence rankings in small group meetings. In: ACM International Conference on Multimodal Interfaces. 2006. p. 257–264.
- Roh et al. [2016] Roh, Y.S., Kelly, M., Ha, E.H.. Comparison of instructor-led versus peer-led debriefing in nursing students. Nursing & health sciences 2016;.
- Sadjadi and Hansen [2013] Sadjadi, S.O., Hansen, J.H.L.. Unsupervised speech activity detection using voicing measures and perceptual spectral flux. IEEE Signal Processing Letters 2013;20(3):197–200.
- Sangwan et al. [2015] Sangwan, A., Hansen, J.H.L., Irvin, D.W., Crutchfield, S., Greenwood, C.R.. Studying the relationship between physical and language environments of children: Who’s speaking to whom and where? In: IEEE Signal Proc. Education Workshop 2015, Salt Lake City, Utah. 2015. p. 49–54.
- Schafer [2011] Schafer, R.W.. What is a savitzky-golay filter? IEEE Signal Processing Magazine 2011;28(4):111–117.
- Shum et al. [2013] Shum, S.H., Dehak, N., Dehak, R., Glass, J.R.. Unsupervised methods for speaker diarization: An integrated and iterative approach. IEEE Trans on Audio, Speech, and Language Processing 2013;21(10):2015–2028.
- Snyder et al. [2016] Snyder, J.J., Sloane, J.D., Dunk, R.D., Wiles, J.R.. Peer-led team learning helps minority students succeed. PLoS Biol 2016;14(3):e1002398.
- Snyder and Wiles [2015] Snyder, J.J., Wiles, J.R.. Peer led team learning in introductory biology: Effects on peer leader critical thinking skills. PloS one 2015;10(1):e0115084.
- Taha and Hanbury [2015] Taha, A.A., Hanbury, A.. An efficient algorithm for calculating the exact hausdorff distance. IEEE Trans on Pattern Analysis and Machine Intelligence 2015;37(11):2153–2163.
- Tranter et al. [2006] Tranter, S.E., Reynolds, D., et al. An overview of automatic speaker diarization systems. IEEE Trans on Audio, Speech, and Language Processing 2006;14(5):1557–1565.
- Van Segbroeck et al. [2013] Van Segbroeck, M., Tsiartas, A., Narayanan, S.. A robust frontend for vad: exploiting contextual, discriminative and spectral cues of human voice. In: ISCA INTERSPEECH. 2013. p. 704–708.
- Vijayasenan and Valente [2012] Vijayasenan, D., Valente, F.. DiarTk: an open source toolkit for research in multistream speaker diarization and its application to meetings recordings. In: ISCA INTERSPEECH. 2012. p. 2170–2173.
- [76] Vijayasenan, D., Valente, F., H. Bourlard title = Multistream speaker diarization of meetings recordings beyond MFCC and TDOA features, j..S.y…v…n…p…p..E. ;.
- Vincent et al. [2008] Vincent, P., Larochelle, H., Bengio, Y., Manzagol, P.. Extracting and composing robust features with denoising autoencoders. In: ACM International Conference on Machine Learning. 2008. p. 1096–1103.
- Vincent et al. [2010] Vincent, P., Larochelle, H., Lajoie, I., Bengio, Y., Manzagol, P.. Stacked denoising autoencoders: Learning useful representations in a deep network with a local denoising criterion. Journal of Machine Learning Research 2010;11(Dec):3371–3408.
- Wamser [2006] Wamser, C.C.. Peer-led team learning in organic chemistry: Effects on student performance, success, and persistence in the course. J Chem Educ 2006;83(10):1562.
- Wang and Narayanan [2007] Wang, D., Narayanan, S.S.. Robust speech rate estimation for spontaneous speech. IEEE Trans on Audio, Speech, and Language Processing 2007;15(8):2190–2201.
- Wang et al. [2016] Wang, Y., Yao, H., Zhao, S.. Auto-encoder based dimensionality reduction. Neurocomputing 2016;184:232–242.
- Wickerhauser [1991] Wickerhauser, M.V.. Lectures on wavelet packet algorithms. In: Lecture notes, INRIA. 1991. .
- Wu and Miao [2013] Wu, Q., Miao, C.. Curiosity: From psychology to computation. ACM Computing Surveys 2013;46(2):18.
- Xu et al. [2008] Xu, D., Yapanel, U.H., Gray, S.S., Gilkerson, J., Richards, J.A., Hansen, J.H.L.. Signal processing for young child speech language development. In: Workshop on Child, Computer and Interaction (WOCCI). 2008. p. 20–24.
- Yella and Stolcke [2015] Yella, S.H., Stolcke, A.. A comparison of neural network feature transforms for speaker diarization. In: ISCA INTERSPEECH. 2015. p. 3026–3030.
- Young [2016] Young, K.. Handbook of social psychology. Routledge, 2016.
- Zhou and Hansen [2005] Zhou, B., Hansen, J.H.L.. Efficient audio stream segmentation via the combined t2 statistic and bayesian information criterion. IEEE Trans on Audio, Speech, and Language Processing 2005;13(4):467–474.
- Ziaei et al. [2014] Ziaei, A., Kaushik, L., Sangwan, A., Hansen, J.H.L., Oard, D.W.. Speech activity detection for NASA apollo space missions: challenges and solutions. In: ISCA INTERSPEECH. 2014. p. 1544–1548.
- Ziaei et al. [2013] Ziaei, A., Sangwan, A., Hansen, J.H.L.. Prof-Life-Log: personal interaction analysis for naturalistic audio streams. In: IEEE International Conference on Acoustics, Speech and Signal Processing (ICASSP). 2013. p. 7770–7774.
- Ziaei et al. [2016] Ziaei, A., Sangwan, A., Hansen, J.H.L.. Effective word count estimation for long duration daily naturalistic audio recordings. Speech Communication 2016;84:15–23.
- Ziaei et al. [2015] Ziaei, A., Sangwan, A., Kaushik, L., Hansen, J.H.L.. Prof-life-log: analysis and classification of activities in daily audio streams. In: IEEE International Conference on Acoustics, Speech and Signal Processing (ICASSP). 2015. p. 4719–4723. doi:10.1109/ICASSP.2015.7178866.