Be discs in coplanar circular binaries:
Phase-locked variations of emission lines
Abstract
The first results of radiative transfer calculations on decretion discs of binary Be stars are presented. A smoothed particle hydrodynamics code computes the structure of Be discs in coplanar circular binary systems for a range of orbital and disc parameters. The resulting disc configuration consists of two spiral arms, and can be given as input into a Monte Carlo code, which calculates the radiative transfer along the line of sight for various observational coordinates. Making use of the property of steady disc structure in coplanar circular binaries, observables are computed as functions of the orbital phase. Orbital-phase series of line profiles are given for selected parameter sets under various viewing angles, to allow comparison with observations. Flat-topped profiles with and without superimposed multiple structures are reproduced, showing, for example, that triple-peaked profiles do not have to be necessarily associated with warped discs and misaligned binaries. It is demonstrated that binary tidal effects give rise to phase-locked variability of the violet-to-red (V/R) ratio of hydrogen emission lines. The V/R ratio exhibits two maxima per cycle; in certain cases those maxima are equal, leading to a clear new V/R cycle every half orbital period. This study opens a way in identifying binaries and in constraining the parameters of binary systems that exhibit phase-locked variations induced by tidal interaction with a companion star.
keywords:
hydrodynamics – stars: binaries – stars: circumstellar matter – stars: emission line, Be – radiative transfer – stars: mass loss1 Introduction
The axisymmetry of an ionized keplerian disk manifests itself in time-invariant emission lines with a characteristic double-peak structure. The gravitational field of a companion star is a possible perturber of such symmetry. It would reveal itself by cyclic perturbations of the violet-to-red flux ratio (V/R) of the two emission components. Therefore, observations of these so-called V/R variations carry information about potential binarity, the parameters of the companion, and the dynamics and radiative properties of the disc.
Binarity is certainly not a necessity for the production of V/R variations in Be stars, but only an addition to other variability sources (Rivinius et al., 2006). Be discs in binary systems have been suspected to exhibit tidally-induced phase-locked variations. Křiž & Harmanec (1975) first studied the binary effect theoretically and in a systematic way, demonstrating that the observational characteristics of Be stars can be a consequence of their binary nature. Contrary to earlier beliefs (Baade, 1992), recent observational studies of various binaries reveal variability of different spectroscopic quantities, with a periodicity consistent with the orbital period. A thorough study of V/R variations in a number of Be binaries and their relation to the orbital period was given by Štefl et al. (2007), indicating Cap as a prototype of phase-locked V/R variations. Saad et al. (2005) suggest that Dra is a circular binary with and emission locked to the orbital period. Kubát & Saad (2008) also report that Dra and 4 Her exhibit V/R variations synchronised with their orbital periods.
Panoglou et al. (2016, hereafter Paper I) studied the Be disc structure in coplanar binary systems (i.e. in which the disc plane coincides with the orbital plane). A large parameter space was covered, exploring the effects of viscosity, binary mass ratio, orbital period and eccentricity. The disc is an outward double-armed spiralling flow of gas (Okazaki et al., 2002). The azimuthally averaged truncation radius (i.e. the disc size) increases for higher viscosities, higher orbital periods and lower mass ratios, while due to the accumulation of mass in the region inside the truncation radius, the decline in disc density is shallower than for isolated stars.
Paper I also showed that the structure of the disc of Be stars in coplanar binary systems depends on the orbital phase: Eccentric and/or misaligned (in which there is a tilt between the disc and the orbital plane) binaries are phase-dependent because the structure and the dynamics of the disc depend on the position of the companion in its orbit. In highly eccentric binaries, the disc is almost completely dissolved at the periastron passage (see Reig et al. 1997). In a circular binary with a disc in its asymptotic state, the disk configuration does not change with time, but the way it presents itself to the observer does evolve periodically due to the spiral arms. The aim of this paper is to demonstrate that spectroscopic variations of Be stars can be attributed to this phase-dependent disc structure.
The outline of this paper is as follows: First (§2), the basic properties of coplanar circular binaries are confirmed, by examination of the azimuthal density structure for systems of various parameters. Next, the first results of radiative transfer calculations for different parameter sets are presented (§3). Discussion of certain features that were obtained through the simulations, along with some limited comparison to observed stars, is given in §4. In §5, the conclusions are summarised and a basic framework of the variability scheme in Be stars is presented.
2 Corotating structure at steady state
The effect of the tidal interaction between the two components of a binary system is the truncation of the disc. Okazaki et al. (2002) showed that truncation does not mean that the disc is really broken at some distance smaller than the orbital separation (see also Reig et al. 1997). Rather, beyond the truncation point the density drops much more rapidly with increasing distance from the primary Be star, i.e. after the truncation point the disc becomes immensely more tenuous. Under these considerations, it is possible to define the truncation radius (which quantifies the effective disc extent), the inner-disc surface-density drop-off exponent , and the outer-disc density drop-off exponent ().
The gravitational interaction with the companion causes a two-armed spiral wave that breaks the circular symmetry of the disc and makes it time-dependent (Huang, 1972). In Paper I it was shown that when the decretion disc of a binary Be star evolves long enough, it reaches a quasi-steady state (QS) regime, after which the disc structure no longer exhibits cycle-to-cycle variations. Its time dependence can be substituted with a simple orbital phase dependence. The surface density can be given as a function of position and time , , where is the time needed for the system to reach QS, and:
| (1) |
where is the radial distance from the central star, is the azimuthal coordinate, is the orbital phase, is the truncation radius, and are the inner and outer disc exponents, respectively, and is a parameter related to the base density. The quantities are numerically fitted for each azimuthal angle , and are phase-dependent. Eq. (1) was originally introduced by Okazaki et al. (2002, their Eq. 14) for the azimuthally-averaged surface density of the disc. In the above form, the exponent is slightly redefined so that it really translates to the slope in the outer region of the disc, and the parameters are given as functions of and .
In Paper I the simulated surface density was fitted to Eq. (1) for each azimuthal direction , reaching the conclusion that in coplanar circular binaries the disc structure does not change in shape with time, but only rotates in phase with the secondary. Mathematically, the azimuthal rotation of the disc structure per orbital cycle can be expressed as
| (2) |
| (a) SPH input | (b) SPH output | ||||||||||||
| ID | |||||||||||||
| # | (d) | () | () | (d) | () | () | ( cm-3) | () | (/yr) | ||||
| 42 | 30 | 17.0 | 0.08 | 0.1 | 400 | 3.271 | 0.048 | 93 | 84 | 39412 | 9.108 | 12.920 | 1.00 |
| 31 | 30 | 17.0 | 0.08 | 0.4 | 2000 | 0.654 | 0.048 | 51 | 42 | 46158 | 7.294 | 3.029 | 0.14 |
| 37 | 30 | 17.0 | 0.08 | 1.0 | 4000 | 0.327 | 0.048 | 25 | 21 | 41089 | 6.738 | 1.344 | 0.07 |
| 66 | 10 | 8.2 | 0.08 | 0.4 | 800 | 0.545 | 0.016 | 69 | 64 | 39330 | 7.960 | 2.144 | 0.31 |
| 36 | 30 | 20.8 | 1.00 | 0.4 | 2000 | 0.654 | 0.048 | 67 | 28 | 46700 | 7.587 | 3.071 | 0.54 |
In this work the fitting procedure followed in Paper I was improved by adding radial power-law weights of the form , with . The basic motivation for this change was that the fitting weights in Paper I were almost always selected by eye (test-and-correct) for each angle. The new weight function works satisfactorily not only for all angles at a given evolution time in a simulation, but also for the vast majority of simulations (over a wide range of simulation parameters, e.g. resolution, injection rate, disc viscosity, orbital period, mass ratio, eccentricity). The new results on the azimuthal structure of the disc and how it is affected by the values of the parameters confirm the conclusions of Paper I, but they are more accurate and allow for better distinction of the differences between binary systems of different parameters.
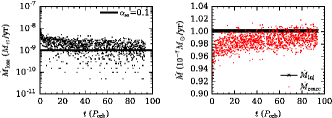
Three-dimensional smoothed particle hydrodynamics (SPH) simulations were performed for binary systems in which the Be disc is formed by uniform ejection of matter along the equator (Okazaki et al., 2002). The mass injection rate is constant and the same in all simulations, yr. The mass loss rate at QS roughly scales with , but is much smaller (about 2-3 orders of magnitude in the presented simulations) because most of the injected particles are reaccreted back onto the star (Figure 1). The value of was selected because it ensures a reasonable value for (/yr; Krtička 2014), as shown in Table 1.
The total mass injected per time step is divided into a fixed number of particles of equal mass (Table 1). For each SPH simulation, the values of and were chosen such that an adequate final number of particles at QS () is achieved. The disc is considered isothermal and has a fixed average temperature equal to with K. The primary Be star has mass and radius (typical values for a B2 star). Unless stated otherwise, the orbital period is d, the secondary-to-primary mass ratio is , and the Shakura & Sunyaev viscosity parameter is .
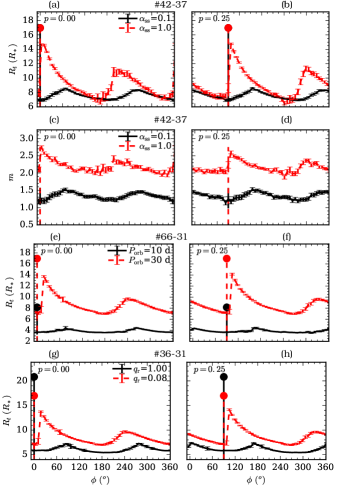
The truncation radius (Figures 2a-b, e-f, g-h) reaches a local maximum twice per cycle. The global maximum follows the direction of the secondary with some time lag, and the other local maximum is antidiametric to the first one. The two local maxima of trace the two spiral arms of the disc. The spiral arm that follows the secondary is generally different (more prominent) to its antidiametric one. The same azimuthally-shifted dependence on the orbital phase is clear for the other parameters of Eq. (1).
-
It is highlighted that:
- •
- •
-
•
A smaller secondary-to-primary mass ratio (less massive companion) results in disc truncation further away from the star, as shown in Figure 2g, although the orbital separation is smaller (Table 1). This can be explained as follows: Lower mass ratio means weaker gravitational force from the companion, and the disc is saturated less efficiently. The contrary happens for higher mass ratios, especially in the outer parts of the disc. Therefore truncation occurs at a longer distance from the primary star in systems of lower mass ratios. A smaller mass ratio also causes less closely wrapped spiral arms, but a smaller azimuthal lag with respect to the position of the secondary.
-
•
The simulations confirm the correlation between the time-scale of the disc variability and the orbital period found by Reig et al. (2005) in Be/X-ray binaries.
Note that, when the disc size is smaller (lower viscosity, closer binary, higher mass ratio), the azimuthal disc structure exhibits a variability frequency almost twice the orbital frequency, as the two spiral arms have a similar structure with almost equal high peaks. In other words, the two maxima in the functions of the parameters of Eq. (1) have equal values. This indicates a higher similarity in the density structure of the two spiral arms. It is expected that this (at least partially) is reflected also on the observables, and it will be evinced in the next section for the viscosity.
3 Radiative transfer calculations
At any time of evolution calculated with the SPH code, the density structure of the disc can be used as input for the three-dimensional non-local thermodynamic equilibrium Monte Carlo radiative transfer code Hdust (Carciofi & Bjorkman, 2006). Hdust first computes the temperature, ionisation and excitation structure of the gas, and then calculates the emergent spectrum for chosen directions.
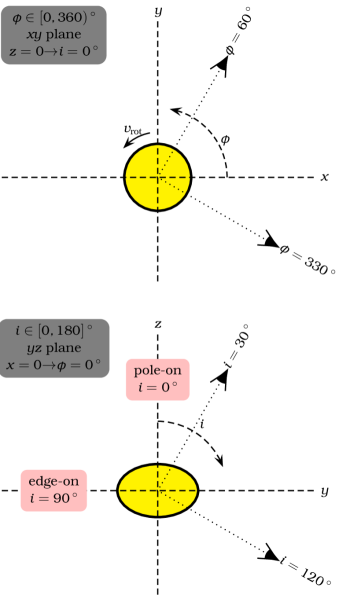
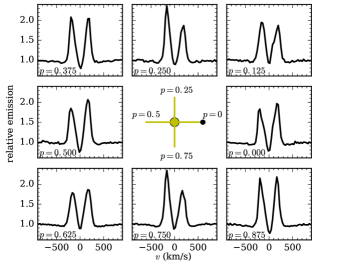
For an observer seeing the Be star at inclination and azimuthal angle (the observer’s coordinates are clarified in Figure 3), Hdust can compute the radiation flux for a range of wavelengths, as well as the line profiles for selected hydrogen transitions. Given the orbital modulation (Eq. 2) of the Be disc density at QS, the azimuthal angle of the observer can be transformed to a phase difference. Thus, running Hdust simulations for observers at constant but different values of , it is possible to compute functions of the orbital phase for various observables.
For the Hdust simulations, the primary Be star was considered oblate, with gravity darkening parameter (Espinosa Lara & Rieutord, 2011) and rotational-to-orbital velocity ratio . The rest of the parameters for an oblate star are calculated as explained by Faes (2015): equatorial and polar radii 5.5 and , equatorial and polar temperatures 18605 and 22670 K, respectively.
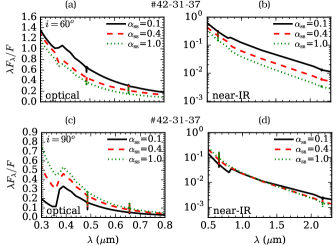
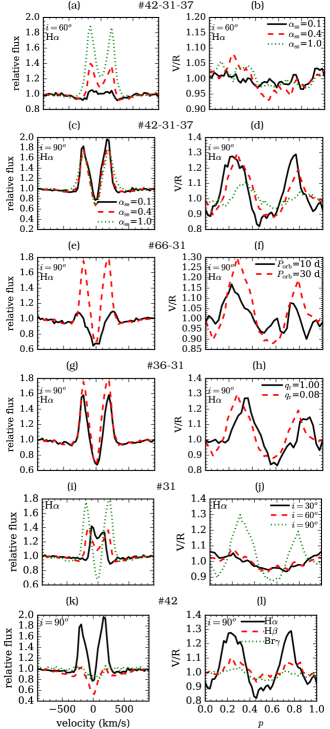
The radiative flux is higher for lower viscosities (Figure 4), as lower viscosity discs are denser (Table 1). This results in more light being absorbed at short wavelengths (, Balmer jump) and re-emitted at longer wavelengths, producing a respective flux excess in the visible and infrared (IR). An exception holds at : for an edge-on star (Figure 4c), the denser low-viscosity disc blocks a considerable portion of the stellar flux in the visible. Since a denser disc is smaller and cooler, it causes a higher flux excess only at longer wavelengths (far-IR). For lower values of at , the higher continuum level makes the relative emission intensity in lower, as shown in Figure 5a.
The V/R ratio is defined as the ratio of the violet and red peak heights (relative to continuum) in a double-peaked line profile:
| (3) |
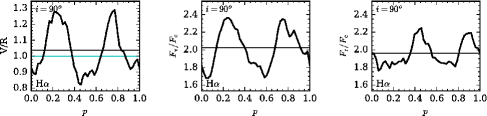
where is the continuum flux, is the peak emission of the V component, and is the peak emission of the R component. Symmetric profiles (V/R=1) indicate axisymmetric discs, while asymmetries arise from non-symmetric disc configurations and radial motions. The V/R variability amplitude increases with decreasing disc viscosity (Figure 5d). Since different parts of the disc, in general, have different velocities along the line of sight (LoS), it is expected that asymmetries in a spectrum are a combined result of both the disc structure and the projected velocities that are observed. Therefore, for inclinations , where the V/R variability amplitude is so small (at least for the range of parameter values explored in this work), it is difficult to constrain the system properties from this observable alone (Figure 5b).
In order to exclude the possibility that the aforementioned effect of viscosity (i.e. V/R variability decreasing with increasing viscosity) is a consequence of the different densities in SPH simulations, new radiative transfer calculations were performed. The original density structures from the three systems of different were used, but all three of them were scaled as to have the same density at the disc base (inner disc layer). In this way the continuum flux is overall the same and whatever difference is seen between the relative fluxes in is due solely to different truncation radii and disc density slopes, as extracted from SPH simulations with different values of disc viscosity. The results are shown in Figure 6, affirming that the V/R variability vanishes for high values of even if the base density is fixed.
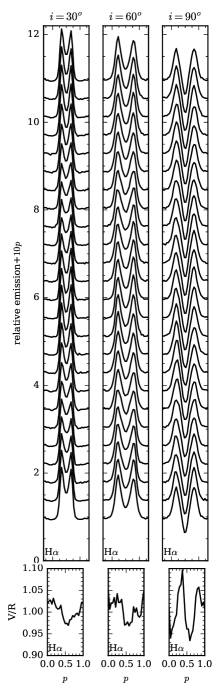
Figures 5i-j demonstrate the results of radiative transfer calculations for a system with disc viscosity , as seen from different inclination angles. This intermediate value of viscosity was chosen so that both the difference in the line profiles can be seen (lower values of do not have a double-peaked profile even at as large as in the spatial resolution of the SPH simulations; Figure 5a) and the V/R variability amplitude is sufficiently large at (it is small at higher ; Figure 5d). The results for the emission at different inclinations in general agree with the sample spectra given in figure 1 of Rivinius et al. (2013) for the line emissions of Be discs. The curve of Figure 5i confirms that the line profile of an edge-on star is that of a shell star (i.e. line profiles having sharp absorption cores below the continuum level; Hanuschik et al. 1996).
The V/R ratio in the low-viscosity system has two equal local maxima along the orbital period (Figure 5d), just as and in Figure 2a-d. Hence, if the V/R variation is attributed solely to binary interaction and successive maxima of V/R are equal, its variability period should be considered equal to half the orbital period. Were it verified that an observed star is a binary and the V/R variability period is equal to half the orbital period, this would hint at higher structural similarity between the two spiral arms.
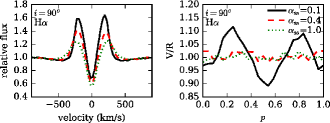
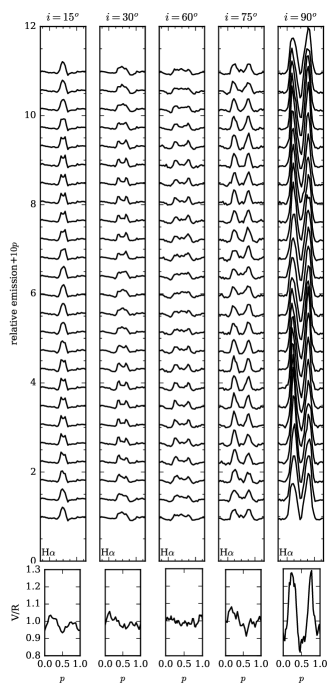
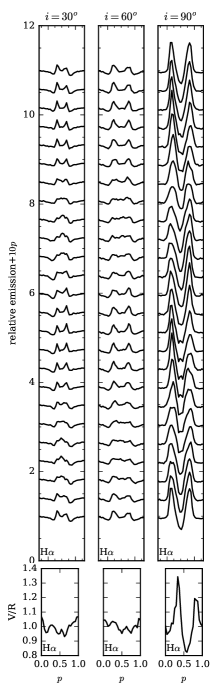
Figure 5j shows that the V/R orbital variability is more pronounced at higher inclination angles, thus corroborating the suggestion of Panoglou et al. (2017) with respect to the importance of inclination for the observables. This is also verified by Figure 7, which depicts that low-viscosity discs seen edge-on show strong line emission and V/R variability, while at the profiles are almost flat at any orbital phase. Note that the and panels of Figure 7 correspond to the same simulation represented by solid curves in Figures 5a-b and 5c-d, respectively.
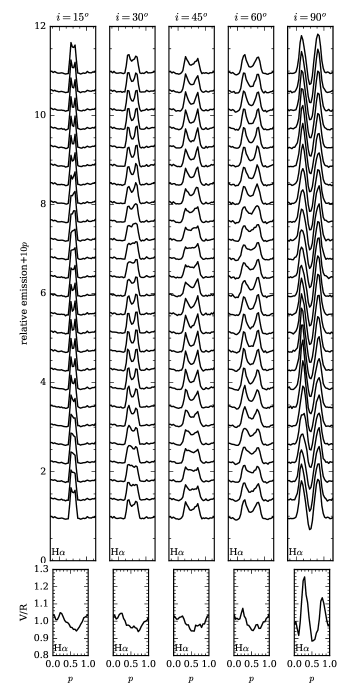
For low-to-intermediate values of viscosity, the shape of the line profiles changes both as a function of the orbital phase and with the inclination angle (Figure 8; the last two panels of this figure at correspond to the dashed curves of Figures 5a-d, respectively). Some flat-topped profiles appear in . For high disc viscosities a simple inspection of the line profiles as they change with the orbital phase (Figure 9; the panels in the middle and right column correspond to the dotted curves in Figures 5a-d, respectively) confirm to a further extent that, for any given viewing angle, there is little or no variability, just as the V/R curves show for the high-viscosity system (Figure 5d). This is an indication that, although the disc is highly non-axisymmetric for high viscosities (e.g. disc size in Figure 2a), the inner emitting region is hardly affected by the tidal interaction with the secondary. These and other observational characteristics will be further discussed in the next section.
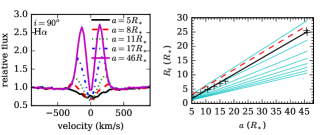
In closer binaries the shell features increase and the V/R variability amplitude decreases (Figure 5e,f). The lower the orbital period/separation, the weaker the line emission, consistent with the fact that the disc is smaller. The latter is confirmed with the help of Figure 10: The left panel shows the emission for various orbital separations. The right panel depicts the disc size as a function of separation. This figure is a reproduction of the top right panel of figure 12 from Paper I, with the truncation radius fitted with the new procedure described in §2. The azimuthally-averaged truncation radius now coincides almost perfectly with the 3:1 resonance radius, and can be expressed as a linear function of the orbital separation :
| (4) |
Eq. (4) provides a lower bound for a star to be able to form a disc: It is defined by the limiting value of disc truncation (), implying a minimal orbital separation (minimum d). No disc can be formed in circular binaries closer than , whose value probably depends on the other system parameters, as well. This explains the absence of Be stars in very close binary orbits. In the compilation of Gies (2000), only 4 out of 40 Be binaries belong to the shortest period group, d, and they are not even confirmed binaries. Figure 10 confirms the suggestion of Reig et al. (1997) that there is a positive correlation between emission strength, orbital period and Be disc size.
For higher secondary-to-primary mass ratios, the stronger disc truncation (Figure 2d) makes the emission peak heights slightly decrease (Figure 5g), but the V/R variability amplitude remains almost the same. A higher mass of the secondary star also causes a larger phase difference of the V/R ratio with respect to the position of the secondary, consistent with the time shift of the truncation radius maxima.
4 Discussion
In this section, comparisons between the spectra of single and binary Be stars, as well as steady and non-steady Be discs are given. Additionally, some peculiar features that emerged in the emission line profiles of binary Be discs (§3) are investigated, emphasising how they can serve as a first hint at binarity.
4.1 Single versus binary stars
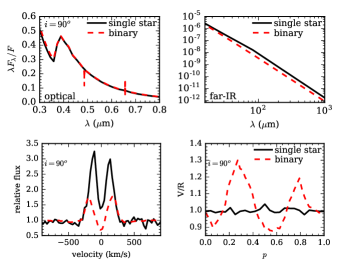
Figure 11 allows to compare the results of radiation transfer calculations for single and binary Be stars. For wavelengths up to the near-IR, the continuum flux is the same in single and binary stars, while in the far-IR the emission for both is a little higher for single stars. The central depression below the continuum level in Be discs in binary systems is due to lack of emission from the outer disc (since it is truncated), where the orbital velocities are low. No V/R variability is detected in single stars: In the absence of variability sources the disc and its emission are azimuthally symmetric.
4.2 Non-steady discs
Until now, only discs at QS have been studied. But, along with binary phase-dependent effects, other sources of variability might be also at play. The figures throughout this text should therefore be used as a reference only, keeping in mind that additional variability sources will add to or diminish the variations found in the model spectra. In this continuous interplay between the different mechanisms that may cause variations in the line profiles of Be stars, QS is an idealised scenario.
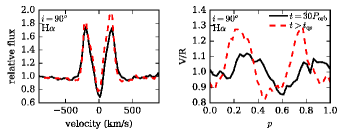
The majority of observed systems are probably out of QS. For this reason, a non-QS system was also studied (Figure 12). At of the time necessary to reach QS, the profile peaks are similar to QS, but the V/R variability is relatively weak. This is a direct effect of the early evolution of a disc in a binary system. The disc is still evolving towards its final spiralled QS structure and the spiral arms are not prominent enough yet. Therefore the emitting region is almost axisymmetric with no significant azimuthal dependence.
Even pronounced V/R variations in confirmed Be binaries can be not at all synchronised with the orbital period. A disc under the tidal effect of a companion star needs some time to become steady and maximise its V/R variability amplitude. The time to QS is delayed by other mechanisms that disturb its evolution. The most important factor in this respect is probably the generally variable mass ejection rate from the surface of the star. As a result, a Be disc in a binary system will reach QS later than theoretically computed (Table 1). When it does reach QS, at any time it can be perturbed and then start again to relax towards a steady state.
That might explain why, in many cases of confirmed binaries, the principal variability cycles have nothing to do with the binary period. For instance, the binary Be star Tau exhibited a V/R variability of d for more than a decade (Štefl et al., 2009), but its orbital period is d.
4.3 Line-profile features
4.3.1 Overall asymmetries
The gas in the spiral arms (which is denser than in the inter-arm regions) in general follows the direction of the companion’s orbit. If each arm were to be observed alone, it would be seen as blue-shifted (VR) for some phase range in the orbital cycle and red-shifted (VR) for the rest. If one of the arms is more prominent, then both the V and R emissions will be higher for this arm. This is always true in a two-armed binary-induced structure: the spiral arm that directly follows the companion star is denser than its antidiametric one.
The observer cannot see each one of the spiral arms isolated, but rather sees the disc as a whole with two (one dense and one more tenuous) spiral arms, together with the inter-arm gas. In the region between the two spiral arms, the particles are scattered in terms of velocity values and directions. Every half orbital period, a different spiral arm is directly seen by the observer. In the time between the direct observation of either one of the spiral arms, mostly the scattered gas particles are seen.
A more detailed description can be read off from Figures 13-14, by following therein the LoS during the companion’s orbital path for an edge-on star. At , the companion star is at lower conjunction and at at upper conjunction. At , the more massive and dense spiral arm is receding from the observer (red-shifted regime), and at its tail and the other arm are seen approaching so that its emission is at positive LoS velocities (V/R1, blue-shifted regime). At there is a new minimum, related to the latter (more tenuous) arm now receding.
At a first glance, it seems surprising that the two emission peaks are not equal even when averaged over a full orbit (Figure 13). This is not associated to the relative rotation of the disc gas with respect to the rotation of the companion. As explained in Paper I, the disc in circular retrograde systems is axisymmetric and simulations confirm that there is no V/R variability in such systems, just as in simple unperturbed keplerian rotation of single stars. Therefore the observational variability is restricted to prograde orbits.
So what causes the net orbit-averaged asymmetry of the double-peaked profile? The answer lies in the relative rotation of the system with respect to the observer. If the system were rotating in the direction opposite to the one shown in Figure 3, i.e. if the stellar rotational axis rotated by , the V/R curve would be flipped about both abscissa and ordinate. In other words, the preferential direction of the asymmetry in the V/R curve encodes the information whether the disc is seen from below or from above. This can be observationally tested through interferometry with phase information.
4.3.2 Flat-topped line profiles
In certain phase ranges, the inter-arm gas together with the two arms (one red- and one blue-shifted) produce the total emission reaching the observer as flat-topped profiles. Figures 7 and 8 show that flat-topped profiles are common in binary Be stars with low/intermediate disc viscosities and seen at intermediate viewing angles. The reason for this behaviour is probably connected to the observed differential velocities and the spiralled structure of the disc.
Such profiles occur twice per orbital period. This remark becomes more obvious in Figure 8, where the emission peaks in non-flat-topped profiles are higher and therefore the variation with the orbital phase is more clear. A closer look at the panel of Figure 8 allows to recognize that the 2nd-4th profiles from the bottom of the plot, which correspond to , are flat-topped and exhibiting a slope towards the violet side. The 13th-15th profiles, which correspond to , are also flat-topped and leaning to the red side. The mean values of in those phase ranges () indicate that this transition occurs nearly every half orbital period.
Flat-topped profiles have been observed in the past, e.g. the profiles given for HR 2142 in figure 23 of Hanuschik et al. (1996). HR 2142 is a binary system (Peters, 1983) consisting of a Be star and a subdwarf O star, with period d, mass ratio , and presumably zero eccentricity (Peters et al., 2016). All binary parameters are therefore similar to the simulation (#42), except for the orbital period. The dynamical spectrum of this system at inclination angle (Figure 15) matches well its observational equivalent (Peters et al., 2016, bottom panel of their figure 4). Peters et al. (2016) estimate the inclination angle within the range .
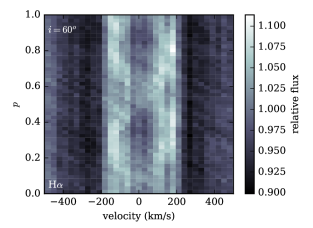
The profiles of Hanuschik et al. (1996) for HR 2142 are similar in shape to the profiles of Figure 7 (at ), but not in intensity (emission height). As shown in Figure 10, the emission height scales with the orbital separation. Therefore, higher emission profiles are qualitatively expected, as the orbital period of HR 2142 is much longer than 30 d (#42). Furthermore, the line emission changes with the inclination angle (Figure 5i), hence an inclination slightly different to might increase the line emission but roughly preserving the overall shape. This could enhance the assumption of higher inclination by Peters et al. (2016).
The consecutive blueward and redward transitions follow the disc rotation and essentially are LoS effects, as also Štefl et al. (2007) have stated. V/R does not take on values much lower than unity because, at the same time that the dense spiral arm comes closer to the observer, the tenuous spiral arm recedes. Whatever moves away contributes to the red-shifted emission component; whatever approaches contributes to the blue-shifted component. Oscillating flat-topped profiles occur during a narrow phase interval in which the number of approaching and receding particles is about balanced.
In summary, cyclically recurring flat-topped emission lines that change from a blueward to a redward declining slope may be indicative of the presence of a companion star. One such example is 25 Ori (Baade et al., in prep.), which has never in the past been a suspected binary. If the variability of 25 Ori is indeed induced by a companion, from the profiles in Baade et al. the orbital period can be estimated to about 6 yr and the minimum separation with the companion 7.2 AU.
4.3.3 Inflection points
As shown in Figure 5h, the V/R variability amplitude stays roughly the same for a system with more than 10 times larger mass ratio. Line profiles for the simulation (#36) were also computed for different orbital phases (Figure 16). Flat-topped profiles appear twice per period at and . At , the shape changes from typical, in high inclinations, (non-symmetric) double-peaked profiles (bottom profile) to profiles with three peaks (4th-5th and 16th-17th profiles), the middle one of which is higher than the other two. The phase range of transitioning between double-peaked and triple-peaked profiles is characterised by flat-topped profiles (3rd, 6th and 15th, 18th, respectively).
According to its mathematical definition, an inflection point is where the curvature of a continuous function changes direction, i.e. where its second derivative changes sign. Changes of the curvature direction occur in flat-topped and triple-peaked profiles, producing a flickering effect. The term “inflection” was introduced in line profile studies by Hanuschik (1986). The inflections observed in some profiles have been attributed by Hanuschik (1986) to the profile being composed of two components, one broad and strong, and another narrow, weaker and double-peaked. In a later work by Hanuschik et al. (1996), the authors attribute the inflections to the viewing angle.
-
Several questions arise:
-
1.
Could triple-peaked profiles be thought of as an evolved state of flat-topped profiles? Do inflection points and wiggles in flat-topped profiles have anything in common?
-
Yes to both questions.
The evolution with the orbital phase of the profile shape can be pictured as double-peakedflat-toppedtriple-peakedflat-toppeddouble-peaked (see for example the second panel of figure 3 in Štefl et al. 2007). Furthermore, Štefl et al. (2007) report that triple-peaked profiles occur at phases of VR to RV transitions. This remark strengthens the notion of a relation between triple-peaked and flat-topped emission-line profiles.
-
2.
Could triple-peaked profiles be seen as profiles with six rather pronounced inflection points (resulting in three emission maxima and two emission minima between them)?
-
Yes,
according to the mathematical definition of inflections. In this case, it is logically deduced that the minima in triple-peaked profiles can be caused either by lack of emitters or by excess of absorbers at a given velocity. The correlation of inflection points with peaks from optically thin lines hints at the latter (see, for example, figures 26-27 in Hanuschik et al. 1996: the change of curvature in the profiles coincides with maxima of Fe ii emission).
From all simulations presented here, quite a few demonstrate flat-topped profiles and inflections in certain phase ranges. Thus, within a certain viewing angle range that depends on system parameters, such profile shapes should in general appear in binary systems, even if no other variability source is present. Thus, also triple-peaked profiles do not have to be limited to Be shell stars, as was suggested by Štefl et al. (2009).
Despite the nowadays commonly accepted concept that triple-peaked profiles are associated with disc warping in misaligned binaries (see discussion by Moritani et al., 2013), it has been shown here that such shapes can occur also in coplanar binaries. This is not a complete contradiction: The idea rests on warped discs that can be caused by the phase-dependent vertical force from the companion in misaligned systems. Warping essentially leads to a vertical re-distribution of the disc matter in the radial direction from the non-warped to the warped region. But this also happens in all spiralled disc structures and in coplanar binary systems, as well: The spiral arms produce a density structure that changes non-monotonically in the radial direction (see for example figure 4 in Paper I).
The reader is reminded that profiles as the ones shown in Figure 16 should not be exclusively associated with binaries with mass ratio . The system simulated to produce those profiles has specific stellar, disc and orbital characteristics. Changing the value of each one of them causes modifications or even disappearance of certain observational features. This of course applies to all results shown earlier in this text (for example, flat-topped profiles should not be necessarily attributed to low viscosities, but with more pronounced spiral arms).
4.4 V/R curves for different emission lines
Figures 5k-l show the emission line profiles and the V/R ratios in , and for the low-viscosity system (#42) at . The relative flux is smaller for and , and so is the variability amplitude of the V/R ratio. In higher viscosities and lower inclinations there is hardly any emission and V/R variability. This might be an indication that and originate from a smaller region of the inner disc, and are thus less perturbed by the secondary.
Phase lags between V/R curves have been reported for various pairs of emission lines (many relevant observations are mentioned in Baade 1985). Their existence is due to the helical disc structure (Okazaki, 1991). For the pair they can be attributed to the smaller emission region of , as H i IR lines are optically thinner (Wisniewski et al., 2007). The V/R cycles of , and reported by Dodson (1936) for 25 Ori exhibit phase differences. In fact, Dodson (her figure 4) reports , and V/R cycles of yr for 25 Ori, close to the value roughly estimated in §4.3.2. The strong variability of the strength of emission lines documented in the said figure makes this a moot point: The inferred variable mass injection rate prevents QS to be reached so that there is no phase lacking.
The phase shift between different emission lines is a result of both the size of the emitting region and the azimuthal structure of the disc. If an emission line is only emitted close to the star, its emitting region will be smaller. The size of the emitting region is important for the emission peak height, but not its variability. The spiral structure of the disc defines its azimuthal modulation and thus the orbital modulation of observables. The spiral arms are essentially accompanied by radial modulation of the density along a constant azimuthal angle, and result in phase lags of the V/R ratio of different emission lines.
5 Conclusions
Perturbed line profiles that deviate from the standard double-peaked profiles of axisymmetric discs have in the past been suggested as related to binary tidal effects. The present work demonstrated that this is a very plausible scenario: binary-induced disc perturbations result in V/R variations of spectral lines. Under special circumstances, even a single emission-line profile can provide hints at the binary nature or not of a Be star. Time series of profiles may allow to constrain the physical properties of binaries.
-
Binarity causes a two-armed spiral structure in the Be disc. Depending on system parameter values, this structure is accompanied by certain observational features. The main conclusions regarding those features are the following:
-
•
Disc truncation results in reduction of the emission peak heights because they form at low orbital velocities, which is the region cut by the companion.
-
•
Two main characteristics seem to prove binarity: If the star is seen equator-on, there will be relatively strong V/R variability. Otherwise, flat-topped profiles are indicators of the existence of a binary companion. None of those rules can be applied if the disc viscosity is large.
-
•
Flat-topped profiles appear at intermediate viewing angles. They seem to be closely associated with profile wiggles and triple-peaked profiles, and they occur during blueward and redward transitions of double-peaked profiles.
-
•
Along the orbital cycle the V/R ratio exhibits two maxima at which the double-peaked emission profiles are maximally blue-shifted. The generally unequal maxima of the V/R ratio are associated with one of the spiral arms being more pronounced than the other, contributing more strongly to the total emission.
Binarity is only one of the possible means to produce variability in Be stars. Even if binarity is indeed the cause of V/R variations, it often may not be strong enough, so that the binary signature becomes veiled by other variability sources. It is still unknown what is the exact origin of mass ejection from the stellar surface. The most probable scenario is that mass is ejected due to instabilities caused by non-radial pulsations (NRP; Rivinius et al. 2003), in a probably non-continuous and non-isotropical manner. The NRP frequencies are connected to the short-term variability of Be stars (Baade et al., 2016), probably because of the non-axisymmetric ejections of mass that they cause. The rapid rotation of Be stars assists the mass particles with escaping the photosphere, which makes the disc start being built up. This causes azimuthal and temporal variability due to wave propagation. Some memory of this variability may be preserved by the mass ejection mechanism and so induce time dependencies. The most important variabilities are long-term modulations, probably also caused by NRPs, of the mass loss rate.
As soon as the disc has reached some adequate extent and mass, it starts to oscillate. One-armed density waves due to disc oscillations (which might as well be triggered by NRPs) or/and two-armed spirals due to the gravitational effect from a potential companion are ways to maintain (or complicate) the variation scheme. The two-armed spiral structure can be found only in binary systems, but this only adds to the effects from NRPs, stochastic and localised ejections, one-armed global density waves, all of which can exist in both single and binary Be stars.
Acknowledgements.
The authors thank the anonymous referee for prompting the extension of this study, which improved greatly the quality of the manuscript. This work made use of the computing facilities of the Laboratory of Astroinformatics (IAG/USP, NAT/Unicsul; brazilian agency FAPESP, grant 2009/54006-4). The authors also thank for the much-needed access to the computer cluster of the Group of Applied Geophysics (ON, Brazil). DP acknowledges FAPESP (2013/16801-2) and CNPq (MCTIC, Brazil; 300235/2017-8). DMF acknowledges FAPESP (2016/16844-1). ACC acknowledges CNPq (307594/2015-7) and FAPESP (2015/17967-7).
References
- Baade (1985) Baade D., 1985, A&A, 148, 59
- Baade (1992) Baade D., 1992, in Kondo Y., Sistero R., Polidan R. S., eds, IAU Symp. Vol. 151, Evolutionary processes in interacting binary stars. p. 147
- Baade et al. (2016) Baade D., et al., 2016, A&A, 588, A56
- Carciofi & Bjorkman (2006) Carciofi A. C., Bjorkman J. E., 2006, ApJ, 639, 1081
- Dodson (1936) Dodson H. W., 1936, ApJ, 84, 180
- Espinosa Lara & Rieutord (2011) Espinosa Lara F., Rieutord M., 2011, A&A, 533, A43
- Faes (2015) Faes D. M., 2015, PhD thesis, University of São Paulo & University Nice-Sophia Antipolis (arXiv:1512.06094)
- Gies (2000) Gies D. R., 2000, in Smith M. A., Henrichs H. F., Fabregat J., eds, Astron. Soc. Pac. Vol. 214, The Be phenomenon in early-type stars. p. 668
- Hanuschik (1986) Hanuschik R. W., 1986, A&A, 166, 185
- Hanuschik et al. (1996) Hanuschik R. W., Hummel W., Sutorius E., Dietle O., Thimm G., 1996, A&AS, 116, 309
- Huang (1972) Huang S.-S., 1972, ApJ, 171, 549
- Krtička (2014) Krtička J., 2014, A&A, 564, A70
- Kubát & Saad (2008) Kubát J., Saad S. M., 2008, in Hamann W.-R., Feldmeier A., Oskinova L. M., eds, Clumping in hot-star winds. p. 245
- Křiž & Harmanec (1975) Křiž S., Harmanec P., 1975, Bull. Astr. Inst. Czechoslovakia, 26, 65
- Moritani et al. (2013) Moritani Y., et al., 2013, PASJ, 65, 83
- Okazaki (1991) Okazaki A. T., 1991, PASJ, 43, 75
- Okazaki et al. (2002) Okazaki A. T., Bate M. R., Ogilvie G. I., Pringle J. E., 2002, MNRAS, 337, 967
- Panoglou et al. (2016) Panoglou D., Carciofi A. C., Vieira R. G., Cyr I. H., Jones C. E., Okazaki A. T., Rivinius T., 2016, MNRAS, 461, 2616
- Panoglou et al. (2017) Panoglou D., Faes D. M., Carciofi A. C., Okazaki A. T., Rivinius T., 2017, in Miroshnichenko A., ed., Astron. Soc. Pac. Vol. 508, The B[e] phenomenon: Forty years of studies. p. 131
- Peters (1983) Peters G. J., 1983, PASP, 95, 311
- Peters et al. (2016) Peters G. J., Wang L., Gies D. R., Grundstrom E. D., 2016, ApJ, 828, 47
- Reig et al. (1997) Reig P., Fabregat J., Coe M. J., 1997, A&A, 322, 193
- Reig et al. (2005) Reig P., Negueruela I., Fabregat J., Chato R., Coe M. J., 2005, A&A, 440, 1079
- Rivinius et al. (2003) Rivinius T., Baade D., Štefl S., 2003, A&A, 411, 229
- Rivinius et al. (2006) Rivinius T., Štefl S., Baade D., 2006, A&A, 459, 137
- Rivinius et al. (2013) Rivinius T., Carciofi A. C., Martayan C., 2013, A&ARv, 21, 69
- Saad et al. (2005) Saad S. M., et al., 2005, Ap&SS, 296, 173
- Shakura & Sunyaev (1973) Shakura N. I., Sunyaev R. A., 1973, A&A, 24, 337
- Štefl et al. (2007) Štefl S., Okazaki A. T., Rivinius T., Baade D., 2007, in Okazaki A. T., Owocki S. P., Štefl S., eds, Astron. Soc. Pac. Vol. 361, Active OB stars: Laboratories for stellar and circumstellar physics. p. 267
- Štefl et al. (2009) Štefl S., et al., 2009, A&A, 504, 929
- Wisniewski et al. (2007) Wisniewski J. P., Kowalski A. F., Bjorkman K. S., Bjorkman J. E., Carciofi A. C., 2007, ApJ, 656, L21