Extreme CO Isotopic Abundances in the ULIRG IRAS 13120-5453: An Extremely Young Starburst or Top-Heavy Initial Mass Function
Abstract
We present ALMA 12CO (J=1-0, 3-2 and 6-5), 13CO (J=1-0) and C18O (J=1-0) observations of the local Ultra Luminous Infrared Galaxy, IRAS 13120-5453. The morphologies of the three isotopic species differ, where 13CO shows a hole in emission towards the center. We measure integrated brightness temperature line ratios of 12CO/13CO 60 (exceeding 200) and 13CO/C18O 1 in the central region. Assuming optical thin emission, C18O is more abundant than 13CO in several regions. The abundances within the central 500 pc are consistent with enrichment of the ISM via a young starburst (7Myr), a top-heavy initial mass function or a combination of both.
1 Introduction
Isotopic abundances in the interstellar medium (ISM) can be used as a tracer of stellar nucleosynthesis. The 12C/13C isotope ratio is an important tracer of the relative degree of primary versus secondary processing in stars. The 12C atom is a primary species produced in intermediate and high-mass stars (e.g Prantzos et al., 1996). Massive stars are also responsible for the majority of 16O and 18O. The 13C atom is an intermediary species that is transformed into 14N. In the red giant phase of low/intermediate mass stars, 13C is lifted to the envelope via convection (Wilson & Matteucci, 1992) and eventually released into the ISM. Massive stars are short-lived and will start to enrich the ISM in 12C in 106 years while 13C enrichment needs 109 years (e.g. Vigroux et al., 1976).
Ultra/Luminous Infrared Galaxies (U/LIRGs) are extreme starbursts offering great laboratories to study high-mass star formation. It has long been observed that 13CO emission is unusually weak relative to 12CO ( 20-40; Aalto et al., 1991; Casoli et al., 1992) compared to that from normal disk galaxies ( 10; e.g. Paglione et al., 2001). Pioneering work by Casoli et al. (1992) and Henkel & Mauersberger (1993) presented several scenarios to explain this unusual emission ratio such as optical depth effects, abundance variations via some mechanism such as photo-dissociation, inflowing low metallicity gas or enrichment of the ISM and a two-phase molecular medium consisting of a diffuse envelope where 12CO can better self-shield than 13CO. Recent radiative transfer modeling of the molecular gas in several U/LIRGs is consistent with high [12CO]/[13CO]111Square brackets denote an abundance ratio while all other ratios are integrated brightness temperature ratios abundance ratios (90; Sliwa et al., 2013, 2014; Henkel et al., 2014; Papadopoulos et al., 2014; Tunnard et al., 2015).
Recent work on the [16O]/[18O] abundance in U/LIRGs using H2O and OH observations have shown varying values from 30 for Mrk231 González-Alfonso et al. (2010), around 50-150 for Arp220 (González-Alfonso et al., 2014) and Zw 049.057 (Falstad et al., 2015) and 500 for Arp 299 (Falstad et al., 2017) and NGC 4418 (González-Alfonso et al., 2014). König et al. (2016) used Atacama Large Millimeter/submillimeter Array (ALMA) CO data to show that the [16O]/[18O] 900 for NGC 1614. The high [16O]/[18O] abundance ratios are believed to be due to inflowing gas and the low values to stellar processing.
IRAS 13120-5453 (catalog ) (dubbed the “Yo-Yo”) is a nearby ULIRG (DL = 144 Mpc) with a far-infrared luminosity ( = 1.5 1012 ; Sanders et al., 2003) similar to that of Arp 220. The system has been classified as a post-merger (Haan et al., 2011). X-ray emission is consistent with a Compton-thick active galactic nucleus (AGN; Iwasawa et al., 2011) and contributes 18 to the infrared luminosity (Sturm et al., 2011). The Fourier Transform Spectrometer (FTS) observed multiple high- CO lines as well as CI, H2O, NII, OH and more (Rosenberg et al., 2015; Mashian et al., 2015; Pearson et al., 2016; Privon et al., 2017). Privon et al. (2017) shows that the HCN/HCO+ line ratio observed with ALMA suggests an increased HCN abundance via turbulent heating.
In this Letter, we present new ALMA Cycle 2 observations of IRAS 13120-5453 where we have detected three 12CO transitions, 13CO and C18O =10. The morphology of the three species differs and offers insight into the mechanism that may be controlling the [12CO]/[13CO] ratio. We show that massive stars have enriched the ISM in 12C and 18O and drive the observed line ratios in IRAS 13120-5453.
2 Observations and Line Ratios
ALMA was used to observe IRAS 13120-5453 in Cycle 2 using Bands 3, 7 and 9 (Table 1). We calibrated all datasets manually in CASA v4.5.3 (McMullin et al., 2007) using standard calibration steps. We implemented two iterations of phase-only self calibration on the 12CO datasets, which did not significantly alter the morphology of IRAS 13120-5453. We CLEAN the datacubes using a Briggs robust weighting of 0.5 down to 1 level with channels widths of 20 or 35 km s-1. Integrated intensity maps were created using the CPROPs (Rosolowsky & Leroy, 2006) masking routine222The routine finds pixels greater than 3 in 2 channels and then includes emission down to some level around the pixel. This method is excellent at excluding spurious noise pixels and only channels that contained masked emission were included down to 1.5. All maps were primary beam corrected (Figure 1).
| ParameteraaOther line present in the data will be discussed in forthcoming paper (Sliwa et al in prep.) | 12CO =10 | 12CO =32 | 12CO =65 | 13CO =10 | C18O =10 |
|---|---|---|---|---|---|
| Obs Data | 2015 July 03 | 2015 June 07 | 2015 June 09 | 2015 July 22 | 2015 July 22 |
| Calibrators | J1107-4449 | J1427-4206 | J1256-0547 | J1107-4449 | J1107-4449 |
| J1551-1755 | Titan | J1427-421 | J1427-421 | J1427-421 | |
| Titan | J1329-5608 | J1329-5608 | J1329-5608 | J1329-5608 | |
| J1329-5608 | J1315-5334 | J1427-4206 | |||
| Integration Time (s) | 652 | 867 | 1567 | 3117 | 3117 |
| Median PWV (mm) | 2.4 | 0.63 | 0.37 | 3.2 | 3.2 |
| Median Tsys (K) | 64 | 135 | 984 | 82 | 82 |
| FluxbbUncertainties in curved and square brackets denote measurement and calibration uncertainties, respectively. (Jy km s-1) | 126 (2) [ 13] | 1265 ( 15) [ 130] | 2460 ( 25) [ 370] | 2.21 (0.05) [0.2] | 2.1 (0.05) [0.2] |
| rms (mJy beam-1) | 1.5 (20 km s-1) | 1.1 (20 km s-1) | 16 (20 km s-1) | 0.3 (35 km s-1) | 0.3 (35 km s-1) |
| Resolution (arcsec) | 0.58 0.35 | 0.39 0.29 | 0.25 0.16 | 0.55 0.41 | 0.55 0.41 |
All three 12CO transitions have similar morphologies with a single nucleus.
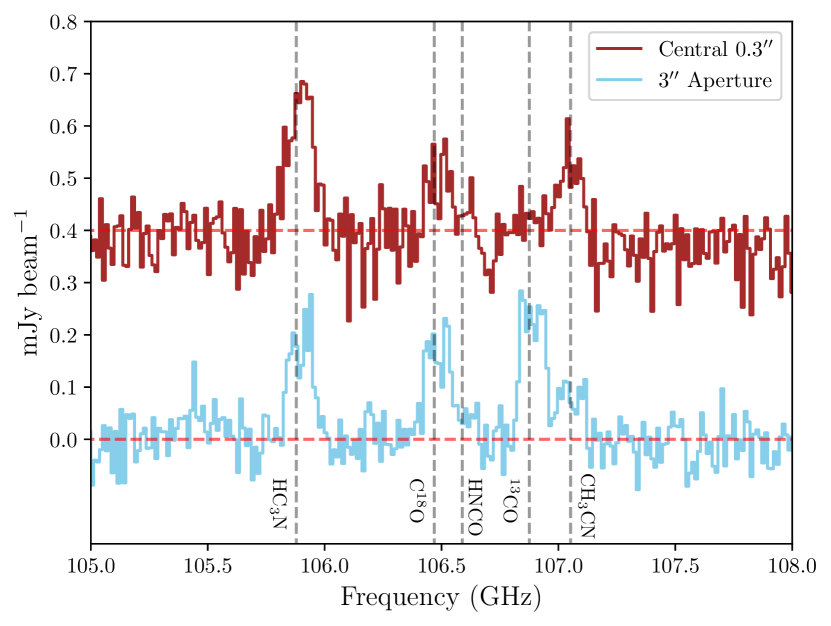
The 13CO =10 emission is more interesting with no emission above 1.5 near the central nucleus ( 0.85″ 0.3″ = 590 pc 210 pc) and two relatively strong emission regions outside the nucleus. The region lacking emission is within the starburst region (0.5 kpc) measured by Privon et al. (2017). Interestingly, the C18O emission is relatively strong where there is no 13CO emission. In the central 0.3″ spectrum (Figure 3), it is evident that C18O is stronger than 13CO. We note that C18O may be partially contaminated by HNCO (50,5 - 40,4) and several higher-energy transitions that lie on top of the C18O line. Along a line of sight, the maximum contamination is likely 30 determined from the peak of the HNCO (50,5 - 40,4) transition; however, we do not make any corrections since this is an upper limit to the contamination and may only contribute to part of the C18O line profile.
Selective UV photodissociation of the rare CO isotopologues should affect both 13CO and C18O, with the nominally rarer C18O affected the most. Thus it could not produce the observed relative line intensity ratio variations between them, let alone boost the C18O abundance to be higher than 13CO in the inner 500 pc of IRAS 13120-5453. If optical depth effects were causing the ring, C18O should also be observed in a ring since both 13CO and C18O are assumed to be optically thin. The Band 3 observations, observed 19 days apart, have similar -coverage adding confidence to the observed differences in morphology and corresponding intensities between the lines. The three 12CO maps (Figure 1) also show that as we go to higher-resolution (J=1-0 J=6-5) we do not see a ring in 12CO.
Integrated brightness temperature (I = TBdV) line ratio maps can offer some insight into the conditions of the molecular gas. We create the following line ratios maps:
R10 =
Y10 =
Z10 =
We match the 12CO, 13CO and C18O =10 maps to an angular resolution of 0.60″ 0.45″. We then create line ratio maps by cutting emission below 2 in each map and converting the units from Jy beam-1 km s-1 to K(TB) km s-1 (Figure 4).
The R10 line ratio shows a wide range of values from 10 to over 250. While values of around 30 are common for local U/LIRGs (e.g Sliwa et al., 2012, 2013, 2014), values exceeding 100 have never been observed before in local ULIRGs. The Y10 line ratio ranges from 0.2 to over 4. Values below 1 are rare in extragalactic systems where normal disk galaxies have an average Y10 value of 6 and normal starbursts show Y10 values of 3 (Jiménez-Donaire et al., 2017). Arp 220 (Greve et al., 2009; Matsushita et al., 2009) and the high-z ULIRG SMM J2135-0102 (Danielson et al., 2013) show a Y10 ratio of 1 while the LIRG merger remnant, NGC 2623, shows a Y10 ratio of 1.8 (Sliwa et al. in preparation). The Z10 values range from 20-140 and are similar to those of Mrk 231 (González-Alfonso et al., 2010), Arp 220 (González-Alfonso et al., 2014) and Zw 049.057 (Falstad et al., 2015).
3 Extreme Isotopic Abundances
We argue that IRAS 13120-5453 has an extreme isotopic abundance ratio when compared to normal star-forming galaxies. The brightness temperature line ratio of species A and B can be expressed as
| (1) |
where Tex is the excitation temperature and is the optical depth of the particular species and transition. For simplicity, we assume local thermal equilibrium (LTE; i.e. T = T = Tkin). (Significant radiative trapping for the abundant species can give T = Tkin while T Tkin.) If species B is optically thin and species A is optically thick, then
| (2) |
If 12CO is optically thick, the line ratios R10 and Z10 are lower limits to the relative abundance of 12CO to 13CO and C18O since the observed line ratio is attenuated by the optical depth of 12CO. Since R10 and Z10 1, both 13CO and C18O must be optically thin. Thus the Y10 line ratio of 1 implies that C18O is more abundant that 13CO in the central region; this would still be true even if the HNCO contamination were to reach 50%.
4 Root of the Extreme Abundances
Photo-dissociation: Since C18O is bright relative to 13CO, we can rule out selective photo-dissociation as the dominant mechanism since both C18O and 13CO would be destroyed by UV radiation.
Fractionation: The most important carbon isotope exchange is
| (3) |
(Watson et al., 1976) where the forward reaction dominates in cold environments ( 30 K) favouring the formation of 13CO. In hot environments, both directions have equal probability (Roueff et al., 2015). We use the non-LTE code RADEX (van der Tak et al., 2007) and a Bayesian likelihood code (Kamenetzky et al., 2012) to constrain the molecular gas physical conditions within the 400pc central region using only the 12CO observations. We fit the 12CO =10 line with a Gaussian profile of FWHM=375 km s-1. The most probable solution is warm, dense molecular gas with a = 130 K , log() = 4.2 cm-3 and log(M(H2)/) = 7.8 . Since the molecular gas is not cold enough for the forward reaction to dominate, we can rule out fractionation as a possible mechanism affecting the abundance. We also note that C18O does not undergo fractionation and should reflect stellar processing (Langer et al., 1984).
Infalling Gas: The merger process can drive a gas inflow towards the nuclear regions (e.g. Hopkins et al., 2006; Kewley et al., 2006; Ellison et al., 2008). The Galaxy has an increasing radial gradient in the [12CO]/[13CO] abundance ratio ranging from 30 in the center to 100 at large radii (e.g. Milam et al., 2005). Jiménez-Donaire et al. (2017) have shown that a trend with [13CO]/[C18O] exists in disk galaxies as well with an average value of 6.00.9. Analyses of close galaxy pairs have shown that their metallicities are lower than similar field galaxies (Kewley et al., 2006; Ellison et al., 2008). Rupke et al. (2008) found that the dilution of the nuclear metallicity (Z) due to gas inflow is Zfinal/Zinitial 0.5; therefore, if we assume an initial [12CO]/[13CO] ratio of 30, we would expect a final ratio of 60. This would not be sufficient to explain the observed line ratios in the central regions, particularly the brighter C18O emission.
Nucleosynthesis: Enrichment of the ISM via massive stars is a likely mechanism. Massive stars are the dominant sources of 12C, 16O and 18O while 13C is predominately released from low/intermediate mass stars. Simulations show that the metallicity in the merger increases when the star-formation rate increases significantly, especially near the end of the merger process (Torrey et al., 2012).
For nucleosynthesis enrichment to be plausible, the starburst must be young. With a normal initial mass function (IMF) such as the Kroupa IMF (e.g. Kroupa, 2001) within 6Myr, all stars 30 will have gone supernova ejecting material. Using the nucleosynthesis yield calculations for core-collapse supernovae (CCSNe) of Nomoto et al. (2006) and assuming a total star-forming molecular mass of 109 and an initial metallicity of Z=0.02 (Z⊙), the [12CO]/[13CO] value of the ejected material after 6Myr will be 575, while after 7Myr when all stars above 25 will have gone supernova, the [12CO]/[13CO] will be 60.
If the starburst is older (7Myr), an alternative solution is a top=heavy IMF. Bartko et al. (2010) find a top-heavy IMF for the Galactic center of dN/dm m-0.45±0.3. Habergham et al. (2010) also invoke a top-heavy IMF to explain the excess of CCSNe in interacting/mergers galaxies when compared to isolated galaxies. Assuming only stars of 10-130 will eject material vis CCSNe, a Kroupa IMF will produce a [12CO]/[13CO] abundance of 40 while a flat, top-heavy IMF (m0) will produce a [12CO]/[13CO] abundance of 270. While a flat IMF is an arbitrary choice, a top-heavy IMF of some variety is required if the starburst is older than 6Myr to explain our observed abundances in the central region. We also note that a combination of both a young-starburst and a top-heavy IMF is also plausible. Future work into the star formation history of IRAS 13120-5453 is required to clarify the starburst-age/IMF degeneracy.
References
- Aalto et al. (1991) Aalto, S., Johansson, L. E. B., Booth, R. S., & Black, J. H. 1991, A&A, 249, 323
- Bartko et al. (2010) Bartko, H., Martins, F., Trippe, S., et al. 2010, ApJ, 708, 834
- Casoli et al. (1992) Casoli, F., Dupraz, C., & Combes, F. 1992, A&A, 264, 55
- Danielson et al. (2013) Danielson, A. L. R., Swinbank, A. M., Smail, I., et al. 2013, MNRAS, 436, 2793
- Ellison et al. (2008) Ellison, S. L., Patton, D. R., Simard, L., & McConnachie, A. W. 2008, AJ, 135, 1877
- Falstad et al. (2017) Falstad, N., González-Alfonso, E., Aalto, S., & Fischer, J. 2017, A&A, 597, A105
- Falstad et al. (2015) Falstad, N., González-Alfonso, E., Aalto, S., et al. 2015, A&A, 580, A52
- González-Alfonso et al. (2010) González-Alfonso, E., Fischer, J., Isaak, K., et al. 2010, A&A, 518, L43
- González-Alfonso et al. (2014) González-Alfonso, E., Fischer, J., Graciá-Carpio, J., et al. 2014, A&A, 561, A27
- Greve et al. (2009) Greve, T. R., Papadopoulos, P. P., Gao, Y., & Radford, S. J. E. 2009, ApJ, 692, 1432
- Haan et al. (2011) Haan, S., Surace, J. A., Armus, L., et al. 2011, AJ, 141, 100
- Habergham et al. (2010) Habergham, S. M., Anderson, J. P., & James, P. A. 2010, ApJ, 717, 342
- Henkel & Mauersberger (1993) Henkel, C., & Mauersberger, R. 1993, A&A, 274, 730
- Henkel et al. (2014) Henkel, C., Asiri, H., Ao, Y., et al. 2014, A&A, 565, A3
- Hopkins et al. (2006) Hopkins, P. F., Hernquist, L., Cox, T. J., et al. 2006, ApJS, 163, 1
- Iwasawa et al. (2011) Iwasawa, K., Sanders, D. B., Teng, S. H., et al. 2011, A&A, 529, A106
- Jiménez-Donaire et al. (2017) Jiménez-Donaire, M. J., Cormier, D., Bigiel, F., et al. 2017, ApJ, 836, L29
- Kamenetzky et al. (2012) Kamenetzky, J., Glenn, J., Rangwala, N., et al. 2012, ApJ, 753, 70
- Kewley et al. (2006) Kewley, L. J., Geller, M. J., & Barton, E. J. 2006, AJ, 131, 2004
- König et al. (2016) König, S., Aalto, S., Muller, S., et al. 2016, A&A, 594, A70
- Kroupa (2001) Kroupa, P. 2001, MNRAS, 322, 231
- Langer et al. (1984) Langer, W. D., Graedel, T. E., Frerking, M. A., & Armentrout, P. B. 1984, ApJ, 277, 581
- Mashian et al. (2015) Mashian, N., Sturm, E., Sternberg, A., et al. 2015, ApJ, 802, 81
- Matsushita et al. (2009) Matsushita, S., Iono, D., Petitpas, G. R., et al. 2009, ApJ, 693, 56
- McMullin et al. (2007) McMullin, J. P., Waters, B., Schiebel, D., Young, W., & Golap, K. 2007, in Astronomical Society of the Pacific Conference Series, Vol. 376, Astronomical Data Analysis Software and Systems XVI, ed. R. A. Shaw, F. Hill, & D. J. Bell, 127
- Milam et al. (2005) Milam, S. N., Savage, C., Brewster, M. A., Ziurys, L. M., & Wyckoff, S. 2005, ApJ, 634, 1126
- Nomoto et al. (2006) Nomoto, K., Tominaga, N., Umeda, H., Kobayashi, C., & Maeda, K. 2006, Nuclear Physics A, 777, 424
- Paglione et al. (2001) Paglione, T. A. D., Wall, W. F., Young, J. S., et al. 2001, ApJS, 135, 183
- Papadopoulos et al. (2014) Papadopoulos, P. P., Zhang, Z.-Y., Xilouris, E. M., et al. 2014, ApJ, 788, 153
- Pearson et al. (2016) Pearson, C., Rigopoulou, D., Hurley, P., et al. 2016, ApJS, 227, 9
- Prantzos et al. (1996) Prantzos, N., Aubert, O., & Audouze, J. 1996, A&A, 309, 760
- Privon et al. (2017) Privon, G. C., Aalto, S., Falstad, N., et al. 2017, ApJ, 835, 213
- Rosenberg et al. (2015) Rosenberg, M. J. F., van der Werf, P. P., Aalto, S., et al. 2015, ApJ, 801, 72
- Rosolowsky & Leroy (2006) Rosolowsky, E., & Leroy, A. 2006, PASP, 118, 590
- Roueff et al. (2015) Roueff, E., Loison, J. C., & Hickson, K. M. 2015, A&A, 576, A99
- Rupke et al. (2008) Rupke, D. S. N., Veilleux, S., & Baker, A. J. 2008, ApJ, 674, 172
- Salpeter (1955) Salpeter, E. E. 1955, ApJ, 121, 161
- Sanders et al. (2003) Sanders, D. B., Mazzarella, J. M., Kim, D.-C., Surace, J. A., & Soifer, B. T. 2003, AJ, 126, 1607
- Sliwa et al. (2014) Sliwa, K., Wilson, C. D., Iono, D., Peck, A., & Matsushita, S. 2014, ApJ, 796, L15
- Sliwa et al. (2012) Sliwa, K., Wilson, C. D., Petitpas, G. R., et al. 2012, ApJ, 753, 46
- Sliwa et al. (2013) Sliwa, K., Wilson, C. D., Krips, M., et al. 2013, ApJ, 777, 126
- Sturm et al. (2011) Sturm, E., González-Alfonso, E., Veilleux, S., et al. 2011, ApJ, 733, L16
- Torrey et al. (2012) Torrey, P., Cox, T. J., Kewley, L., & Hernquist, L. 2012, ApJ, 746, 108
- Tunnard et al. (2015) Tunnard, R., Greve, T. R., Garcia-Burillo, S., et al. 2015, ApJ, 815, 114
- van der Tak et al. (2007) van der Tak, F. F. S., Black, J. H., Schöier, F. L., Jansen, D. J., & van Dishoeck, E. F. 2007, A&A, 468, 627
- Vigroux et al. (1976) Vigroux, L., Audouze, J., & Lequeux, J. 1976, A&A, 52, 1
- Watson et al. (1976) Watson, W. D., Anicich, V. G., & Huntress, Jr., W. T. 1976, ApJ, 205, L165
- Wilson & Matteucci (1992) Wilson, T. L., & Matteucci, F. 1992, A&A Rev., 4, 1
- Zhang et al. (2014) Zhang, Z.-Y., Gao, Y., Henkel, C., et al. 2014, ApJ, 784, L31