arXiv:1704.06670
Status of the SuperNEMO 0 experiment
Cheryl Patrick and Fang Xie111On behalf of the SuperNEMO collaboration
Department of Physics and Astronomy
University College London, Gower St, London WC1E 6BT, UK
SuperNEMO is an ultra-low-background tracker-calorimeter experiment designed to look for the neutrinoless double-beta decay of various isotopes. We present the current state of the experiment’s Demonstrator Module, which is currently being installed and commissioned at the LSM in France.
PRESENTED AT
NuPhys2016, Prospects in Neutrino Physics
Barbican Centre, London, UK, December 12–14, 2016
1 Introduction
Double-beta decay (), in which two neutrons decay simultaneously inside a nucleus, ejecting two electrons and 2 electron antineutrinos, has been observed in several isotopes. However, if neutrinos are Majorana particles, it should be possible for a double-beta decay to occur with no neutrinos in the final state. These events can be distinguished from decays by summing the energies of the two beta electrons: for , the electrons will carry the full decay energy , while for events, the summed electron energies will form a continuum up to .
SuperNEMO [1] has been designed to study double-beta decays, and in particular, to look for decays, which have never been observed. It builds on the design principles of its predecessor, NEMO-3 [2], with an ultra-low-background tracker-calorimeter architecture, allowing us both to measure electron energies and to fully reconstruct particle tracks to identify events.
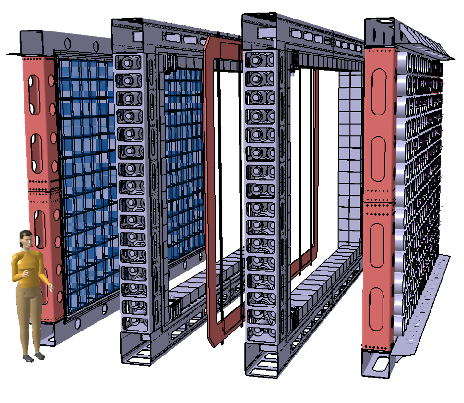
The SuperNEMO Demonstrator Module (figure 1) has a layered design, with foils of emitter sandwiched between tracker modules, surrounded by calorimeter walls. Initially, the source isotope will be 7kg of 82Se, mixed in a PVA base to create thin foils, suspended from the source foil frame. The modular design allows us to change these foils to study other isotopes.
The tracker, constructed in four C-shaped sections, consists of 2034 3-metre long drift cells operating in Geiger mode, arranged in rows of nine cells on each side of the source foil. Each cell comprises a central anode wire surrounded by 12 field-shaping wires, with copper cathode end caps at either end. When a charged particle crosses the cell, the anode signal timing tells us the distance from the anode wire, while the relative timings of the cathode signals give a position along the wire, allowing three-dimensional reconstruction.
The two calorimeter walls, situated outside the tracker, consist of 520 optical modules; 8-inch radiopure PMTs coupled to polystyrene scintillator blocks wrapped in teflon and mylar, with individual iron shielding. Lower-resolution optical modules around the edges of the tracker (giving a total of 712 modules) offer acceptance.
In its initial running period of 2.5 years, the Demonstrator Module will have a sensitivity to the half-life of years, corresponding to a Majorana neutrino mass meV. A proposed 20-module full SuperNEMO detector with an exposure of 500 kg years (5 years, 100 kg of 82Se) would improve our sensitivity to years ( meV).
2 Tracker and calorimeter installation at LSM
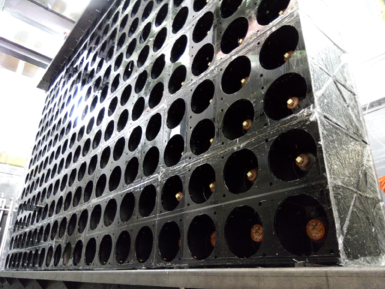
The optical modules have all been built, and in 2016, the two outer calorimeter walls (figure 2(a)) were assembled at the Laboratoire Souterrain de Modane (LSM), in the Fréjus road tunnel in France. The four C-shaped tracker sections were constructed and commissioned in the UK, and by December 2016, all four had been shipped to LSM. The first two C-sections have been joined together (figure 2(b)) and coupled to the first calorimeter wall, forming half of the Demonstrator Module. In situ commissioning of this half detector commenced in February 2017. In the following months, the source frame will be shipped to LSM and installed in the middle of the detector, allowing the full Demonstrator Module to be coupled together and commissioned.
3 Radon mitigation strategy
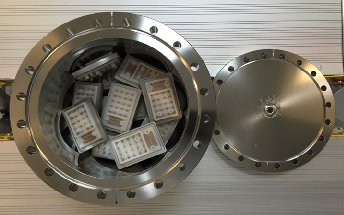
One of the largest backgrounds is due to radon, as decays of its daughter isotope 214Bi can mimic events in our detector. To protect against this, stringent radiopurity requirements are imposed both on materials used in and around the detector, and on the gas in the tracking chamber. To measure the activity of detector components, we leave them in an emanation chamber (figure 3(a)) for two weeks, then measure the activity with an electrostatic detector similar to [3]. To reach SuperNEMO’s target sensitivity, the radon activity in the tracker gas must be below 0.15 mBq/m3. As our electrostatic detector is only sensitive to 1 mBq/m3, we flow tracker gas through a Radon Concentration Line (RnCL) [4], capturing any radon in a carbon trap. Measuring the activity of the concentrated gas from the trap lets us calculate tracker activities as low as Bq/m3. Our measurements indicate that, in order to meet the 0.15 mBq/m3 requirement, we need to flow gas through the Demonstrator Module tracker at the reasonable rate of 2 m3/hour.
4 Gas system automation
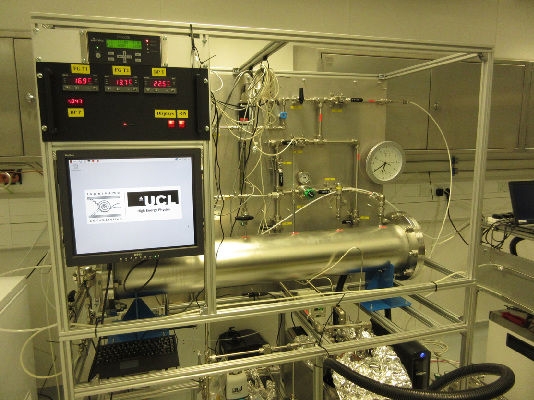
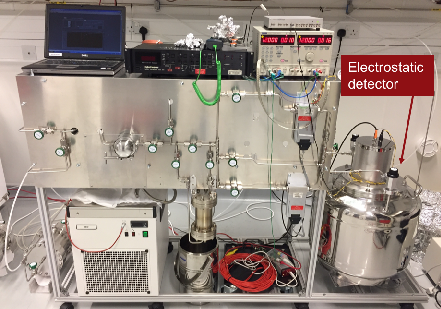
The tracker is filled with a mixture of 95% helium, 4% ethanol, and 1% argon. The gas system (figure 4) includes mass flow controllers and a pair of ethanol bubblers used to adjust the gas fractions. A RaspberryPi connected to the slow control system tracks the pressure and temperature in the bubblers and the gas flow rate, and provides alarms and real-time monitoring via a user interface.
5 Software and analysis
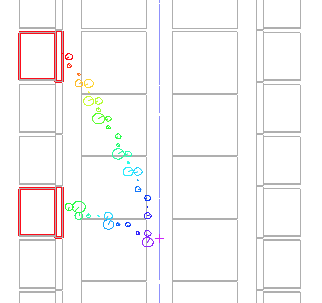
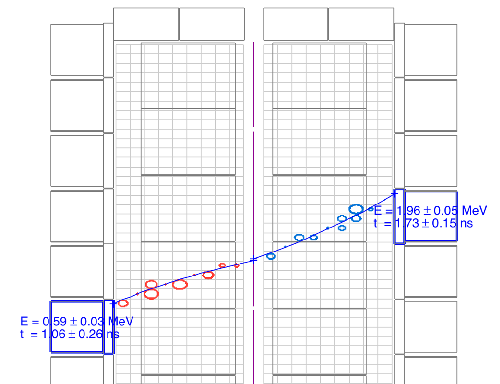
SuperNEMO’s simulation and reconstruction software have been used to perform sensitivity studies, confirming initial predictions, and to evaluate the effects of potential sources of background contamination. The event display (figure 5), which visualises and displays information about simulated and reconstructed calorimeter hits, has allowed us to study how signal and background events will present themselves in the detector, enabling us to improve our event selection.
6 Conclusion
SuperNEMO’s Demonstrator Module is currently being installed and commissioned at LSM, and will begin taking data in 2017. A stringent radon mitigation strategy gives us ultra low backgrounds, with a projected Majorana mass sensitivity of 200-400 meV in 2.5 years of running.
ACKNOWLEDGEMENTS
References
- [1] R. Arnold et al., Eur. Phys. J. C 70, 927 (2010).
- [2] R. Arnold et al., Nucl. Inst. Meth. A536, 79-122 (2005).
- [3] E. Choi et al., Nucl. Inst. Meth. A459,177-181 (2001)
- [4] X. Liu and J. Mott, JPCS 598, 012022 (2015)