PHENIX results on multiparticle correlations in small systems
Abstract
We present measurements of 2- and 4-particle correlations in d+Au collisions at four different center-of-mass energies: 200, 62.4, 39, and 19.6 GeV. The data were collected in 2016 by the PHENIX experiment at RHIC. The second Fourier coefficient of the particle azimuthal distributions is measured using the Q-cumulant method as a function of event multiplicity. The results give a strong indication of collective behavior down to the lowest energy.
keywords:
1 Introduction
The study of collective behavior in small systems, like p+Pb at the LHC and d+Au at RHIC, is one of the major pillars of heavy-ion physics research. Measurements of collectivity in small systems are testing the limits of collectivity and the applicability of hydrodynamics. In 2016, RHIC delivered a beam energy scan of d+Au collisions at four different collisions energies: 200 GeV, 62.4 GeV, 39 GeV, 19.6 GeV. Table 1 shows the number of events analyzed for each collision energy. We used a central trigger that greatly enhanced the high multiplicity data sample.
| d+Au collision energy | total events analyzed | central events analyzed |
|---|---|---|
| 200 GeV | 636 million | 585 million |
| 62.4 GeV | 131 million | 76 million |
| 39 GeV | 137 million | 49 million |
| 19.6 GeV | 15 million | 3 million |
Measurements of multiparticle correlations in small systems at the LHC (see e.g. Reference [1, 2, 3]) are considered very strong evidence for collective behavior, as by mathematical construction they reduce contributions from few particle correlations like resonance decays, quantum correlations, Coulomb interactions, momentum conservation effects, etc, generally referred to as non-flow. In this proceedings, we present PHENIX results on multiparticle correlations in the 2016 d+Au beam energy scan. We will also present results from simulations using A Multi-Phase Transport model (AMPT) [4] to aid interpretations of the data as needed.
2 Analysis
The azimuthal distribution of particles produced in a heavy-ion collision can be described with a Fourier expansion with coefficients [5]. In this analysis we focus on the second harmonic coefficient . To study multiparticle correlations, we use the Q-cumulant method [6]. To briefly summarize the salient features, the 2-particle cumulant can be described as and the 4-particle cumulant can be described as , where the brackets indicate an average over events. The harmonic coefficients can be determined as and . The individual components can be obtained from and , where and are 2- and 4-particle correlators averaged over all particles in a single event (calculated using Q-vectors), which are then averaged over events to obtain and .
Since neither nor measure directly, they are subject to fluctuations in the distribution. Generally we have and [7], where is the variance of the distribution. We also expect fewer particle correlations to be more subject to non-flow, so that [7], where parameterizes the non-flow contribution. In this way, the study of correlations with different numbers of particles can potentially elucidate the relationship between , the fluctuations, and the non-flow effects.
We use the PHENIX forward vertex (FVTX) detector for this analysis. The FVTX has a nominal pseudorapidity coverage of . Reconstructed tracks are required to have hits and at least 3 of the 4 layers and to have a distance of closest approach to the vertex of 2 cm. Events with a collision vertex of 10 cm are selected. We plot all quantities as a function of the number of reconstructed tracks, .
3 Results
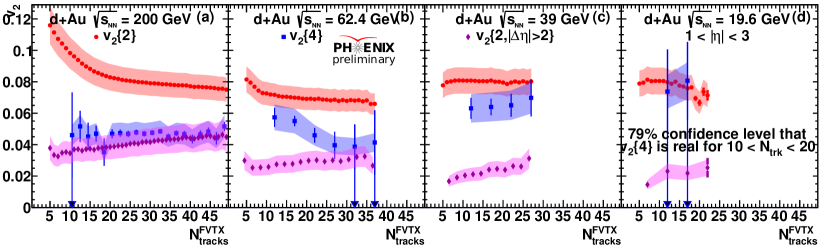
Figure 1 shows in red points and in blue points as a function of in d+Au collisions at 200 GeV (panel a), 62.4 GeV (panel b), 39 GeV (panel c), and 19.6 GeV (panel d). We observe real valued at all four energies (albeit with 79% confidence interval for the 19.6 GeV). Additionally, we observe that although for all energies, the difference decreases as the collision energy decreases. This result may be regarded as surprising, because naively it would appear to indicate that the variance of the distribution is decreasing significantly with decreasing collision energy (we note that there are other possibilities, beyond the scope of these proceedings).
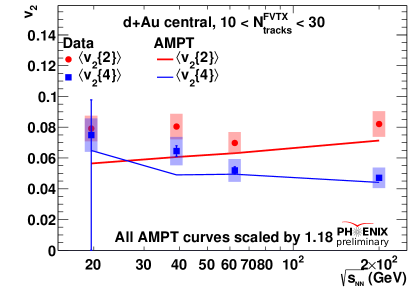
Because AMPT has had significant success in describing collective observables in both large and small systems, we can check if AMPT shows a similar trend. Figure 2 shows and as a functions of collision energy . The data are shown in points and the AMPT results are shown as lines. The analysis of the AMPT simulations is done in exactly the same way as for the real data, including and especially the pseudorapidity selection, to ensure a homogeneous comparison. It can be seen that AMPT reproduces this trend. The AMPT simulations are scaled by a factor of 1.18 to account for the dependence of the FVTX efficiency.
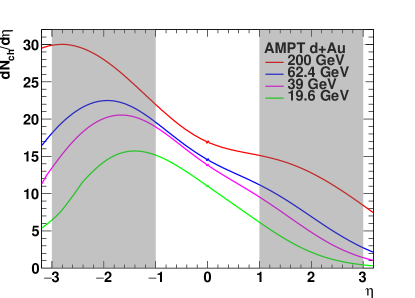
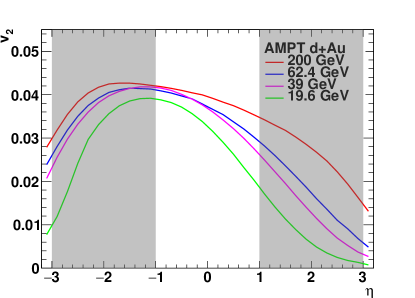
To try to assess how the interplay of fluctuations and non-flow effects influence the relationship between and , we can also look at 2-particle with a pseudorapidity gap to reduce the non-flow. Figure 1 also shows , where indicates that the minimum pseudorapidity separation (gap) is 2 units. To achieve this pseudorapidity gap, we require one particle to be in the south (backward pseudorapidity) arm of the FVTX and the other to be in the north (forward pseudorapidity) arm. We find that for all four energies, with the difference increasing as the collision energy decreases. This can be understood as arising from the fact that and are weighted averages of the backward pseudorapidity and the forward pseudorapidity whereas the gives equal weight to each, . In asymmetric collisions, [8] and [9] are larger at backward pseudorapidity. As an illustrative example, Figure 3 shows AMPT simulations of (left panel) and (right panel) as a function of . Based on this alone, we can plausible expect . However, it is likely that longitudinal decorrelations [10] play a role in further reducing , where we have something like , where and indicate the 2nd harmonic event planes at backward and forward pseudorapidity, respectively.
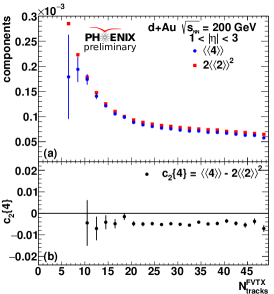
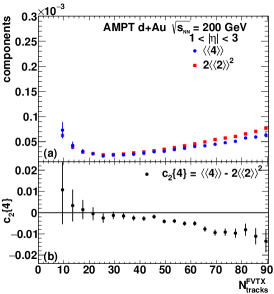

To corroborate the interpretation of real valued as indicative of collective behavior, Figure 4 shows the individual components and (upper panels) and the cumulant (lower panels) in the data (left plot), AMPT (middle plot), and AMPT with no scattering (right plot). When turning off the scattering, the transport from initial geometry to final state interactions doesn’t take place, so that only non-flow effects remain. Comparing the middle plot and the right plot, the case with scattering shows a negative , meaning real-valued , whereas the case without scattering shows a that’s near zero but positive, indicating complex-valued .
4 Summary
In summary, we have presented measurements of multiparticle correlations in d+Au collisions at 200, 62.4, 39, and 19.6 GeV. We find real-valued for all energies, providing strong evidence of collective behavior in small systems at RHIC energies down to the lowest energies.
References
- [1] G. Aad, et al., Measurement with the ATLAS detector of multi-particle azimuthal correlations in p+Pb collisions at =5.02 TeV, Phys. Lett. B725 (2013) 60–78. arXiv:1303.2084, doi:10.1016/j.physletb.2013.06.057.
- [2] S. Chatrchyan, et al., Multiplicity and transverse momentum dependence of two- and four-particle correlations in pPb and PbPb collisions, Phys. Lett. B724 (2013) 213–240. arXiv:1305.0609, doi:10.1016/j.physletb.2013.06.028.
- [3] B. B. Abelev, et al., Multiparticle azimuthal correlations in p-Pb and Pb-Pb collisions at the CERN Large Hadron Collider, Phys. Rev. C90 (5) (2014) 054901. arXiv:1406.2474, doi:10.1103/PhysRevC.90.054901.
- [4] Z.-W. Lin, C. M. Ko, B.-A. Li, B. Zhang, S. Pal, A Multi-phase transport model for relativistic heavy ion collisions, Phys. Rev. C72 (2005) 064901. arXiv:nucl-th/0411110, doi:10.1103/PhysRevC.72.064901.
- [5] S. Voloshin, Y. Zhang, Flow study in relativistic nuclear collisions by Fourier expansion of Azimuthal particle distributions, Z.Phys. C70 (1996) 665–672. arXiv:hep-ph/9407282, doi:10.1007/s002880050141.
- [6] A. Bilandzic, R. Snellings, S. Voloshin, Flow analysis with cumulants: Direct calculations, Phys. Rev. C83 (2011) 044913. arXiv:1010.0233, doi:10.1103/PhysRevC.83.044913.
- [7] J.-Y. Ollitrault, A. M. Poskanzer, S. A. Voloshin, Effect of flow fluctuations and nonflow on elliptic flow methods, Phys. Rev. C80 (2009) 014904. arXiv:0904.2315, doi:10.1103/PhysRevC.80.014904.
- [8] B. Alver, et al., Phobos results on charged particle multiplicity and pseudorapidity distributions in Au+Au, Cu+Cu, d+Au, and p+p collisions at ultra-relativistic energies, Phys. Rev. C83 (2011) 024913. arXiv:1011.1940, doi:10.1103/PhysRevC.83.024913.
- [9] J. Velkovska, Phenix results on elliptic and triangular flow in d+au collisions from 19.6 to 200 gev, These proceedings.
- [10] K. Xiao, F. Liu, F. Wang, Event-plane decorrelation over pseudorapidity and its effect on azimuthal anisotropy measurements in relativistic heavy-ion collisions, Phys. Rev. C87 (1) (2013) 011901. arXiv:1208.1195, doi:10.1103/PhysRevC.87.011901.