H i, star formation and tidal dwarf candidate in the Arp 305 system
Abstract
We present results from our Giant Metrewave Radio Telescope (GMRT) H i observations of the Arp 305 system. The system consists of two interacting spiral galaxies NGC 4016 and NGC 4017, a large amount of resultant tidal debris and a prominent tidal dwarf galaxy (TDG) candidate projected within the tidal bridge between the two principal galaxies. Our higher resolution GMRT H i mapping, compared to previous observations, allowed detailed study of smaller scale features. Our H i analysis supports the conclusion in Hancock et al. (2009) that the most recent encounter between the pair occurred 4 108 yrs ago. The GMRT observations also show H i features near NGC 4017 which may be remnants of an earlier encounter between the two galaxies. The H i properties of the Bridge TDG candidate include: 6.6 108M⊙ and VHI = 3500 7km s-1, which is in good agreement with the velocities of the parent galaxies. Additionally the TDG’s H i linewidth of 30 km s-1 and modest velocity gradient together with its SFR of 0.2 M⊙ yr-1 add to the evidence favouring the bridge candidate being a genuine TDG. The Bridge TDG’s Spitzer 3.6 m and 4.5 m counterparts with a [3.6]–[4.5] colour -0.2 mag suggests stellar debris may have seeded its formation. Future spectroscopic observations could confirm this formation scenario and provide the metallicity which is a key criteria for the validation for TDG candidates.
keywords:
galaxies: spiral - galaxies: interactions - galaxies: kinematics and dynamics - galaxies: individual: Arp 305 - radio lines: galaxies - radio continuum: galaxies galaxies: tidal dwarfs1 Introduction
Interactions between gas rich galaxy pairs, can result in massive H i stripping from the parent galaxies’ H i disks (e.g., Duc et al., 1997; Duc et al., 2000; Smith et al., 2007, 2010; Sengupta et al., 2015). Much of this stripped H i may fall back into the gravitational potential of either of the pair or, at later stages, the new merged galaxy or be incorporated into the intra–group medium (IGM). Under the right conditions new star formation may arise within the evolving H i debris (Hibbard et al., 2005; Neff et al., 2005; Smith et al., 2010; de Mello et al., 2012; Torres-Flores et al., 2012). If the cold gas (H i and molecular gas) densities are sufficient and environmental conditions are favourable, the evolution of the cold gas and stellar debris may include the formation of self–gravitating bodies with masses typical of dwarf galaxies, known as Tidal Dwarf Galaxies (TDG) (Duc & Mirabel, 1999; Duc et al., 2000; Smith et al., 2007, 2010). H and UV emission trace star formation on timescales of 107 yr and 108 yr respectively (Boselli et al., 2009). So, if a TDG has an H i counterpart and it has stellar populations formed later than the time when its parent galaxies began interacting, this can provide evidence for in-situ star formation. Cases where a TDG forms from pure gas collapse, as opposed to gas collapse promoted by the gravitational potential of stellar debris from the parents, can be considered as a separate class of TDG (Duc et al., 2004). Interacting pairs thus provide a unique laboratory to study the impact of interactions on the gaseous and the stellar components of the parent galaxies as well as the conditions under which neutral gas debris collapses to form star clusters and TDGs.
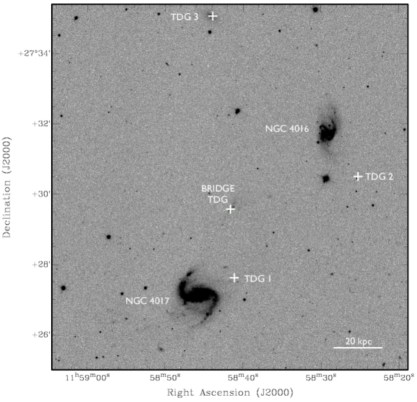
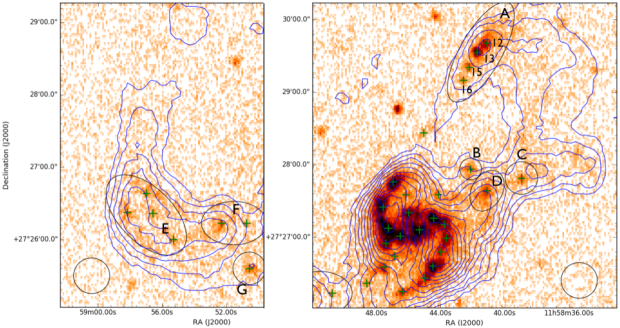
Arp 305 is an interacting pair of galaxies (NGC 4016 and NGC 4017) with a M∗ ratio of 1:3 and heliocentric optical radial velocities111 From Hyperleda (Makarov et al., 2014). of 3441 km s-1 and 3449 km s-1 respectively. Further basic properties of the pair are set out in Table 1. NGC 4016 and NGC 4017 are part of a small group of 5 galaxies (USGC U435) with its centre projected at 11:58:17.8 +27:47:03 with a radial velocity of 3456 km s-1 (Ramella et al., 2002). The group velocity dispersion is 106 km s-1. The closest member of the group is projected 22 arcmin (341 kpc) north of Arp 305. At optical and UV wavelengths, the Arp 305 pair displays clear signatures of a tidal interaction. These signatures include a figure of eight shaped inner disk in NGC 4016, enhanced spiral arms in NGC 4017 and a tidal bridge remnant projected between the pair (Figure 1) as well as four TDG candidates (Hancock et al., 2009).
A previous H i mapping of Arp 305 by van Moorsel (1983) with the Westerbork Synthesis Radio Telescope (WSRT) detected H i in both members of the pair and indicated they are at an early stage of a wet merger. Hancock et al. (2009) used UV (GALEX) observations to identify 45 young star forming clumps, including clumps within the four TDG candidates (see Figure 1). The “Bridge TDG” candidate corresponds to the UV clumps 12, 13,15 and 16 in Figure 2 of Hancock et al. (2009), with TDG1, TDG2 and TDG3 correspond to UV clumps 11, 1, and 19 respectively in the same figure.
In this paper, we present results from our Giant Metrewave Radio Telescope (GMRT) H i observations of the Arp 305 system. These observations have a higher spatial and velocity resolution than the previous WSRT H i observations (van Moorsel, 1983) allowing the detailed study of small scale H i morphology and kinematic features within the Arp 305 system, and in particular the star forming regions. This paper also utilises the Sloan Digital Sky Survey SDSS, Spitzer and Galaxy Evolution Explorer (GALEX) publicly available archive data and images. Section 2 sets out details of our observations, with observational results given in section 3. We discuss the results in section 4. A summary and concluding remarks are set out in section 5. Using the average heliocentric velocity of the two principal galaxies from Hyperleda and assuming H0 to be 68 km s-1 Mpc-1(Planck Collaboration et al., 2014), we adopt a distance of 50 Mpc for NGC 4016 and NGC 4017 and the TDGs. At this distance the spatial scale is 14.5 kpc/arcmin. These values are comparable to those used by Hancock et al. (2009) and Smith et al. (2010). J2000 coordinates are used throughout the paper, including in the figures.
| Property222All data are from NED, except Vradial(optical) and Inclination which are from Hyperleda. | Units | NGC 4016 | NGC 4017 |
|---|---|---|---|
| Vradial(optical) | [km s-1] | 34411 | 34492 |
| RA | [h:m:s] | 11:58:29.02 | 11:58:45.67 |
| DEC | [d:m:s] | +27:31:43.62 | +27:27:08.79 |
| Distance333See section 1. | [Mpc] | 50 | 50 |
| D25 major /minor | [arcmin] | 1.5 x 0.8 | 1.8 x 1.4 |
| D25 major /minor | [kpc] | 21.8 x 11.6 | 26.1 x 20.3 |
| Inclination | [∘] | 59.8 | 48.2 |
| Morphology | SBdm | SABbc | |
| BT | [B band mag] | 14.54 0.13 | 14.340.13 |
| Stellar mass | [1010 M⊙] | 0.6 | 2.7. |
2 Observations
H i observations of Arp 305 were carried out with the GMRT on July 12th, 2014. A baseband bandwidth of 16 MHz was used for the H i 21-cm line observations. The resultant velocity resolution was 7 km s-1. Further details of the observations are given in Table 2.
The Astronomical Image Processing System (AIPS) software package was used to reduce the data. Data from malfunctioning antennas, low gain antennas and/or antennas suffering from radio frequency interference (RFI) were flagged. The flux density calibration scale used was Baars et al. (1977), with flux density uncertainties 5%. After calibration, the uv domain continuum subtraction was carried out using the AIPS task uvlin. The task imagr was then applied to the visibilities to ‘clean’ and transform them into H i image cubes. The integrated H i, H i velocity field and velocity dispersion maps were made applying the AIPS task momnt on the H i cubes. To analyse the detailed H i morphology and kinematics, images with different resolutions were produced by applying different ‘tapers’ to the data with varying uv limits. Details of the final low and high resolution map properties are given in Table 2.
| Frequency | 1420.4057 MHz |
| Observation Date | 12th July, 2014 |
| Primary calibrator | 3C147 |
| Phase calibrator | 1120+143 (2.42 mJy) |
| (flux density) | |
| Integration time | 10.0 hrs |
| primary beam | 24′ at 1420.4057 MHz |
| Low resolution beam | 31.8′′ 29.5′′ (PA = -0.8∘) |
| High resolution beam | 14.3′′ 11.8′′ (PA = 27.8∘) |
| rms for low resolution map | 1.2 mJy beam-1 |
| rms for high resolution map | 0.6 mJy beam-1 |
| RA (pointing centre) | 11h 58m 37.4s |
| DEC (pointing centre) | 27∘ 29′ 26′′.9 |
3 Observational Results
3.1 H i morphologies and mass estimates
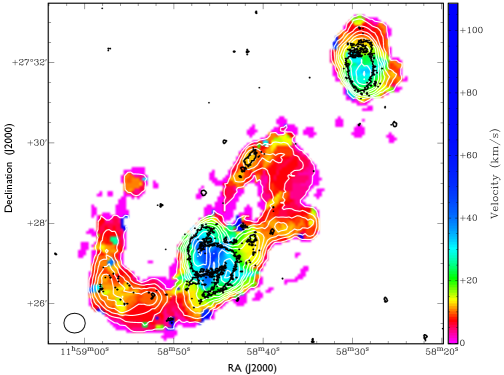
Figure 2 shows the contours from the GMRT low resolution (31.8′′ 29.5′′) integrated H i map for the Arp 305 field overlaid on a FUV (GALEX) image. The bulk of the H i is detected in NGC 4017, with significant amounts of its H i detected at lower column densities (0.5 – 4.3 1020 cm-2) in an extended south eastern (SE) tidal tail and a broad area north (N) and Northwest (NW) of the optical disk. We refer to H i column densities as ‘lower’ or ‘higher’ with respect to the H i column density threshold of 4 1020 atoms cm -2 for star formation, as estimated by Maybhate et al. (2007).
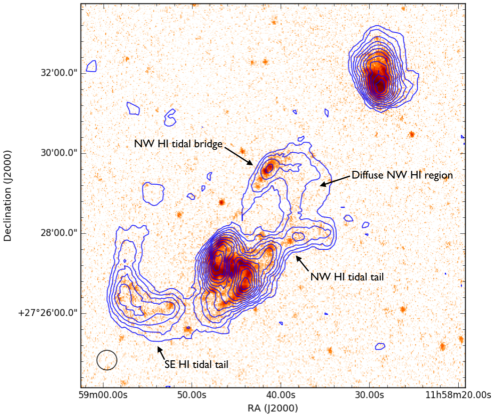
To a first order the morphologies and the peak H i column densities of both members of the Arp 305 pair in the GMRT low resolution (synthesised beam 31.8′′ 29.5′′) and lower resolution WSRT (van Moorsel, 1983) (synthesised beam 45′′ 60′′) H i maps are similar. Although it is evident from a comparison of the GMRT and WSRT H i morphologies that the GMRT has suffered some flux loss due to a lack of short spacing baselines. For NGC 4016, Figure 2 shows its H i is truncated in the south to approximately the optical disk radius with the H i column densities rising rapidly toward the column density maximum. In the north the H i disk extends beyond the optical disk. No H i counterparts to TDG 2 and TDG 3 were detected by the GMRT. In the case of NGC 4017, Figure 2 shows massive extended H i tidal tails SE and NW of the galaxy’s FUV disk. The SE tidal tail (henceforth the “SE H i tidal tail”) contains high column density H i, within which are projected several star forming (SF) clumps detected in UV. North (N) and NW of the NGC 4017 optical disk the H i morphology is more complex. Figure 2 shows it contains two elongated H i structures of relatively high column density with FUV counterparts. The first structure is an H i extension, with a clumpy FUV counterpart, including TDG 1, running from the western edge of the optical/FUV disk to the NW (henceforth the “NW H i tidal tail”). The second prominent H i structure is the H i counterpart to the UV and optical tidal bridge remnant between NGC 4017 and NGC 4016, referred to from here on as the “ NW H i tidal bridge”. The Bridge TDG candidate is projected within the NW H i tidal bridge. Both of these large scale H i structures, also visible in the WSRT map, are embedded within a much more extensive lower H i column density region, which in the WSRT map extends 1.5 arcmin (22 kpc) further north than in GMRT map, almost connecting to the NGC 4016 H i disk. This region is referred to as the “diffuse NW H i region”. Properties of the two principal galaxies and the TDG candidates, including their GMRT H i masses as well as their velocities and W20 line widths, are set out in Table 3.
Comparing the H i masses for NGC 4016 and NGC 4017 derived from the GMRT, to their literature H i flux densities is complicated by the following factors: (i) there are conflicting H i flux densities reported in the literature for the galaxies from several single dish and a single WSRT interferometric observation (van Moorsel, 1983) (ii) the close proximity of NGC 4016 and NGC 4017 and large single dish beam sizes mean H i emission is likely to be partially confused within the single dish beams. Only the GMRT and WSRT H i maps resolve NGC 4016 and NGC 4017 into discrete H i entities. (iii) It is difficult to accept that the WSRT flux calibration was accurate because the 1.4 GHz WSRT radio continuum flux density for NGC 4016 was 1.5 times the NRAO VLA Sky Survey (NVSS) value but for NGC 4017 the WSRT radio continuum flux density is similar to NVSS value. (iv) as noted above, comparison of the WSRT and GMRT H i maps indicates the GMRT observation did suffer some flux loss. Below we compare the GMRT and literature H i flux densities values for NGC 4016 and NGC 4017.
The GMRT integrated H i flux density (S) for NGC 4016 was S = 5.0 Jy km s-1 compared to S = 7.5 Jy km s-1 from the van Moorsel (1983) WSRT H i mapping. Single dish flux density measurements for NGC 4016 have been reported: S = 10.05 Jy km s-1 using the 305 m Arecibo telescope (Haynes et al., 2011); and S = 8.1 Jy km s-1 from the Nançay radiotelescope (Theureau et al., 2007) and 6.2 Jy km s-1 from Arecibo telescope (Huchtmeier & Richter, 1989). The Nançay beam is quite large (FWHP 3.6 arcmin 22 arcmin at zero declination). Assuming the Nançay observation was centred on NGC 4016, the flux density derived in Theureau et al. (2007) would be contaiminated with emission from NGC 4017, with the severity depending on the size and orientation of the beam. Arecibo’s beam has a FWHP 3.5 arcmin. Haynes et al. (2011) note the H i emission detected with Arecibo at the position of NGC 4016 is “probably” blended with emission from NGC 4017 and their reported flux density for NGC 4016 is after “attempted” deblending. Since the H i flux values reported in the literature were so diverse, we compared our GMRT 20 cm radio continuum flux value of NGC 4016, (5.3 mJy 10%) with that from the NVSS (5.5 mJy 10%) as a check for our GMRT calibration. These matching continuum values indicate that our calibration is accurate and the literature H i flux densities which differ widely from the GMRT value for NGC 4016 cannot be accepted as reliable measurements.
For NGC 4017 the GMRT integrated interfrometric flux density is S = 8.5 Jy km s-1 compared to S = 25.8 Jy km s-1 from the WSRT (van Moorsel, 1983). In part the difference is attributable to the GMRT H i flux loss referred to above and the similarity of the peak H i column densities in the WSRT and GMRT maps are consistent with this. However, the NGC 4017 van Moorsel (1983) H i flux density (S = 25.8 Jy km s-1) is in good agreement with that derived by Haynes et al. (2011) from Arecibo single dish obervations. But, Haynes et al. (2011) note the possible blending of H i emission from NGC 4016. A significantly lower Arecibo based H i flux density for NGC 4017 of S = 16.8 Jy km s-1 is reported in Lewis et al. (1985). The NGC 4017 H i extent is greater than a single Arecibo 3.5 arcmin beam, thus requiring integration of the flux densities from multiple pointings. But neither Haynes et al. (2011) nor Lewis et al. (1985) state which beam areas were used to derive their reported NGC 4017 flux densities.
Compared to the GMRT H i flux density, the NGC 4017 flux densities from Haynes et al. (2011) and van Moorsel (1983) are about 3 times higher. While some flux loss is expected in GMRT data due to the lack of short baselines, the flux loss of 60% implied by the Haynes et al. (2011) and van Moorsel (1983) flux densities is much higher than expected, based on similar GMRT observations. Furthermore, the “expected” H i mass of a galaxy of NGC 4017’s size and Hubble type, based on a large sample of field galaxies and using the formula from Haynes & Giovanelli (1984) ( = 4.1 109 M⊙), is in good agreement the H i mass derived from the GMRT ( = 4.8 109 M⊙). The NGC 4017 H i mass derived from Haynes et al. (2011) and van Moorsel (1983) flux densities are also significantly higher than the H i mass derived from applying, the Tully–Fisher (TF) relations. Our stellar mass estimate for NGC 4017 of 3.0 1010 M⊙ agrees well with the stellar TF mass relation, based on an H i rotation velocity of 201 km s-1 (150 km s-1 from the rotating disk adjusted for inclination). But using the NGC 4017 H i flux density from Haynes et al. (2011) and assuming molecular mass = H i mass, gives a baryonic mass of 6.6 1010 M⊙, significantly greater than the barionic mass for NGC 4017 from the TF baryonic mass relation (3.8 1010 M⊙). The TF baryonic mass relation is a tighter relation than the Stellar TF according to Torres-Flores et al. (2011). Hence the NGC 4017 H i mass from the “expected” and TF analysis are closer to those derived from the GMRT and Lewis et al. (1985) H i flux densities than those derivered from the Haynes et al. (2011) and van Moorsel (1983) flux densities. We conclude that the greater extent of the H i detection in the van Moorsel (1983) map clearly shows the GMRT data is missing some flux. But large uncertainties about reliability of the flux densities in the literature prevent us from quantifying the amount of this loss. Analysis in this paper however concentrates on the relatively compact, high–density H i star forming zones where flux loss should not affect any of our results significantly.
| Object | RA | Dec | Velocity444From GMRT. | W20 a | 555M(H i) for NGC 4016 and NGC 4017 are derived from the GMRT flux densities. But see the caveats for the H i flux densities measured from GMRT as well as those found in the literature in section 3.1. For the Bridge TDG the H i mass was calculated as per section 4.3. The other H i detected candidate, TDG 1, is small UV clump and embedded in a much larger mass of H i debris close to the NGC 4017 disk. Its H i mass was not estimated due to the high uncertainties in its extent and the corresponding flux density. | M∗ c | FUV clumps666From Table 5 in Hancock et al. (2009), except for the M∗ masses of NGC 4016 and NGC 4017 which were calculated using the method from Bell et al. (2003) and parameters from Blanton et al. (2003) based on the galaxies’ SDSS r –band magnitudes and r-i colours. |
| [h:m:s] | [d:m:s] | [km s-1] | [km s-1] | [ 109 M⊙] | [ 106 M⊙] | ||
| Arp 305 pair: | |||||||
| – NGC 4016 | 11:58:29.0 | +27:31:44 | 34547 | 1307 | 3.0 | 10400 | 1 to 10 |
| – NGC 4017 | 11:58:45.7 | +27:27:09 | 34397 | 2587 | 5.0 | 33900 | 11, 14, 17, 18, 20 to 45 |
| Bridge TDG candidate | 11:58:42.22 | +27:29:20.44 | 35007 | 307 | 0.66 | 1-7 | 12,13, 15,16 |
3.2 H i kinematics
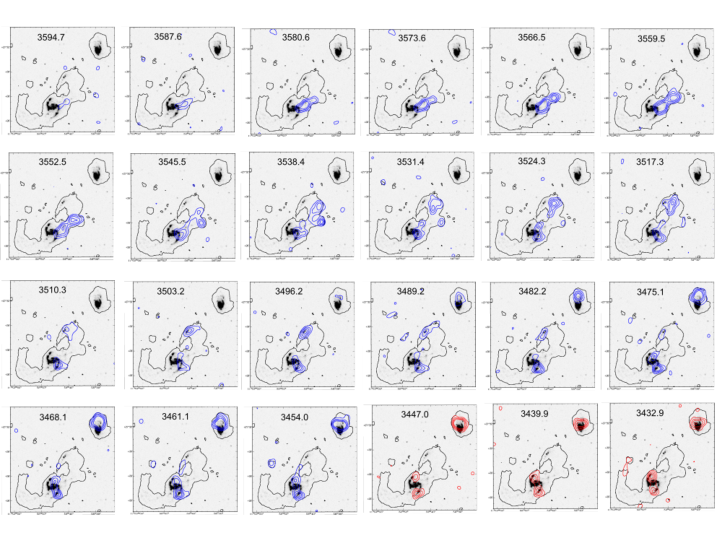
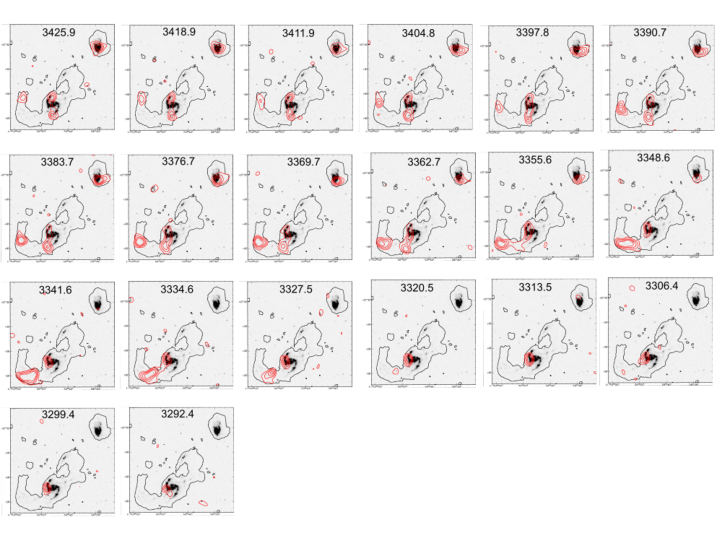
Figure 4 shows the low resolution ( 30′′) intensity weighted velocity field of the Arp 305 system, with iso–velocity contours separated by 7 km s-1. For NGC 4016, H i emission is detected in the channel maps (Figures 8 and 9) within a velocity range 3348 km s-1 to 3496 km s-1. The NGC 4016 iso–velocity contours (Figure 4) indicate reasonably regular rotation in the H i disk, with a north-south (N–S) kinematic axis. The closed iso–velocity contours at the H i disk edges indicate the disk is warped with the velocity gradient becoming progressively shallower towards the north. NGC 4016 has a GMRT VHI = 34547 km s-1, with W20 1307 km s-1, close to the W50 13315 km s-1 from the single dish on–line data from Haynes et al. (2011).
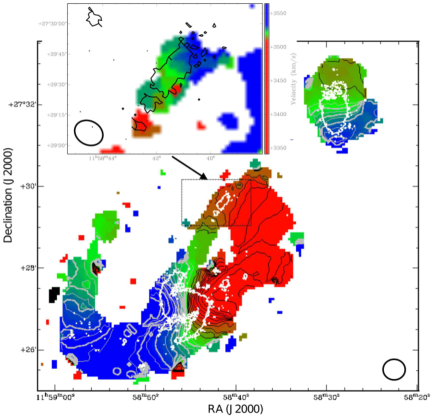
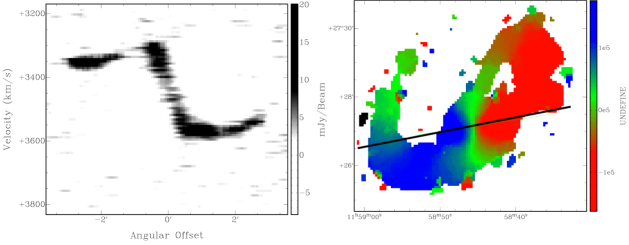
In the channel maps (Figures 8 and 9) H i emission is detected for NGC 4017 in the velocity range 3292 km s-1 to 3595 km s-1. Its GMRT VHI = 3439 7 km s-1 agrees well with the heliocentric optical radial velocity for NGC 4017 (34492 km s-1). The GMRT W20 = 2587km s-1 is also similar to the W50 = 2535 km s-1 from single dish on–line data (Haynes et al., 2011). The NGC 4017 iso–velocity contours in the H i velocity field (Figure 4) also show a fairly regular rotation pattern (PA = 111∘). A position velocity (PV) diagram for a cut along the NGC 4017 major axis (Figure 6), shows the H i line centre to be 3447 7 km s-1 and maximum rotation velocity to be 150 7 km s-1 (before inclination correction). Two structures in the NGC 4017 PV diagram (see Figure 6 – right panel) with offsets +0.6 arcmin and -1.0 arcmin, respectively, are cuts through the SE and NW H i tidal tails. The velocities in the SE H i tidal tail, which in projection is an extension of the southern optical spiral arm, initially systematically decreases along the tail to a velocity 115 km s-1 below the NGC 4017 systemic velocity, at which position the projected direction begins changing northward. Beyond this position the H i tail velocities systematically increase reaching the NGC 4017 systemic velocity at the end of the H i tail. To the NW of NGC 4017, from the base of the NW H i tidal tail the H i velocities increase systematically along the NW H i tidal tail all the way to the NW H i tidal bridge. Along the NW H i tidal bridge itself H i velocities decline systematically in the direction of NGC 4017. There is no clear kinematic break to distinguish the NW H i tidal tail, diffuse NW H i region and the NW H i tidal bridge. In fact the kinematic continuity from NW H i tidal tail though the diffuse NW H i region to NW H i tidal bridge is puzzeling. Modelling by Hancock et al. (2009) of the Arp 305 system predicts the NW tidal bridge, but the origin of the NW H i tidal tail and diffuse NW H i region is unclear. The authors attribute them to “material splashed out of the disks at closest approach”. However, in terms of H i mass, column density as well as kinematics, the NW H i tidal tail appears to be an equally unambiguous and robust structure as the NW H i tidal bridge.
Overall the H i morphology and kinematics for NGC 4017 suggest multiple H i structures in NGC 4017: (i) a regular rotating H i disk with a similar inclination to the optical galaxy (48∘) and PA 111∘; (ii) a SE H i tidal tail (iii) NW H i tidal tail (iv) the NW H i tidal bridge counterpart which is distinguishable by its local column density peak, although, not kinematically; and the extensive diffuse NW H i region which is not clearly distinguishable as a separate kinematic structure from the H i bridge or NW tidal tail.
4 Discussion
4.1 Interaction dynamics
In H i, Arp 305 shows strong tidal interaction signatures including, the SE H i tidal tail, NW H i tidal tail and NW H i tidal bridge. Arp 305 specific modeling for a prograde interaction by Hancock et al. (2009) predicted stellar counterparts to the SE H i tidal tail for NGC 4017 and the NW tidal bridge between the pair. Both tidal features are also predicted by generalised modelling of a late-type galaxy undergoing a prograde interaction with a minor companion (Oh et al., 2008). However, Arp 305 also exhibits extended H i debris (i.e., the NW H i tidal tail and the diffuse NW H i region) that are not predicted by either the Hancock et al. (2009) or Oh et al. (2008) models. The fact that these features are seen in H i and are bright in UV, but lack optical counterparts, suggests these features are young interaction debris. H i kinematic and morphology perturbations in the GMRT maps are more severe on the western side of the NGC 4017 disk, indicating NGC 4016’s closest approach occurred there. A possible explanation for the NW H i tidal tail is that it was H i tidally drawn out of the NGC 4017 disk during the pericentre approach of NGC 4016. Hancock et al. (2009) attributes this structure (NW H i tidal tail) to the material “splashed out” during NGC 4016’s closest approach. However, in terms of H i mass, column density as well as kinematics, the NW H i tidal tail is as well defined a structure as the NW H i tidal bridge. Additionally the diffuse NW H i region in the WSRT map, which is only partially recovered by the GMRT map, has an enormous extent. Also the continuous kinematic gradient from the NW H i tidal tail along the kinematic major axis of NGC 4017 (Figure 3) until it merges with the NW H i tidal bridge is inconsistent with the disturbed kinematics expected in “splashed out” debris. In the absence of a better model we of course cannot make any robust claim. Alternative explanations could be that (i) the NW H i tidal tail is a tidal feature attributable to the close approach of NGC 4016 on that side of the galaxy and (ii) at least part of the diffuse NW H i region is H i debris from an earlier encounter between the pair. Similar massive H i structures have been previously reported in M 51 type systems which could not be explained by modelling of a single encounter and were speculated to originate from multiple passage encounters (Howard & Byrd, 1990; Salo & Laurikainen, 1993).
Oh
et al. (2008) used simulations to study the enhancement of the spiral features and the duration of visibility in disk galaxies following an interaction with a perturber. The similarity in the baryonic masses of NGC 4017 ( 4.0 1010 M⊙) and the disk galaxy used in the Oh simulations ( 5.2 1010 M⊙) allows us to use the Oh
et al. (2008) model to understand the physical properties of NGC 4017 (acknowledging that the NGC 4017 orbital parameters are poorly constrained in comparison with the Oh simulations). To acess the strength of the tidal interaction between simulated galaxy pairs and understand interactions with , i.e., moderately strong interations, Oh
et al. (2008) used a tidal strength parameter:
= () ()3 () (their Eqn. 3). We can esitimate, for NGC 4017, the perturber to galaxy mass ratio () at 3, a typical value for interacting pairs with TDGs. For NGC 4017 we do not have any obervational constraint for the peri–centre to galaxy radius () ratio or the perturber angular speed relative to stars at the galaxy edge () . Additionally, the Oh
et al. (2008) simulations reveal that the tidal tails dissipate rapidly after reaching their visiblity maxiumum, 1.4 to 2.5 108 yr following the interaction. For S 0.3 interactions, the timescale for tail dissipation may extend to 1 Gyr and tail fragmentation may lead to TDG formation (Barnes, 1992; Oh
et al., 2008). Here, using the Oh models as well as other observational evidence, we make an effort to constrain the time since the most recent NGC 4017/NGC 4016 interaction. Following are our four sources of evidence (i) for galaxies with total baryonic masses of the order of NGC 4017, H i morphological perturbation signatures from a full merger only remain identifiable for a maximum of 4 108 yr to 7 108 yr (Holwerda
et al., 2011). We find the H i morphology in NGC 4017 to be strongly disturbed, i.e, well above the Holwerda H i merger signature threshold. Assuming H i perturbations from a full merger would be of a similar magntude to the pre–merger interaction observed in NGC 4017, it seems reasonable to conclude that the NGC 4017 perturbation occurred well within the Holwerda
et al. (2011) timescale upper limits; (ii) NGC 4016 and NGC 4017 have a projected separation of 372 arcsec (90 kpc). If we assume a separation velocity of 212 km s-1, i.e. twice the USGC U435 group velocity dispersion, it implies the time since their closest approach was 4.1 108 years; (iii) Using an inclination corrected rotational velocity of 201 km s-1 , the time for a single rotation777 Trot [Gyr]= 6.1478 r/ Vrot , where r = the optical radius [kpc] and Vrot= 0.5 V [km s-1]/ sin(i). of NGC 4017 is 0.6 109 yr. Following the Oh
et al. (2008) simulations, we make the assumption that the bridge was formed along an axis joining NGC 4016 to NGC 4017 at the time of their closest approach and this point of closest approach has since rotated and reached its current location. From the orientation of the system and its H i morphology and kinematics, it seems that the point of closest approach was the western edge of the NGC 4017 disk where the “splashed out” material is visible. Relative to the optical center in a SDSS g – band de–projected image888based on PA = 111∘ and inclination = 48.2∘ of NGC 4017, the western disk edge is offset by 262∘ in an anti–clockwise direction from the bridge. This implies that the NGC 4017 disk has rotated 262∘ since the bridge was formed and we estimate the time since the bridge was formed at 4 108 yr 999262∘/360∘ 0.6 109 yr = 4 108 yr; and (iv) A comparison of the optical morphology of NGC 4017 and the Oh
et al. (2008) simulations (their Figure 1), shows a good agreement around t = 0.3 and 0.4 Gyr. While the uncertainties for each of these timescales are large, they sort of indicate that the interaction took place within the last 4 108 yr. This timescale agrees well with the 3.8 108 yr from the Hancock et al. (2009) modelling. Even 4 108 yr after the most recent pericentre approach strong H i morphological and kinematic perturbation signatures from the interaction remain clearly observable. The prominent optical tidal features of NGC 4017 in this time frame is consistent with the Oh
et al. (2008) simulations. This together with the presence of TDG candidates support an agrument in favour of an 0.3 interaction.
4.2 Star formation and H i column densities
A rich array of star formation (SF) activity in Arp 305 is indicated by the emission detected in UV (GALEX) images. Extended areas of SF are detected in FUV beyond the optical disks of both NGC 4016 and NGC 4017 (Figure 2). Hancock et al. (2009) carried out a detailed study of SF in the tidal features of Arp 305 using UV (GALEX) data. Those authors identified 45 isolated SF clumps within the extragalatic tidal debris, including in four TDG candidates, see Tables 3 and 4 of Hancock et al. (2009). For NGC 4017 we explore the relationship between the Hancock extra–galactic FUV clumps and the H i debris in which they are projected, i.e., in the extended H i debris of the NW tidal tail, NW diffuse region and SE H i tidal tail as marked in Figure 3. Because of the GMRT’s lower spatial resolution ( 30′′) compared to ultraviolet data from GALEX ( 5′′), we study the aggregated star formation behaviour in each of the zones marked A to G in Figure 3. Table 4 sets out the H i column densities, SFR and FUV clumps within each SF region. As noted in section 3.1, extra–galactic tidal H i debris was detected at the projected positions of only two of the four TDG candidates. SF zones A and D correspond to the Bridge TDG and TDG 1 candidates respectively. Other SF zones projected within the H i debris are centrally concentrated star forming clumps (zones B, C and G) and zones of multiple small faint clumps (zones E and F).
| Zone | ID | SFR | H i column | FUV |
|---|---|---|---|---|
| density | clump101010From (Hancock et al., 2009). | |||
| [M⊙ yr-1] | [ 1020 cm -2] | |||
| A | Bridge TDG | 0.200 | 4.1 | 12,13, 15,16 |
| B | 0.009 | 1.7 | 14 | |
| C | 0.015 | 2.9 | 42 | |
| D | TDG 1 | 0.010 | 6.4 | 11 |
| E | 0.020 | 5.3 | 37,38, 43, 40 | |
| F | 0.011 | 4.1 | 39, 44 | |
| G | 0.009 | 0.5 | 36 |
Hancock et al. (2009) notes multiple strong star formation sites over an extensive area of the SE tidal tail region and their model of the Arp 305 interaction also predicts high gas densities in those strong star forming regions of the SE tidal tail. Indeed, apart from the main galaxy disks of NGC 4016/7, the SE tidal tail has highest GMRT H i column densities. However, total SFR in SE tidal tail (0.04 M⊙ yr-1) is an order of magnitude lower than in the Bridge TDG candidate (0.2 M⊙ yr-1). The SF zones (A to G) are projected within H i with column densities ranging from 0.5 to 6.4 1020 cm -2. However, the H i local maxima are not necessarily spatially correlated with the individual SF zones. It is worth mentioning here that several studies have been conducted in the past to ascertain the critical H i column density that triggers star formation in galaxies as suggested by Kennicutt (1989). Earlier studies, eg. Skillman et al. (1988), found the limit to be 1021 cm -2 (for a spatial resolution of 500 kpc). A more recent study in the outskirts of the main galaxy disks and tidal debris found the limit to be 4 1020 cm -2 over a spatial resolution of about 1 kpc (Maybhate et al., 2007). The spatial resolution plays a crucial role as the quoted H i column density values can change with the synthesised beam size. In the case of Arp 305, the spatial resolutions we reach are 7 kpc with the low resolution map and 3 kpc with the high resolution map. While this prevents us from drawing any firm conclusion about star formation, above or below the critical column density regions in the Arp 305 system, the wide range of H i column density regions hosting star formation in Arp 305 reaffirms that a critical H i column density may be a necessary criteria but not a sufficient one to initiate star formation (Begum et al., 2006).
Areas of higher velocity dispersion in the extragalactic H i debris in the GMRT H i velocity dispersion map (Figure 5) correlate well with the SF zones (A-G). For the SF zones projected within the SE and NW H i tidal tails and NW H i tidal bridge, the velocity dispersion values range between 10 km s-1 to 15 km s-1, higher than the usual 7 km s-1 to 8 km s-1 in the non–star forming areas of the extragalactic H i debris. Within the optical disks of the two galaxies, H i velocity dispersions are higher, 15km s-1 to 40 km s-1. This is consistent with Mullan et al. (2013) who found compact star clusters in H i tidal tails are preferentially located in H i regions with column densities 4.6 1020 cm -2 (1 kpc resolution) and the highest H i velocity dispersions. Mullan et al. (2013) also argues higher H i velocity dispersion is a condition for SF in the tidal tails, rather than consequence of the SF. The star formation rates (SFR), estimated from the FUV fluxes (Hancock et al., 2009) for the SF zones A to G are 0.2, 0.009, 0.015, 0.010, 0.020, 0.011 and 0.009 M⊙ yr-1, respectively. The highest SFR in zone A contains the bright star forming Bridge TDG candidate, consisting of four strong SF clumps. The Bridge TDG candidate is discussed further in section 4.3.
4.3 Arp 305 Bridge TDG candidate
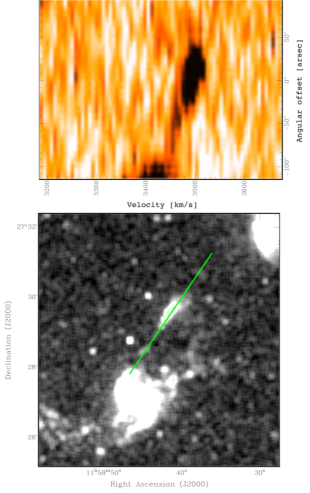
Validation of a TDG candidate usually requires a combination of evidence linking the candidate to the interaction between its parents, its metallicity, its stellar population and gas disk rotation signatures from H i, CO or H velocity fields. The Bridge TDG candidate emits strongly at ultraviolet (UV) wavelengths and has one of bluest FUV – g colours (0.25) amongst TDGs in the TDG sample studied by Schechtman-Rook & Hess (2012), indicating strong recent SF. Within the NW H i tidal bridge the H i column density maximum in the low resolution map (4.1 1020 atoms cm-2) is projected at the position of the UV clumps 12 and 13 from Hancock et al. (2009), Figure 3 – right panel. An H i spectrum for the Bridge TDG was extracted from the low resolution cube, centred on its H i column density maximum, which includes the projected positions of the four Hancock UV clumps (numbered 12, 13, 15 and 16). This spectrum provides an upper limit for the H i mass of the Bridge TDG ( 6.6 108 M⊙). The velocity field and a PV diagram cut from the low resolution cube, taken along “tidal bridge ” major axis (Figure 7) shows H i detected in the range of 3475 – 3520 km s-1 with a modest gradient and velocities increasing in the NW direction. The Bridge TDG’s VHI = 35007km s-1 is in good agreement with the velocities of the parent galaxies. The velocity gradient is also clearly seen in the high resolution velocity field (inset in Figure 4). The PV diagram, the channel maps (Figures 8 and 9) and the H i map (Figures 2 and 3) reflect the concentration of H i along the major axis of the tidal bridge in the vicinity of UV clumps 12, 13, 15 and 16, with the highest H i column density at the projected position of UV clumps 12 and 13. There is also a local maxima for velocity dispersion of 14 km s-1 at this position (Figure 5).
In optical/ UV images the Bridge TDG has an 11 kpc length and the low and high resolution GMRT synthesised beams (32′′ and 14′′) samples it at 7 kpc and 3 kpc respectively. The spectrum shows an H i line width of 30 km s-1 with a systematic gradient over 50 km s-1 across its major axis, the velocity resolution being 7 km s-1. These values agree well with those TDGs reported in the literature, for which a velocity gradient has been determined. In a recent work, Lelli et al. (2015), found signs of regular velocity gradient in six bona–fide TDGs. Using a velocity resolution of 7 – 10 km s-1 and a spatial resolution of about 2 to 3 beams across the major axis, they report gradients between 25 km s-1 and 80 km s-1. A similar H i velocity gradient of 30 km s-1 to 40 km s-1 was reported for a TDG candidate in the Leo triplet (Nikiel-Wroczyński et al., 2014). While the H i line width and velocity gradient estimates for the Bridge TDG are consistent with those found in the literature, it remains unclear whether the velocity gradient represents the intrinsic rotation of the Bridge TDG, or just the gradient within the H i debris.
Using the H i spectrum from the low resolution cube for the Bridge TDG, we estimated its dynamical mass (Mdyn) to be 7 108 M⊙. Based on their best fit models and scaling to the SDSS r–band flux, the stellar mass of the Bridge TDG was estimated at 1–7 106 M⊙ by Hancock et al. (2009), giving a ratio of 1. This ratio is consistent with the absence of a substantial dark matter component and is typical of the ratio found for validated TDGs. However, the following factors together make the estimate highly uncertain: (i) the TDG is embedded in an H i debris and thus its spectrum can be contaminated by foreground and background emission (ii) it is impossible to distinguish the extent of the H i disk of the TDG from the general bridge emission (iii) assuming the Bridge TDG was formed during the last encounter between the pair ( 108yr), it seems probable that there has been insufficient time for the Bridge TDG to virialise (Flores et al., 2016). All these factors make the calculated Mdyn highly uncertain and therefore while we present our estimates here, we choose not to make any strong claims on the dark matter content of the TDG based on it.
The Hancock et al. (2009) model of the stellar component of the pair interaction shows the development of a tidal bridge between NGC 4017 and NGC 4016, with SF activity near the centre of the bridge and the bridge base near NGC 4017. The authors suggest, “material balanced between the two galaxies”, NGC 4017 and NGC 4016, collapsed under its own gravity and gave rise to the TDG, i.e., the stellar debris provided the seed for accumulation and of gas debris which in turn fuelled SF in the TDG. Potentially a kinematic rotation signature could confirm a TDG candidate as an independent galaxy, rather than just an accumulation of SF zones. However, in this case this is not feasible as the Bridge TDG is embedded in the bridge H i debris and the GMRT spatial resolution is too poor to distinguish the TDG candidate’s intrinsic kinematics from the kinematics of the H i debris. Due to their relatively higher metallicity than standard dwarf galaxies, the probability of detecting CO emission lines is higher in TDGs (Braine et al., 2001) which could overcome the spatial resolution issue. Moreover, since a TDG’s molecular gas is predicted to be formed in–situ (Braine et al., 2001), the molecular gas disk is expected to be more localised to the TDG than H i.
| System | TDG | H i column | H i map | Estimated time | Pair M∗ | SFR | SFE |
|---|---|---|---|---|---|---|---|
| candidate | density | resolution | since interaction | ratio | |||
| [1020 atoms cm -2] | [arcsec] | [Gyr] | [M⊙ yr-1] | [M⊙ yr-1/M⊙] | |||
| Arp 65 | H i maxima | 8.3 | 23 | 0.2 | 1:3.0 | – | – |
| Arp 181 | TDG | 9.9 | 10 | – | 1:3.6 | – | |
| Arp 202 | TDG | 7.5 | 23 | 0.4 | 1:1.4 | 0.04 | 3.9 10-10 |
| Arp 305 | Bridge TDG | 4.1 | 32 | 0.4 | 1:3.3 | 0.20 | 3.0 10-10 |
An old stellar component in the Arp 305 tidal bridge is predicted by the Hancock et al. (2009) modelling of the pair interaction. Like the tidal bridges in Smith et al. (2007), the Bridge TDG is detected in both the Spitzer 3.6 m and 4.5 m band images. In general, it is understood that both bands trace emission from stellar populations with ages 1 Gyr. However, it is known that both of these bands can be contaminated by emission from strong SF regions, by up to 50% from intermediate age stars (RSG and AGB) and 22% from dust (Meidt et al., 2012). Additionally the 4.5 m band suffers from CO absorption (Meidt et al., 2012). We estimated the Spitzer 3.6 m and 4.5 m flux densities at 94.71 J and 95.26 J, respectively. The Spitzer magnitudes (AB) for these bands are 15.70.3 and 15.90.3, respectively and the [3.6]–[4.5] colour is -0.2 mag. Unfortunately there are inconsistent interpretations for this color in the literature. For example, Figure 7 of Smith et al. (2005), indicates emission from M0 III stars (red giants) have a colour ( - 0.15), close to - 0.2, while Querejeta et al. (2015) states “The expected color for an old stellar population of ages t 2 Gyr –12 Gyr is - 0.2 [3.6]–[4.5] 0 ”. Both Smith and Querejeta agree that this colour is not associated with strong dust emission. Also the [3.6]–[4.5] colour of old ellipticals is negative (Peletier et al., 2012). We conclude that the Bridge TDG is largely free from dust emission and it is highly probable that its 3.6 m and 4.5 m emission is principally tracing a stellar population formed before the latest interaction by the pair. If this is the case, it is consistent with the stellar debris seeding the TDG scenario. Optical spectroscopy could provide confirmation of this. The stellar mass based on the Spitzer 3.6 m and 4.5 m flux is 4.1 107M⊙ following Eskew et al. (2012). This is higher than the stellar mass estimate by Hancock et al. (2009) of 1–7 106M⊙, but still an order of magnitude lower than the H i mass of the TDG, making it a gas dominated system.
Accepting the limitations of claims that can be made using the currently available data, we find that the Arp 305 Bridge TDG differs from our previous TDG H i detections in Arp 202 and Arp 181 (Sengupta et al., 2014, 2013) in having Spitzer 3.6 m and 4.5 m counterparts, indicative of an old stellar component. Additionally, Arp 305 TDG has strong UV emission indicating recent SF. This is consistent with a scenario where central region of the tidal bridge, containing old stars originating in principal pair, provided the seed potential for the TDG to grow from infalling gas debris. This scenario is quite different from TDG candidates detected in Arp 181 and Arp 202. In those cases weak optical emission and the absence of Spitzer NIR emission (Smith et al., 2007) suggests an insignificant old stellar component in those TDGs and supports a scenario where the TDG primarily forms from gas debris collapse. In Table 5 we compare the H i and star formation properties of the TDG candidates and potential TDG host debris we have studied so far. Arp 181’s TDG has no published SFR from any band and Arp 65’s high column density H i debris does not host a TDG or detected star formation activity (Sengupta et al., 2015). Table 5 shows that while the SFR of Arp 305 is about an order of magnitude higher than Arp 202, the star formation efficiency (SFE), defined as SFR per unit H i mass, is similar and is consistent with the low SFE trends of TDGs (Braine et al., 2001). While the comparison of TDGs in Table 5 is inconclusive due to small sample size. It remains an open question whether the presence of a substantial old stellar population in a TDG significantly affects its SF history and in particular the timescale for TDG formation.
5 Summary and concluding remarks
We have mapped the H i in Arp 305 interacting pair with the GMRT. Our analysis of the H i morphology and kinematics of the pair supports the conclusion in Hancock et al. (2009) that the most recent encounter between the pair occurred 4 108 yr ago. However, there are H i morphological and kinematic features NW of NGC 4017 , not found in models of first encounters for interacting galaxy pairs, which may be remnants of an earlier encounter between the two galaxies. Similar features in M 51 type systems are proposed as debris from earlier encounters. The Arp 305 system shows extended star formation in its tidal tails and bridge. The GMRT H i maps lack the spatial resolution for detailed studies of the correlation between individual SF zones and H i column densities, although the extragalactic SF zones in the Arp 305 system are projected at locations with a range of H i column densities with no specific bias towards higher column densities.
The H i morphology and kinematic properties of the Bridge TDG candidate include: 6.6 108M⊙ and VHI = 35007km s-1 (in good agreement with the velocities of the parent galaxies). Additionally the linewidth of 30km s-1, the modest velocity gradient, and SFR of 0.20 M⊙ yr-1 add to the evidence favouring the Bridge TDG candidate being a genuine TDG. A Spitzer 3.6 m and 4.5 m counterpart with a [3.6]–[4.5] colour -0.2 mag suggests a formation scenario containing a substantial old stellar population. Future spectroscopic observations for this TDG are planned to confirm this formation scenario and provide the metallicity of the TDG. Originating from processed material, TDGs are expected to show higher metallicity compared to normal dwarf galaxies, making it a key criteria for the validation for TDG candidates.
6 Acknowledgements
TS acknowledges support for this project from the Fundação para a Ciência e a Tecnologia (FCT) grant No.SFRH/BPD/103385/2014. We thank the staff of the GMRT who have made these observations possible. The GMRT is operated by the National Centre for Radio Astrophysics of the Tata Institute of Fundamental Research. This research has made use of the NASA/IPAC Extragalactic Database (NED) which is operated by the Jet Propulsion Laboratory, California Institute of Technology, under contract with the National Aeronautics and Space Administration. This research has made use of the Sloan Digital Sky Survey (SDSS). Funding for the SDSS and SDSS-II has been provided by the Alfred P. Sloan Foundation, the Participating Institutions, the National Science Foundation, the U.S. Department of Energy, the National Aeronautics and Space Administration, the Japanese Monbukagakusho, the Max Planck Society, and the Higher Education Funding Council for England. The SDSS Web Site is http://www.sdss.org/.This research made use of APLpy, an open-source plotting package for Python hosted at http://aplpy.github.com.
References
- Baars et al. (1977) Baars J. W. M., Genzel R., Pauliny-Toth I. I. K., Witzel A., 1977, A&A, 61, 99
- Barnes (1992) Barnes J. E., 1992, ApJ, 393, 484
- Begum et al. (2006) Begum A., Chengalur J. N., Karachentsev I. D., Kaisin S. S., Sharina M. E., 2006, MNRAS, 365, 1220
- Bell et al. (2003) Bell E. F., McIntosh D. H., Katz N., Weinberg M. D., 2003, ApJS, 149, 289
- Blanton et al. (2003) Blanton M. R., Hogg D. W., Bahcall N. A., Brinkmann J., Britton M., Connolly A. J., Csabai I., Fukugita M., 2003, ApJ, 592, 819
- Boselli et al. (2009) Boselli A., Boissier S., Cortese L., Buat V., Hughes T. M., Gavazzi G., 2009, ApJ, 706, 1527
- Braine et al. (2001) Braine J., Duc P.-A., Lisenfeld U., Charmandaris V., Vallejo O., Leon S., Brinks E., 2001, A&A, 378, 51
- de Mello et al. (2012) de Mello D. F., Urrutia-Viscarra F., Mendes de Oliveira C., Torres-Flores S., Carrasco E. R., Cypriano E., 2012, MNRAS, 426, 2441
- Duc et al. (2004) Duc P.-A., Bournaud F., Masset F., 2004, A&A, 427, 803
- Duc et al. (2000) Duc P.-A., Brinks E., Springel V., Pichardo B., Weilbacher P., Mirabel I. F., 2000, AJ, 120, 1238
- Duc et al. (1997) Duc P.-A., Brinks E., Wink J. E., Mirabel I. F., 1997, A&A, 326, 537
- Duc & Mirabel (1999) Duc P.-A., Mirabel I. F., 1999, in Barnes J. E., Sanders D. B., eds, Galaxy Interactions at Low and High Redshift Vol. 186 of IAU Symposium, Tidal Dwarf Galaxies. p. 61
- Eskew et al. (2012) Eskew M., Zaritsky D., Meidt S., 2012, AJ, 143, 139
- Flores et al. (2016) Flores H., Hammer F., Fouquet S., Puech M., Kroupa P., Yang Y., Pawlowski M., 2016, MNRAS, 457, L14
- Hancock et al. (2009) Hancock M., Smith B. J., Struck C., Giroux M. L., Hurlock S., 2009, AJ, 137, 4643
- Haynes & Giovanelli (1984) Haynes M. P., Giovanelli R., 1984, AJ, 89, 758
- Haynes et al. (2011) Haynes M. P., Giovanelli R., Martin A. M., Hess K. M., Saintonge A., Adams E. A. K., Hallenbeck G., Hoffman G. L., Huang S., 2011, AJ, 142, 170
- Hibbard et al. (2005) Hibbard J. E., Bianchi L., Thilker D. A., Rich R. M., Schiminovich D., Xu C. K., Neff S. G., 2005, ApJL, 619, L87
- Holwerda et al. (2011) Holwerda B. W., Pirzkal N., Cox T. J., de Blok W. J. G., Weniger J., Bouchard A., Blyth S.-L., van der Heyden K. J., 2011, MNRAS, 416, 2426
- Howard & Byrd (1990) Howard S., Byrd G. G., 1990, 99, 1798
- Huchtmeier & Richter (1989) Huchtmeier W. K., Richter O.-G., 1989, A General Catalog of HI Observations of Galaxies. The Reference Catalog.
- Kennicutt (1989) Kennicutt Jr. R. C., 1989, ApJ, 344, 685
- Lelli et al. (2015) Lelli F., Duc P.-A., Brinks E., Bournaud F., McGaugh S. S., Lisenfeld U., Weilbacher P. M., Boquien M., Revaz Y., Braine J., Koribalski B. S., Belles P.-E., 2015, ArXiv e-prints
- Lewis et al. (1985) Lewis B. M., Helou G., Salpeter E. E., 1985, ApJS, 59, 161
- Makarov et al. (2014) Makarov D., Prugniel P., Terekhova N., Courtois H., Vauglin I., 2014, A&A, 570, A13
- Maybhate et al. (2007) Maybhate A., Masiero J., Hibbard J. E., Charlton J. C., Palma C., Knierman K. A., English J., 2007, MNRAS, 381, 59
- Meidt et al. (2012) Meidt S. E., Schinnerer E., Knapen J. H., Bosma A., Athanassoula E., Sheth K., 2012, ApJ, 744, 17
- Mullan et al. (2013) Mullan B., Kepley A. A., Maybhate A., English J., Knierman K., Hibbard J. E., Bastian N., Charlton J. C., Durrell P. R., Gronwall C., Elmegreen D., Konstantopoulos I. S., 2013, ApJ, 768, 194
- Neff et al. (2005) Neff S. G., Thilker D. A., Seibert M., Gil de Paz A., Bianchi L., Schiminovich D., Martin D. C., 2005, ApJL, 619, L91
- Nikiel-Wroczyński et al. (2014) Nikiel-Wroczyński B., Soida M., Bomans D. J., Urbanik M., 2014, ApJ, 786, 144
- Oh et al. (2008) Oh S. H., Kim W.-T., Lee H. M., Kim J., 2008, ApJ, 683, 94
- Peletier et al. (2012) Peletier R. F., Kutdemir E., van der Wolk G., Falcón-Barroso J., Bacon R., Bureau M., Cappellari M., 2012, MNRAS, 419, 2031
- Planck Collaboration et al. (2014) Planck Collaboration Ade P. A. R., Aghanim N., Alves M. I. R., Armitage-Caplan C., Arnaud M., Ashdown M., Atrio-Barandela F., Aumont J., Aussel H., et al. 2014, A&A, 571, A1
- Querejeta et al. (2015) Querejeta M., Meidt S. E., Schinnerer E., Cisternas M., Muñoz-Mateos J. C., Sheth K., Knapen J., van de Ven G., Norris M. A., Peletier 2015, ApJS, 219, 5
- Ramella et al. (2002) Ramella M., Geller M. J., Pisani A., da Costa L. N., 2002, AJ, 123, 2976
- Salo & Laurikainen (1993) Salo H., Laurikainen E., 1993, ApJ, 410, 586
- Schechtman-Rook & Hess (2012) Schechtman-Rook A., Hess K. M., 2012, ApJ, 750, 171
- Sengupta et al. (2013) Sengupta C., Dwarakanath K. S., Saikia D. J., Scott T. C., 2013, MNRAS, 431, L1
- Sengupta et al. (2014) Sengupta C., Scott T. C., Dwarakanath K. S., Saikia D. J., Sohn B. W., 2014, MNRAS, 444, 558
- Sengupta et al. (2015) Sengupta C., Scott T. C., Paudel S., Saikia D. J., Dwarakanath K. S., Sohn B. W., 2015, A&A, 584, A114
- Skillman et al. (1988) Skillman E. D., Terlevich R., Teuben P. J., van Woerden H., 1988, A&A, 198, 33
- Smith et al. (2010) Smith B. J., Giroux M. L., Struck C., Hancock M., 2010, AJ, 139, 1212
- Smith et al. (2005) Smith B. J., Struck C., Appleton P. N., Charmandaris V., Reach W., Eitter J. J., 2005, 130, 2117
- Smith et al. (2007) Smith B. J., Struck C., Hancock M., Appleton P. N., Charmandaris V., Reach W. T., 2007, AJ, 133, 791
- Theureau et al. (2007) Theureau G., Hanski M. O., Coudreau N., Hallet N., Martin J.-M., 2007, A&A, 465, 71
- Torres-Flores et al. (2012) Torres-Flores S., de Oliveira C. M., de Mello D. F., Scarano S., Urrutia-Viscarra F., 2012, MNRAS, 421, 3612
- Torres-Flores et al. (2011) Torres-Flores S., Epinat B., Amram P., Plana H., Mendes de Oliveira C., 2011, MNRAS, 416, 1936
- van Moorsel (1983) van Moorsel G. A., 1983, 54, 19