Vortex creep at very low temperatures in single crystals of the extreme type-II superconductor Rh9In4S4
Abstract
We image vortex creep at very low temperatures using Scanning Tunneling Microscopy (STM) in the superconductor Rh9In4S4 (=2.25 K). We measure the superconducting gap of Rh9In4S4, finding meV and image a hexagonal vortex lattice up to close to Hc2, observing slow vortex creep at temperatures as low as 150 mK. We estimate thermal and quantum barriers for vortex motion and show that thermal fluctuations likely cause vortex creep, in spite of being at temperatures . We study creeping vortex lattices by making images during long times and show that the vortex lattice remains hexagonal during creep with vortices moving along one of the high symmetry axis of the vortex lattice. Furthermore, the creep velocity changes with the scanning window suggesting that creep depends on the local arrangements of pinning centers. Vortices fluctuate on small scale erratic paths, indicating that the vortex lattice makes jumps trying different arrangements during its travel along the main direction for creep. The images provide a visual account of how vortex lattice motion maintains hexagonal order, while showing dynamic properties characteristic of a glass.
I Introduction
In type-II superconductors, vortex-vortex repulsion favors an ordered vortex lattice. This competes with vortex pinning and thermal fluctuations that favor disordered vortex arrangementsBlatter et al. [1994], Brandt [1995]. Under the action of a current, vortices move and the superconductor leaves the zero resistance state. Vortex motion producing a residual dissipation in absence of an applied current has been observed in many materials and is termed vortex creep. Vortex creep has awakened interest of experiment and theory alike for a long time, because it ultimately limits achieving a true dissipationless state in a superconductor.
Vortex creep can occur in any practical situation in a superconducting specimen. For example, when changing the magnetic field below the superconducting critical temperature in a type-II superconductor, vortices enter from the edges of the sample jumping over pinning barriers and filling the interiorBlatter et al. [1994], Brandt [1995], Larkin and Ovchinnikov [1979], Altshuler and Johansen [2004]. The magnetization usually acquires a near equilibrium situation after some time, which is mostly quite short. However, often the magnetization continues to vary over much longer times due to vortex creep. Vortex creep is also observed when field cooling from above , because strongly pinned metastable vortex lattices are created when crossing the peak effect regionHenderson et al. [1996], Paltiel et al. [2000]. Vortex creep is driven by a current density , which results from the difference between the actual magnetization from the metastable vortex configurations and its equilibrium value. is well below the critical current density Feigel’man et al. [1989].
A large Ginzburg-Levanyuk number Blatter et al. [1994], Brandt [1995], Feigel’man et al. [1989], Kes et al. [1989], Yeshurun and Malozemoff [1988], Blatter and Geshkenbein [1993], Kierfeld et al. [2000], Konczykowski et al. [2012], Eley et al. [2016], Levanyuk [1959], Ginzburg [1960] favors vortex creep. is the ratio between the critical temperature and the superconducting condensation energy (, with the thermodynamic critical field) in a volume of size of the coherence length and is given by . quantifies the relevance of thermal fluctuations in a superconducting material and ranges from in cuprate superconductors to in conventional low superconductors.
Vortex creep has been studied thoroughly using macroscopic techniques, such as magnetization or resistivity (see e.g. Refs.Nideröst et al. [1998], Dumont and Mota [2002], Prozorov et al. [2008], Konczykowski et al. [2012], Fruchter et al. [1991], Klein et al. [2014], Eley et al. [2016]). However, imaging experiments at low temperatures are, to our knowledge, scarce.
Previous imaging studies mostly address vortex flow driven by a metastable magnetic field configuration within the peak effect regime or at high temperaturesPardo et al. [1998], Troyanovski et al. [1999, 2002], Guillamon et al. [2011], Lee et al. [2011]. Moving vortex lattices have been imaged in real space at very low magnetic fields using magnetic decoration and at high magnetic fields using STMPardo et al. [1998], Troyanovski et al. [1999, 2002], Guillamon et al. [2011], Lee et al. [2011]. They have shown different structure factors changing from hexagonal to smectic-like Olson et al. [1998]. Smectic structures forming channels where vortex positions are uncorrelated along the flow direction but correlated perpendicular to it appear more often at low magnetic field where intervortex interaction is weak Moon et al. [1996]. In contrast, crystalline-like hexagonal moving lattices are predicted for stiff dense lattices under high driving currents suggesting that motion can induce order in the vortex lattice. The latter, known as moving Bragg glass, are free from topological defects and show long range positional and orientational correlations Giamarchi and Le Doussal [1994, 1995]. For instance, the smectic driven phase has been observed in 2H-NbSe2 at extremely low fields and high driving currents, with crystalline order appearing at higher fields Pardo et al. [1998]. In our experiment, contrary to previous cases, the flow velocity is low and we measure at high fields in the dense lattice regime and at very low temperatures where the stiffness is maximum, so that motion is expected to be correlated.
Furthermore, in previous experiments, vortex motion occurs due to currents of order of . Here we directly observe slow vortex creep at millikelvin temperatures for a situation where . We find that in this regime vortices move by jumps with large directional changes and show strong fluctuations on top of the overall motion in the direction for creep.
We have used single crystals of the recently discovered superconducting material Rh9In4S4 (=2.25 K) Kaluarachchi et al. [2016]. The low temperature coherence length is of nm. The penetration depth is very large, of nearly 600 nm and the mean free path is rather low, of approximately 5 nm (see Appendix). The Ginzburg-Landau parameter is of , showing that this material is an extreme type-II superconductor. The Ginzburg-Levanyuk parameter is of . This value is above the one found usually in low superconductors and shows that thermal effects are important for the vortex lattice of Rh9In4S4. The peak effect is observed in a magnetic field range similar to that found in many other strongly disordered superconducting single crystalline materials Kaluarachchi et al. [2016]. As we show below, vortex creep is particularly apparent in this compound, probably due to the combination of a large peak effect region and a relatively large Ginzburg-Levanyuk parameter.
First we show basic characterization of this material from tunneling density of states and vortex imaging. We find a superconducting tunneling conductance at 150 mK that is spatially homogeneous at zero magnetic field with superconducting gap meV. We also find that the vortex lattice is hexagonal at low temperatures. Then we image creeping vortex lattices and determine the main parameters of vortex motion (direction and velocity) directly from our images by following each vortex during experiments lasting for many hours.
II Experimental Methods
Single crystals of Rh9In4S4 were grown using a solution growth technique Canfield and Fisk [1992], Canfield and Fisher [2001] from high-purity Rh, In and S elements. Details of the synthesis and sample characterization are described in Ref. Kaluarachchi et al. [2016]. We used crystals with lateral sizes between 1-3 mm and transversal areas less than 1 mm2 perpendicular to [100]. Figure 1 shows a picture of the samples. To prepare the surface, we tried to cleave the samples in both ambient and cryogenic conditions using the pulling system described in Ref.Suderow et al. [2011]. We combine this with either a ceramic blade or a piece of brass glued on top of the crystals so as to break the crystals by pushing on the slab at low temperatures. Most often crystals did not break and the few ones that broke revealed irregular surfaces which were not shiny and where we did not achieve stable tunneling conditions as we find usually in metals with a cleaving plane. We obtained however excellent results by using the pristine as-grown samples. Scanning conditions at low temperatures were reproducible and independent of the tunneling conductance.
To obtain the tunneling conductance, we take the numerical derivatie of the I-V curve, as in previous workSuderow et al. [2011], Crespo et al. [2006], Herrera et al. [2015]. The magnetic field is applied parallel to the -axis. To obtain the vortex lattice images shown in this work, we map the zero bias conductance normalized to its value at high bias. Neither filtering nor image treatment is made to the images we present here.
III Tunneling conductance and vortex lattice of Rh9In4S4
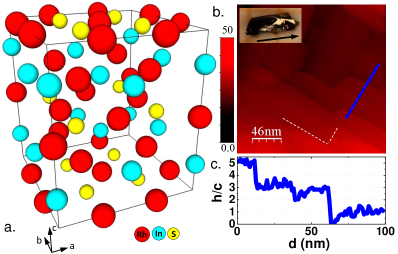
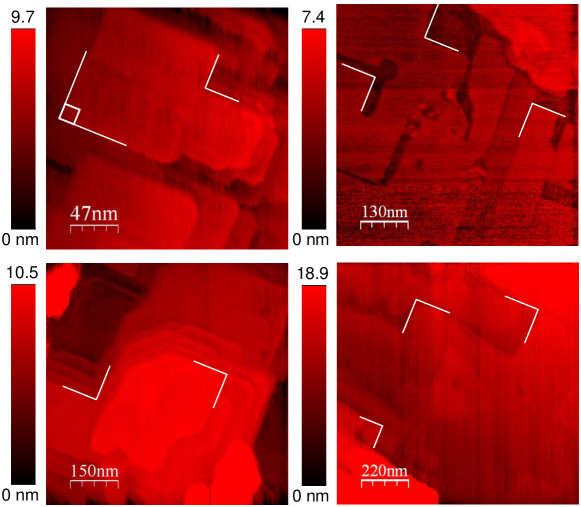
Fig.1a shows the crystal structure of Rh9In4S4. In the topographic STM image shown there (Fig.1b), we can find square symmetric features in the image, separated by steps (Fig.1c, in the appendix we provide further topographic images). The step height is an integer multiple of the -axis unit cell, pointing out that the observed intertwined squares and rectangles are due to the growth procedure that can be expected in a single crystalline material with tetragonal symmetry.
The tunneling conductance as a function of bias voltage for different temperatures is shown in Fig.2a (left panel). At the lowest temperatures we observe a smeared tunneling conductance that deviates strongly from the high quasiparticle peaks and zero bias conductance expected in a standard BCS s-wave superconductor (see e.g.Herrera et al. [2015]). The tunneling conductance remains mostly unaltered as a function of the position over the surface. In order to find the superconducting gap, we deconvolute the density of states from the tunneling conductance, see Fig.2a (right panel) (using the derivative of the Fermi function at each temperature, see e.g. Ref.Crespo et al. [2006]). We observe that the density of states becomes featureless at a temperature of 2.3 K, which coincides with the bulk transition temperature Kaluarachchi et al. [2016]. The quasiparticle peaks in the density of states are located at an energy of 0.33 meV, which is the value expected for the superconducting gap within simple s-wave BCS theory (=). The temperature dependence of the position of the quasiparticle peaks also follows expectations from BCS theory (Fig.2c).
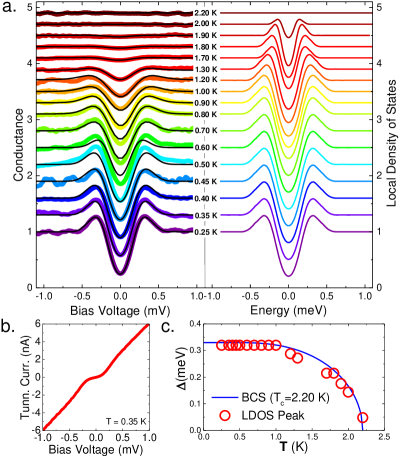
The size of the superconducting gap found with our measurements is somewhat below the one extracted from macroscopic specific heat measurements. These lead to a slightly enhanced at the superconducting transition observed in specific heat, pointing out possible strong coupling effectsKaluarachchi et al. [2016]. Our measurements show rather smeared density of states, which points out that there can be a distribution of values of the superconducting gap with larger values than the one obtained from the above analysis. More striking is however the presence of a finite density of states at the Fermi level. The bulk density of states is clearly zero within the gap, as shown by specific heat measurementsKaluarachchi et al. [2016]. Other intermetallic compounds with surfaces prepared in similar conditions show zero tunneling conductance within the gapRubio-Bollinger et al. [2001], Herrera et al. [2015]. Some sort of surface contamination could eventually lead to a normal contribution to the tunneling conductance by, for instance, a normal surface layer or pair breaking. This being said, it is quite remarkable that we find the bulk and , as well as the value of expected within s-wave BCS theory from our tunneling experiments.
Results under magnetic fields are shown in Fig.3. We find a hexagonal vortex lattice between 0.2 T up to 2.0 T (H T Kaluarachchi et al. [2016]), with the intervortex distance decreasing with field as expected. We do not observe signatures of Caroli-de Gennes-Matricon Andreev core statesCaroli et al. [1964], Hess et al. [1990], Guillamon et al. [2008]. Rather, the normalized tunneling conductance at the vortex center reaches one (Fig.3c). This is not surprising, taking into account that Rh9In4S4 is strongly in the dirty limit and that the discrete core states are expected to turn into a continuum in the dirty limitRenner et al. [1991].
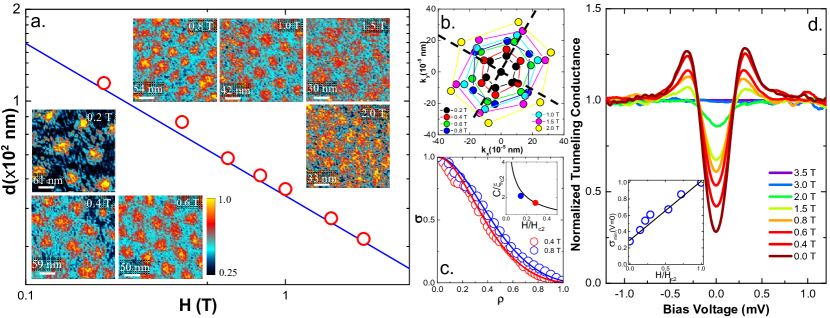
The vortex lattice is mostly oriented along the directions defined by the steps observed at the sample surface (see Fig. 1 and Fig.9 at the appendix). Fig.3(b) shows the position of the six lowest Bragg peaks of the Fourier transform of the vortex lattice images obtained at different magnetic fields vs the direction of the surface steps. The vortex lattice orients along one of the two crystalline directions of the square atomic lattice at the basal plane. Likely this shows the influcence of large scale defects, such as grain boundaries or large size dislocations, that follow the symmetry of the crystalline structure and pin the vortex lattice.
We have also analized the vortex core radius , which we define as in Refs.Fente et al. [2016], Ichioka et al. [2016], namely the inverse of the slope of the radial variation of the superconducting order parameter from the vortex center. can be obtained from the STM images as described in Refs.Fente et al. [2016], Ichioka et al. [2016]. To this end, we make an angular average of the tunneling conductance (normalized in such a way as to provide unity at the vortex center and zero in between vortices) around the center of a vortex and fit the result to the radial dependence of the density of states discussed in Fente et al. [2016], Ichioka et al. [2016]. The experimental result is shown as points and the fits as lines in Fig.3c. We use only images made at two magnetic fields, where we obtained sufficient contrast to perform the analysis. This is admitedly too little to provide a serious magnetic field dependence. Still, we find values for (inset of Fig.3c) that are consistent with the magnetic field dependence proposed in Ref. Fente et al. [2016] . We can adjust the vs H dependence in such a way as to cross the two measured points and obtain at the same time an extrapolation to Hc2 that provides the same value as the superconducting coherence length obtained from Hc2, 9.4 nm.
Finally, we have analyzed the intervortex density of states by taking tunneling conductance curves at the lowest temperatures in the middle between vortices. The result is shown in Fig.3d. The intervortex density of states at the Fermi level increases linearly with the magnetic field.
IV Vortex creep
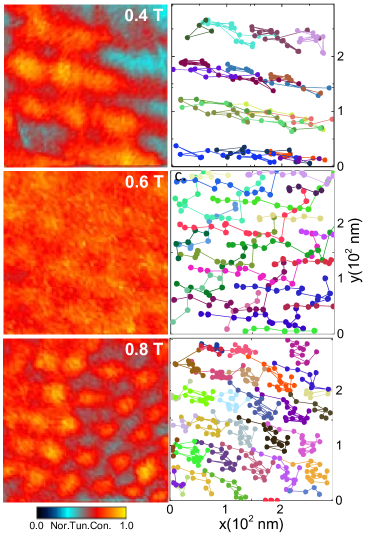
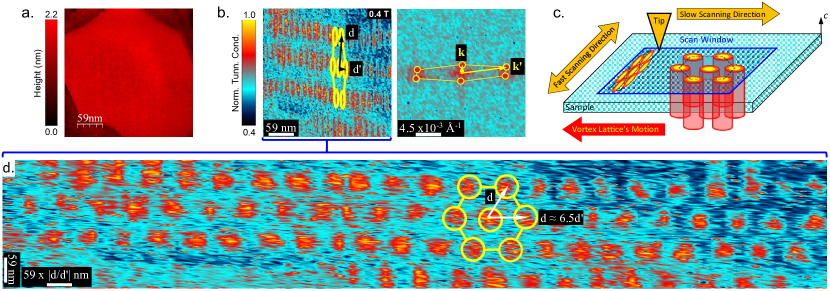
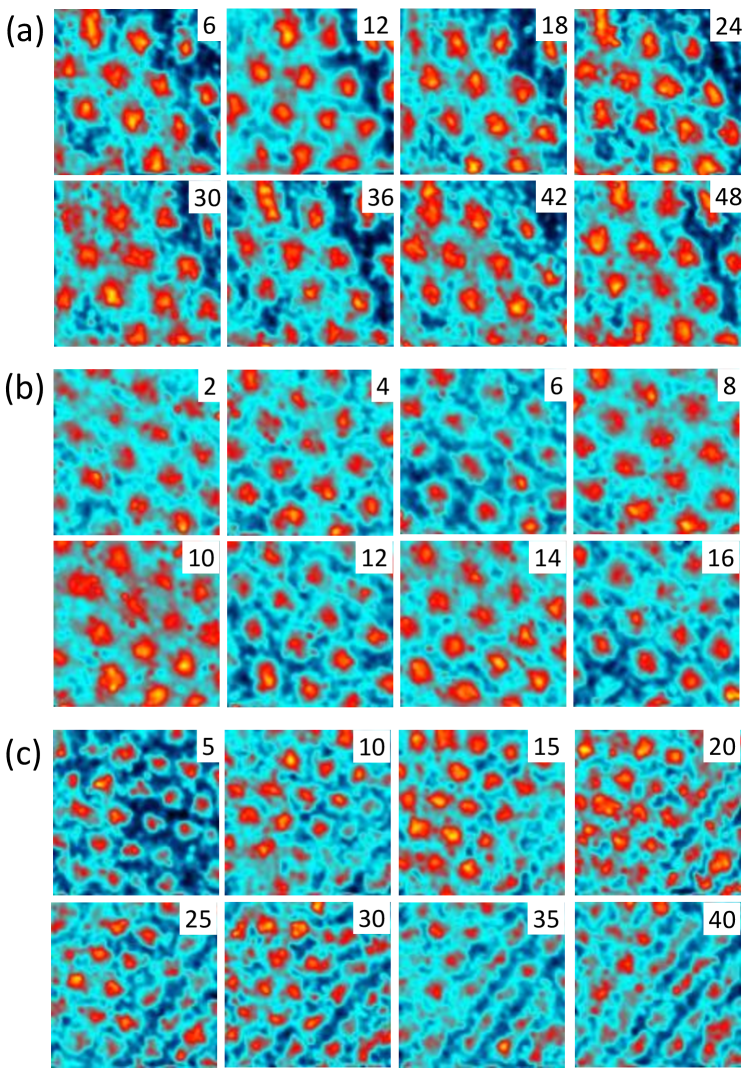
We find that vortices are slowly moving during imaging. Images in Fig.3 were made within a few minutes to obtain static views of the vortex lattice. In Fig.4 we show experiments made in different locations and magnetic fields. Motion remains unaltered (with similar velocity and direction of motion) at temperatures as low as 150 mK and after more than one day. We acquired consecutively images taken in a few minutes each during a period of several hours. In Fig.4 we show the average over a set of consecutive images (left panels of Fig.4) and the vortex trajectories during the whole experiment (right panels of Fig.4) (see Appendix for a larger set of vortex images at each magnetic field). We include in this figure zero field cooled (upper and lower panels) and field cooled experiments (middle panel). We find that the vortex motion strongly depends on location and magnetic field-temperature history. Generally, we observed either net vortex motion along a well defined direction (upper panel), net motion involving changes in the directions (middle panel) and fluctuations around the vortex positions (lower panel). The average of vortex velocities estimated by considering positions of vortices in subsequent frames is of nm/h in the upper panel, of nm/h in the middle panel and close to zero in the lower panel.
In the location where we took images of the upper panel, we find that vortices move along a main axis of the vortex lattice and that vortex motion is smooth and correlated, without any signature of jumps or steps. In the location of the middle panel, vortex motion is also along one main axis of the vortex lattice, but vortices move along another axis after a certain time. In the location of the lower panel, we only observe wiggling, without a net motion along a given direction.
To show the correlated nature of net vortex motion we have acquired an image (Fig.5) during 16 hours at the same scanning window where we did the experiment shown in the upper panel of Fig.4. Scanning was very slow, so that vortices were moving below the tip. The fast scanning axis is along a direction nearly perpendicular to vortex motion. Therefore, vortices appear compressed along the slow scanning direction (see (Fig.5b). By stretching the image with the intervortex distance at this magnetic field (0.4 T), we reproduce a hexagonal vortex lattice (Fig.5d). To understand this, we must consider the relation between vortex and tip motion. Vortices have to move with a constant velocity over the time frame given by the time a vortex remains below the tip, which is of approximately 12 minutes. The vortex lattice moves in the opposite direction to the slow scanning motion. The tip velocity along this direction is of nm/h. Using this velocity and the ratio between the intervortex distance expected for this field, , and the value found in the compressed vortex lattice, , we obtain for the vortex velocity 100 nm/h. This value coincides with the value measured by making fast consecutive images discussed above in the same field of view (upper panels of Fig.4).
Creep can be thermal and/or quantum activated. The relevant scales are given, respectively, by the collective pinning energy and the Euclidean action with the thermodynamic critical field, the coherence length, and the critical and depairing current densities and the quantum resistance Blatter et al. [1994]. The crossover temperature determines the temperature below which quantum effects dominate. In Rh9In4S4, we find using , nm Kaluarachchi et al. [2016], Dew-Hughes [2001] and . On the other hand, superconductors with a large normal state resistivity and small coherence lengths, i.e. quantum resistance of order of a k are candidates for quantum creepBlatter and Geshkenbein [1993]. In Rh9In4S4, is of in between the values reported for conventional superconductors () where quantum effects are negligible and cuprate high superconductors () where quantum fluctuations are largeBlatter et al. [1994], Ephron et al. [1996], Eley et al. [2016]. When comparing thermal and quantum contributions, we find that the crossover temperature is of about indicating that, even at 150 mK, motion is likely thermally activated.
V Discussion and conclusions
In summary, we have imaged the hexagonal superconducting vortex lattice in the extreme type-II s-wave superconductor Rh9In4S4. We determine the superconducting coherence length and find values comparable to those obtained using macroscopic upper critical field measurements. We observe directly vortex creep at very low temperatures, in nearly equilibrium conditions. From our direct observation, we conclude that the creep velocity strongly dependens on each experiment. During creep, vortices move by jumping over the pinning barriers due to thermal excitation. The vortex lattice remains hexagonal over length scales well above the image size, comprising here several hexagons. For these small sized vortex bundles and the small driving currents present in our experiment, pinning of isolated vortices plays a minor role in the motion, which rather reflects collective activated motion of the hexagonal lattice over the pinning landscape.
On the other hand, we should consider the intrinsic disorder of the vortex lattice, characterized by absence of positional ordering at large length scales Larkin and et al [1970], Nattermann [1990], Giamarchi and Le Doussal [1994, 1995]. The consequence of disorder is expected to manifest in the dynamic properties of the vortex lattice by the fact that the height of the pinning barriers depends on for . In particular, was shown to diverge as with decreasing Feigel’man et al. [1989]. This actually leads to a truly superconducting (dissipationless) phase also in systems with large vortex creepBlatter et al. [1994], Brandt [1995]. In our experiments we observe very different dynamic behavior for configurations in which the current producing vortex motion , which depends on the particular pinning landscape at each location, has been certainly very different too. The fact that we observe moving as well as nearly static vortex lattices shows that the barrier height for vortex motion strongly depends on location and magnetic field-temperature history.
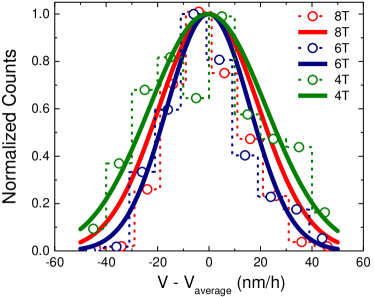
Interestingly, we observe that the velocity fluctuates significantly around the average values provided above (see Fig.6). If we follow the velocities of all vortices as a function of time, we observe that all motion is accompanied by wiggling vortices, resulting in a roughly Gaussian distribution of velocities with a width between 16 nm/h and 23 nm/h. The resulting fluctuations in the vortex positions are somewhat smaller but of order of the intervortex distance (as can be readily seen in the Fig.4). Instead of moving smoothly, the vortex lattice makes jumps trying adjacent metastable configurations, showing that the pinning potential has many small minima that are superimposed to a large variation producing creepBlatter et al. [1994]. As the barrier for motion is large for small currents, the wiggles just provide intermediate and unstable arrangements.
So our images of creeping vortex lattices visually show the capability of the vortex lattice to deform and adapt to the pinning landscape, giving glassy dynamic properties while maintaining hexagonal order.
VI Acknowlegments
We acknowledge R. Willa and V.G. Kogan for helpful and critical comments and discussions with S. Vieira. We wish to acknowledge the support of Departamento Administrativo de Ciencia, Tecnología e Innovación, COLCIENCIAS (Colombia) Programa Doctorados en el Exterior Convocatoria 568-2012. We further acknowledge support by the Spanish Ministry of Economy and Competitiveness (FIS2014-54498-R, MDM-2014-0377), by the Comunidad de Madrid through program Nanofrontmag-CM (S2013/MIT-2850), by EU (IG, European Research Council PNICTEYES grant agreement 679080, FP7-PEOPLE-2013-CIG 618321, Cost MP-1201) and by Axa Research Fund. SEGAINVEX-UAM and Banco Santander are also acknowledged. Work done in Ames Lab was supported by the U.S. Department of Energy, Office of Basic Energy Science, Division of Materials Sciences and Engineering. Ames Laboratory is operated for the U.S. Department of Energy by Iowa State University under Contract No. DE-AC02-07CH11358.
VII Appendix
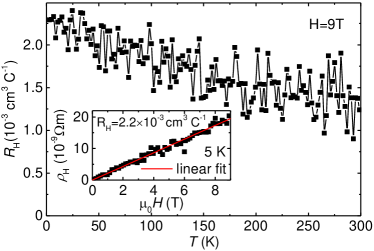
Figure 7 shows the Hall response of the single crystals of Rh9In4S4. Calculated carrier density using single band model at 5 K is cm-3. Using this value for the carrier density, the Drude model and the resistivity Kaluarachchi et al. [2016] we estimate a mean free path of nm. In Figure 8 we show a set of the frames from the experiment shown in Fig.4. In Fig.9 we show topographic images obtained in several places of the sample.
References
- Blatter et al. [1994] G. Blatter, M. V. Feigel’man, V. B. Geshkenbein, A. I. Larkin, and V. M. Vinokur. Vortices in high-temperature superconductors. Rev. Mod. Phys., 66:1125–1388, Oct 1994. doi: 10.1103/RevModPhys.66.1125. URL http://link.aps.org/doi/10.1103/RevModPhys.66.1125.
- Brandt [1995] E H Brandt. The flux-line lattice in superconductors. Reports on Progress in Physics, 58(11):1465, 1995. URL http://stacks.iop.org/0034-4885/58/i=11/a=003.
- Larkin and Ovchinnikov [1979] A. I. Larkin and Yu. N. Ovchinnikov. Pinning in type ii superconductors. Journal of Low Temperature Physics, 34(3):409–428, 1979. ISSN 1573-7357. doi: 10.1007/BF00117160. URL http://dx.doi.org/10.1007/BF00117160.
- Altshuler and Johansen [2004] E. Altshuler and T. H. Johansen. Colloquium : Experiments in vortex avalanches. Rev. Mod. Phys., 76:471–487, Apr 2004. doi: 10.1103/RevModPhys.76.471. URL http://link.aps.org/doi/10.1103/RevModPhys.76.471.
- Henderson et al. [1996] W. Henderson, E. Y. Andrei, M. J. Higgins, and S. Bhattacharya. Metastability and glassy behavior of a driven flux-line lattice. Phys. Rev. Lett., 77:2077–2080, Sep 1996. doi: 10.1103/PhysRevLett.77.2077. URL http://link.aps.org/doi/10.1103/PhysRevLett.77.2077.
- Paltiel et al. [2000] Y. Paltiel, Y. N. Myasoedov E. Zeldov and, H. Shtrikman, S. Bhattacharya, M.J. Higgins, Z.L. Xiao, E. Y. Andrei, P. L. Gammel, and D. J. Bishop. Dynamic instabilities and memory effects in vortex matter. Nature, 403:398, 2000.
- Feigel’man et al. [1989] M. V. Feigel’man, V. B. Geshkenbein, A. I. Larkin, and V. M. Vinokur. Theory of collective flux creep. Phys. Rev. Lett., 63:2303–2306, Nov 1989. doi: 10.1103/PhysRevLett.63.2303. URL http://link.aps.org/doi/10.1103/PhysRevLett.63.2303.
- Kes et al. [1989] P H Kes, J Aarts, J van den Berg, C J van der Beek, and J A Mydosh. Thermally assisted flux flow at small driving forces. Superconductor Science and Technology, 1(5):242, 1989. URL http://stacks.iop.org/0953-2048/1/i=5/a=005.
- Yeshurun and Malozemoff [1988] Y. Yeshurun and A. P. Malozemoff. Giant flux creep and irreversibility in an Y-Ba-Cu-O crystal: An alternative to the superconducting-glass model. Phys. Rev. Lett., 60:2202–2205, May 1988. doi: 10.1103/PhysRevLett.60.2202. URL http://link.aps.org/doi/10.1103/PhysRevLett.60.2202.
- Blatter and Geshkenbein [1993] Gianni Blatter and Vadim Geshkenbein. Quantum collective creep: Effects of anisotropy, layering, and finite temperature. Phys. Rev. B, 47:2725–2741, Feb 1993. doi: 10.1103/PhysRevB.47.2725. URL http://link.aps.org/doi/10.1103/PhysRevB.47.2725.
- Kierfeld et al. [2000] J. Kierfeld, H. Nordborg, and V. M. Vinokur. Theory of plastic vortex creep. Phys. Rev. Lett., 85:4948–4951, Dec 2000. doi: 10.1103/PhysRevLett.85.4948. URL http://link.aps.org/doi/10.1103/PhysRevLett.85.4948.
- Konczykowski et al. [2012] M. Konczykowski, C. J. van der Beek, M. A. Tanatar, Huiqian Luo, Zhaosheng Wang, Bing Shen, Hai Hu Wen, and R. Prozorov. Vortex creep and critical current densities in superconducting (Ba,K)Fe2As2 single crystals. Phys. Rev. B, 86:024515, Jul 2012. doi: 10.1103/PhysRevB.86.024515. URL http://link.aps.org/doi/10.1103/PhysRevB.86.024515.
- Eley et al. [2016] S. Eley, M. Leroux, M. W. Rupich, D. J. Miller, H. Sheng, P. M. Niraula, A. Kayani, U. Welp, W.-K. Kwok, and L. Civale. Decoupling and tuning competing effects of different types of defects on flux creep in irradiated YBa2Cu3O7-δ coated conductors. arXiv:1602.04344, February 2016.
- Levanyuk [1959] A.P. Levanyuk. Contribution to the theory of light scattering near the second-order phase-transition points. Sov. Phys. JETP, 9:571, 1959.
- Ginzburg [1960] V.L. Ginzburg. Sov. Phys. Solid State, 2:1284, 1960.
- Nideröst et al. [1998] M. Nideröst, R. Frassanito, M. Saalfrank, A. C. Mota, G. Blatter, V. N. Zavaritsky, T. W. Li, and P. H. Kes. Lower critical field and barriers for vortex entry in crystals. Phys. Rev. Lett., 81:3231–3234, Oct 1998. doi: 10.1103/PhysRevLett.81.3231. URL http://link.aps.org/doi/10.1103/PhysRevLett.81.3231.
- Dumont and Mota [2002] Elisabeth Dumont and Ana Celia Mota. Unconventional vortex dynamics in superconducting states with broken time-reversal symmetry. Phys. Rev. B, 65:144519, Apr 2002. doi: 10.1103/PhysRevB.65.144519. URL http://link.aps.org/doi/10.1103/PhysRevB.65.144519.
- Prozorov et al. [2008] R. Prozorov, N. Ni, M. A. Tanatar, V. G. Kogan, R. T. Gordon, C. Martin, E. C. Blomberg, P. Prommapan, J. Q. Yan, S. L. Bud’ko, and P. C. Canfield. Vortex phase diagram of single crystals. Phys. Rev. B, 78:224506, Dec 2008. doi: 10.1103/PhysRevB.78.224506. URL http://link.aps.org/doi/10.1103/PhysRevB.78.224506.
- Fruchter et al. [1991] L. Fruchter, A. P. Malozemoff, I. A. Campbell, J. Sanchez, M. Konczykowski, R. Griessen, and F. Holtzberg. Low-temperature magnetic relaxation in : Evidence for quantum tunneling of vortices. Phys. Rev. B, 43:8709–8712, Apr 1991. doi: 10.1103/PhysRevB.43.8709. URL http://link.aps.org/doi/10.1103/PhysRevB.43.8709.
- Klein et al. [2014] T. Klein, H. Grasland, H. Cercellier, P. Toulemonde, and C. Marcenat. Vortex creep down to 0.3 K in superconducting Fe(Te,Se) single crystals. Phys. Rev. B, 89:014514, Jan 2014. doi: 10.1103/PhysRevB.89.014514. URL http://link.aps.org/doi/10.1103/PhysRevB.89.014514.
- Pardo et al. [1998] F. Pardo, F. de la Cruz, P.L. Gammel, E. Bucher, and D.J. Bishop. Observation of smectic and moving Bragg glass phases in flowing vortex lattices. Nature, 396:348, 1998.
- Troyanovski et al. [1999] A. M. Troyanovski, J. Aarts, and P. H. Kes. Collective and plastic vortex motion in superconductors at high flux densities. Nature, 399:665, 1999.
- Troyanovski et al. [2002] A.M. Troyanovski, M.van Hecke, J. Aarts, and P.H. Kes. Stm imaging of flux line arrangements in the peak effect regime. Phys. Rev. Lett., 89:147006, 2002.
- Guillamon et al. [2011] I. Guillamon, H. Suderow, S. Vieira, J. Sese, R. Cordoba, J.M. De Teresa, and M. R. Ibarra. Direct observation of stress accumulation and relaxation in small bundles of superconducting vortices in tungsten thin films. Phys. Rev. Lett., 106:077001, 2011.
- Lee et al. [2011] Jonghee Lee, Hui Wang, Michael Dreyer, Helmuth Berger, and Barry I. Barker. Nonuniform and coherent motion of superconducting vortices in the picometer-per-second regime. Phys. Rev. B, 84:060515(R), 2011.
- Olson et al. [1998] C.J. Olson, C. Reichhardt, and F. Nori. Nonequilibrium phase diagram for vortex lattices. Phys. Rev. Lett., 81:3757, 1998.
- Moon et al. [1996] Kyungsun Moon, Richard T. Scalettar, and Gergely T. Zimányi. Dynamical phases of driven vortex systems. Phys. Rev. Lett., 77:2778–2781, Sep 1996. doi: 10.1103/PhysRevLett.77.2778. URL http://link.aps.org/doi/10.1103/PhysRevLett.77.2778.
- Giamarchi and Le Doussal [1994] Thierry Giamarchi and Pierre Le Doussal. Elastic theory of pinned flux lattices. Phys. Rev. Lett., 72:1530–1533, Mar 1994. doi: 10.1103/PhysRevLett.72.1530. URL http://link.aps.org/doi/10.1103/PhysRevLett.72.1530.
- Giamarchi and Le Doussal [1995] Thierry Giamarchi and Pierre Le Doussal. Elastic theory of flux lattices in the presence of weak disorder. Phys. Rev. B, 52:1242–1270, Jul 1995. doi: 10.1103/PhysRevB.52.1242. URL http://link.aps.org/doi/10.1103/PhysRevB.52.1242.
- Kaluarachchi et al. [2016] Udhara S. Kaluarachchi, Qisheng Lin, Weiwei Xie, Valentin Taufour, Sergey L. Bud’ko, Gordon J. Miller, and Paul C. Canfield. Superconducting properties of single crystals. Phys. Rev. B, 93:094524, Mar 2016. doi: 10.1103/PhysRevB.93.094524. URL http://link.aps.org/doi/10.1103/PhysRevB.93.094524.
- Canfield and Fisk [1992] P. C. Canfield and Z. Fisk. Growth of single crystals from metallic fluxes. Philosophical Magazine Part B, 65(6):1117–1123, 1992. doi: 10.1080/13642819208215073. URL http://dx.doi.org/10.1080/13642819208215073.
- Canfield and Fisher [2001] Paul C. Canfield and Ian R. Fisher. High-temperature solution growth of intermetallic single crystals and quasicrystals. Journal of Crystal Growth, 225(2–4):155 – 161, 2001. ISSN 0022-0248. doi: http://dx.doi.org/10.1016/S0022-0248(01)00827-2. URL http://www.sciencedirect.com/science/article/pii/S0022024801008272. Proceedings of the 12th American Conference on Crystal Growth and Epitaxy.
- Suderow et al. [2011] H. Suderow, I. Guillamon, and S. Vieira. Compact very low temperature scanning tunneling microscope with mechanically driven horizontal linear positioning stage. Review of Scientific Instruments, 82(3):033711, 2011. doi: http://dx.doi.org/10.1063/1.3567008. URL http://scitation.aip.org/content/aip/journal/rsi/82/3/10.1063/1.3567008.
- Herrera et al. [2015] E. Herrera, I. Guillamon, J.A. Galvis, A. Correa, A. Fente, R.F. Luccas, F.J. Mompean, M. Garcia-Hernandez, S. Vieira, J.P. Brison, and H. Suderow. Magnetic field dependence of the density of states in the multiband superconductor -Bi2Pd. Phys. Rev. B, 92:054507, 2015.
- Crespo et al. [2006] M. Crespo, H. Suderow, S. Vieira, S. Bud’ko, and P. C. Canfield. Local superconducting density of states of . Phys. Rev. Lett., 96:027003, Jan 2006. doi: 10.1103/PhysRevLett.96.027003. URL http://link.aps.org/doi/10.1103/PhysRevLett.96.027003.
- Rubio-Bollinger et al. [2001] G. Rubio-Bollinger, H. Suderow, and S. Vieira. Tunneling spectroscopy in small grains of superconducting MgB2. Phys. Rev. Lett., 86:5582, 2001.
- Caroli et al. [1964] C. Caroli, P. G. de Gennes, and J. Matricon. Bound fermion states on a vortex line in a type II superconductor. Phys. Lett., 9:307, 1964.
- Hess et al. [1990] H. F. Hess, R. B. Robinson, and J. V. Waszczak. Vortex-core structure observed with a scanning tunneling microscope. Phys. Rev. Lett., 64:2711, 1990.
- Guillamon et al. [2008] I. Guillamon, H. Suderow, S. Vieira, L. Cario, P. Diener, and P. Rodiere. Superconducting density of states and vortex cores of 2H-NbS2. Phys. Rev. Lett., 101:166407, 2008.
- Renner et al. [1991] Ch. Renner, A. D. Kent, Ph. Niedermann, Ø. Fischer, and F. Lévy. Scanning tunneling spectroscopy of a vortex core from the clean to the dirty limit. Phys. Rev. Lett., 67:1650–1652, Sep 1991. doi: 10.1103/PhysRevLett.67.1650. URL http://link.aps.org/doi/10.1103/PhysRevLett.67.1650.
- Fente et al. [2016] A. Fente, E. Herrera, I. Guillamon, H. Suderow, S. Manas-Valero, M. Galbiati, E. Coronado, and V. G. Kogan. Field dependence of the vortex core size probed by STM. Phys. Rev. B, 94:014517, 2016.
- Ichioka et al. [2016] M. Ichioka, V.G. Kogan, and J. Schmalian. Locking of length scales in two-band superconductors. Arxiv, page 1610.00136, 2016.
- [43] Supplementary material available online.
- Dew-Hughes [2001] D. Dew-Hughes. The critical current of superconductors: an historical review. Low Temperature Physics, 27(9):713–722, 2001. doi: http://dx.doi.org/10.1063/1.1401180. URL http://scitation.aip.org/content/aip/journal/ltp/27/9/10.1063/1.1401180.
- Ephron et al. [1996] D. Ephron, A. Yazdani, A. Kapitulnik, and M. R. Beasley. Observation of quantum dissipation in the vortex state of a highly disordered superconducting thin film. Phys. Rev. Lett., 76:1529–1532, Feb 1996. doi: 10.1103/PhysRevLett.76.1529. URL http://link.aps.org/doi/10.1103/PhysRevLett.76.1529.
- Larkin and et al [1970] A.I. Larkin and et al. Effect of inhomogeneities on the structure of the mixed state of superconductors. Sov. Phys. JETP, 31:784, 1970.
- Nattermann [1990] Thomas Nattermann. Scaling approach to pinning: Charge density waves and giant flux creep in superconductors. Phys. Rev. Lett., 64:2454–2457, May 1990. doi: 10.1103/PhysRevLett.64.2454. URL http://link.aps.org/doi/10.1103/PhysRevLett.64.2454.