Far-infrared properties of infrared bright dust-obscured galaxies selected with IRAS and AKARI far-infrared all-sky survey
Abstract
We investigate the star forming activity of a sample of infrared (IR)-bright dust-obscured galaxies (DOGs) that show an extreme red color in the optical and IR regime, . Combining an IR-bright DOG sample with the flux at 22 3.8 mJy discovered by Toba & Nagao (2016) with IRAS faint source catalog version 2 and AKARI far-IR (FIR) all-sky survey bright source catalog version 2, we selected 109 DOGs with FIR data. For a subsample of 7 IR-bright DOGs with spectroscopic redshift () that was obtained from literature, we estimated their IR luminosity, star formation rate (SFR), and stellar mass based on the spectral energy distribution fitting. We found that (i) WISE 22 luminosity at observed frame is a good indicator of IR luminosity for IR-bright DOGs and (ii) the contribution of active galactic nucleus (AGN) to IR luminosity increases with IR luminosity. By comparing the stellar mass and SFR relation for our DOG sample and literature, we found that most of IR-bright DOGs lie significantly above the main sequence of star-forming galaxies at similar redshift, indicating that the majority of IRAS- and/or AKARI-detected IR-bright DOGs are starburst galaxies.
=1 \fullcollaborationNameThe Friends of AASTeX Collaboration
1 Introduction
The stellar mass () and the star formation rate (SFR) are two of the most fundamental and important physical quantities of galaxies. Since a tight correlation between and SFR of galaxies has been discovered (e.g, Brinchmann et al., 2004), many authors have intensively investigated this relation for various galaxies at various redshift (e.g, Daddi et al., 2007; Elbaz et al., 2007; Noeske et al., 2007). It is well known that the majority of galaxies follows a relation so-called “main sequence (MS)” and this correlation is seen to evolve towards high redshift across all environments (e.g., Whitaker et al., 2012; Koyama et al., 2013; Lee et al., 2015; Tomczak et al., 2016). However, a comprehensive implication of the tight correlation between stellar mass and SFR and of its redshift evolution is still unclear (see Casey et al., 2014). In addition, it is known that galaxies undergoing active star formation (SF) that could be induced by major merger process lie significantly above the MS and referred as starburst galaxies. Investigating the relation of these starburst galaxies and MS is important to understand the origin of the –SFR connection.
In this work, we focus on dust-obscured galaxies (DOGs: Dey et al., 2008). Their mid-infrared (MIR) flux densities are three orders of magnitude larger than those at optical wavelengths, implying that a significant active galactic nucleus (AGN) and/or SF activities heat dust. The optical and ultraviolet (UV) emission originated from these activities is absorbed by heavily surrounding dust that re-emits in the IR wavelength. Their IR luminosity often exceeds that is classified as ultraluminous IR galaxies (ULIRGs: Sanders & Mirabel, 1996). Recently, Riguccini et al. (2015) investigated the far-IR (FIR) properties for a sample of 95 DOGs within the COSMOS field, based on spectral energy distribution (SED) fitting. However, their DOG sample is limited to those with flux density at 24 less than 3.0 mJy (its mean value is 0.4 mJy). On the other hand, IR-bright DOGs with a much higher MIR flux density are thought to be a maximum phase of SF and AGN activity (e.g., Hopkins et al., 2008), ant thus they are likely to be a crucial population to understand what kinds of physical processes drive the SFR– relation. Recently, we successfully discovered a large number of IR-bright DOGs and investigated their statistical properties (Toba et al., 2015; Toba & Nagao, 2016; Toba et al., 2017). However, their SF properties are still unknown because we lack deep and wide FIR data that are responsible for the SF activity.
In order to estimate the FIR luminosity of IR-bright DOGs and investigate their SF properties, we utilized data from the Infrared Astronomical Satellite (IRAS) and AKARI satellite. IRAS is the first satellite that performed an all-sky survey in four IR bands centered at 12, 25, 60, and 100 (Neugebauer et al., 1984; Beichman et al., 1988). In this work, we utilized the IRAS Faint Source Catalogue (FSC), version 2.0 (Moshir et al., 1992) reaching a depth of 0.2 Jy at 12, 25 and 60 and 1.0 Jy at 100 . AKARI is the first Japanese space satellite dedicated to IR astronomy, that was launched in 2006 (Murakami et al., 2007). AKARI performed an all-sky survey at 9, 18, 65, 90, 140, and 160 whose spatial resolution and sensitivity are much higher than those of the IRAS. In this work, we utilized the AKARI Far-Infrared Surveyor (FIS: Kawada et al. 2007) bright source catalogue (BSC) version 2.0 (Yamamura et al. in prep.), which provides the positions and flux densities in the four FIR wavelengths centered at 65, 90, 140, and 160 . The 5 sensitivity at each band is about 2.4, 0.55, 1.4, and 6.3 Jy, which is the deepest data in terms of the FIR all-sky data, and thus these data should be useful to derive the total IR luminosity and SFR of IR-bright DOGs.
In this paper, we present the IR luminosity, stellar mass, and SFR for IR-bright DOGs detected by the Sloan Digital Sky Survey (SDSS: York et al., 2000), Wide-field Infrared Survey Explorer (WISE: Wright et al., 2010), and at least detected by IRAS or AKARI FIR all-sky survey. These multi-wavelength data are critical for investigating where IR-bright DOGs lie in the SFR–stellar mass (SFR–) plane. Throughout this paper, we adopt = 70 km s-1 Mpc-1, = 0.3, and = 0.7. Unless otherwise noted, all magnitudes refer on the AB system.
2 Data and analysis
2.1 Sample selection
We selected 8 IR-bright DOGs with spectroscopic information based on WISE, SDSS, IRAS, and AKARI catalogs 111For the selection process, we employed the TOPCAT, which is an interactive graphical viewer and editor for tabular data (Taylor et al., 2005).. The flow chart of our sample selection process is shown in Figure 1.
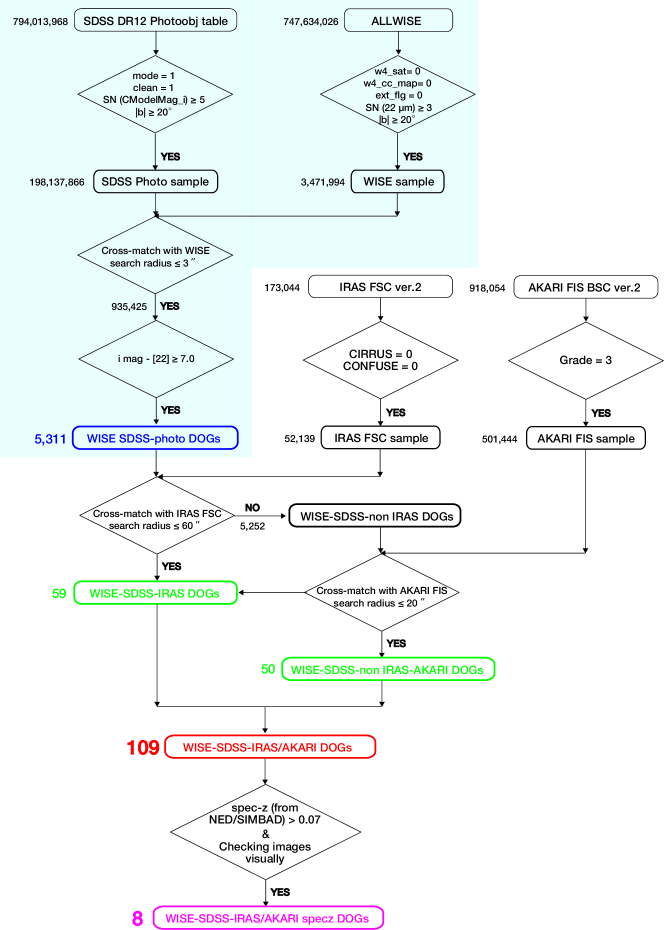
The DOG parent sample (hereafter WISE–SDSS photo DOGs) was selected from Toba & Nagao (2016) who discovered 5,311 IR-bright DOGs with and flux at 22 3.8 mJy, where and [22] are -band and 22 AB magnitudes, respectively, based on the ALLWISE (Cutri et al., 2014) and SDSS Data Release 12 (SDSS DR12: Alam et al., 2015) catalogs. For them, we fist cross-identified IRAS FSC version 2 that includes 173,044 sources. Before cross-matching, we conservatively selected 52,139 sources that are not affected by cirrus and confusion by adopting CIRRUS = 0 and CONFUSE = 0. Using a matching radius of 1, 59 DOGs (hereafter WISE–SDSS-IRAS DOGs) were selected. Note that we checked the quality of IRAS flux in each band (fqual_12/25/60/100) for them, and confirmed that flux at least in one band is measured with good quality (i.e., fqual_12/25/60/100 2). For DOGs that are not cross-identified with IRAS FSC (hereafter WISE–SDSS-non IRAS DOGs), we cross-identified AKARI FIR BSC version 2 that includes 918,054 sources. Before cross-matching, we limited ourselves to 501,444 sources with high detection reliability (GRADE = 3), i.e., detected by at least two wavelength bands or in four or more scans in one wavelength band. Using a matching radius of 20 which is determined by considering the point spread function size of 40 of the AKARI 90 data, 50 DOGs (hereafter WISE–SDSS-non IRAS–AKARI DOGs) were selected. Only one AKARI object has 2 counterpart candidates of WISE-SDSS photo DOGs within the search radius. We choose the nearest one as a counterpart. Note that we also cross-identified with AKARI FSC BSC ver.2. even for WISE–SDSS-IRAS DOGs to collect more FIR information for the matched sources. Consequently, we selected DOGs (hereafter WISE–SDSS–IRAS/AKARI DOGs) in this work. The main difference of the WISE–SDSS–IRAS/AKARI DOGs and classical DOGs discovered by Dey et al. (2008) is the MIR flux; the typical (median) flux density at 22 of our DOG sample is 10.4 mJy that is much brighter than 0.3 mJy at 24 selected by Dey et al. (2008) (see also Section 4.2.2).
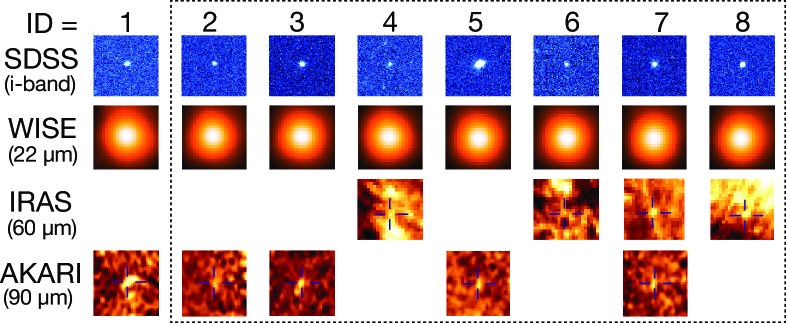
For the 109 WISE-SDSS-IRAS/AKARI DOGs, we compiled spectroscopic redshift information by utilizing the NASA/IPAC Extragalactic Database (NED222http://ned.ipac.caltech.edu/) and the Set of Identifications, Measurements, and Bibliography for Astronomical Data (SIMBAD) database333http://simbad.u-strasbg.fr/simbad/. For spectroscopically confirmed DOGs, we rejected nearby galaxies with redshift smaller than 0.07 to ensure the reliable photometry at each band because the photometry we employed is not optimized for extended sources (see Section 2.2). Finally, we visually checked optical, MIR, and FIR images and excluded a suspicious object that is affected by nearby bright star and/or that cannot be deblended by the SDSS pipeline. As a result, we selected 8 objects with spectroscopic redshift (hereafter WISE–SDSS–IRAS/AKARI specz DOGs) with (its mean redshift is 0.54). We note that only one object has a SDSS spectrum with meaningful quality because the mean -band magnitude of our DOG sample is 19.4 that is fainter than that of typical SDSS spectroscopic galaxies. Figure 2 shows cutout images at optical, MIR, and FIR wavelength. All the information of our DOGs sample is tabulated in Table 1.
2.2 SED Fitting to derive the IR luminosity
We performed the SED fitting for the 8 WISE–SDSS–IRAS/AKARI specz DOG sample to derive the total IR luminosity, (8–1000 m). We employed the fitting code SEd Analysis using BAyesian Statistics (SEABASs444http://xraygroup.astro.noa.gr/SEABASs/: Rovilos et al. 2014) that provides up to three-component fitting (AGN, SF, and stellar component) based on the maximum likelihood method. For the AGN templates, we utilized the library of Silva et al. (2004), which contains torus templates with varying extinction ranging from = 0 to = 1025 cm-2. For the SF templates, we utilized the library of Chary & Elbaz (2001) and Mullaney et al. (2011). We also used the library of Polletta et al. (2007) representing optically selected AGNs and SF galaxies (see Polletta et al. 2007 for more detail). For the stellar templates, SEABASs gives a library of 1500 synthetic stellar templates from Bruzual & Charlot (2003) stellar population models with solar metallicity and a range of SF histories and ages assuming a Chabrier (2003) initial mass function (IMF), and each model are reddened using a Calzetti et al. (2000) dust extinction law. In order to derive the total IR luminosity and stellar mass with small uncertainties, we used data only with fqual_25/60/100 2 and fqual_65/69/140/160 = 3 for IRAS and AKARI data, respectively. Eventually, we performed the SED fitting for 10–13 photometric points among , , , , , , , s-band and 3.4, 4.6, 12, 22, 25, 60, 65, 90, 100, 140, and 160 with SDSS, the TwoMicron All Sky Survey (2MASS: Skrutskie et al., 2006) Point Source Catalog (PSC: Cutri et al., 2003), WISE, IRAS and AKARI data, and estimated the total IR luminosity and stellar mass.
We employed the profile-fit magnitude and CmodelMag for each source in the WISE and SDSS catalogs, respectively, which traces total flux (hereinafter we used , , , , and as a shorthand alias for CmodelMag). For the remaining photometry in 2MASS, IRAS, and AKARI, we used the default magnitude or flux in each catalog. Note that profile-fit photometry in WISE and default magnitude in 2MASS PSC are optimized for point sources and may underestimate the true brightness of extended sources. However, since we selected point like sources by adopting flags and redshift cut (see Section 2.1) and visually confirmed it, the photometry we used is reliable.
We took into account the equilibrium between the energy absorbed from the stellar component and the energy emitted in the IR by the SF. The uncertainties of the derived contains not only statistical error but also systematic error. SEABASs can calculate for “every” trial fit and estimate the likelihood value (corresponding to the chi-square) for each case, and provides us the uncertainties as the 2 confidence interval. Therefore the influence of the difference between the inputed SED templates on the derived is included in the uncertainty.
| ID | FIS ID | objname | R.A.aaThe coordinates in the SDSS DR12. | Decl.aaThe coordinates in the SDSS DR12. | redshiftbbNED. | mag | mag | mag | mag | mag | mag | mag | mag | 3.4 flux | 4.6 flux | 12 flux | 22 flux | 25 flux (fqual_25) | 60 flux (fqual_60) | 65 flux (fqual_65) | 90 flux (fqual_90) | 100 flux (fqual_100) | 140 flux (fqual_140) | 160 flux (fqual_160) | SFR | ||
|---|---|---|---|---|---|---|---|---|---|---|---|---|---|---|---|---|---|---|---|---|---|---|---|---|---|---|---|
| hms | dms | AB mag | AB mag | AB mag | AB mag | AB mag | AB mag | AB mag | AB mag | mJy | mJy | mJy | mJy | mJy | mJy | mJy | mJy | mJy | mJy | mJy | /yr | ||||||
| 1 | 5007582 | AKARI J00260+1041 | 00:26:06.6 | +10:41:26.5 | 0.57 | 21.89 0.27 | 21.37 0.06 | 20.37 0.04 | 19.92 0.05 | 19.79 0.13 | — | — | 0.15 0.01 | 0.13 0.01 | 7.09 0.29 | 29.68 1.57 | — | — | 359.96 250.89 (1) | — | 407.51 231.02 (1) | — | — | — | — | ||
| 2 | 5204882 | AKARI J09150+2418 | 09:15:01.7 | +24:18:12.1 | 0.84 | 20.91 0.06 | 20.59 0.03 | 20.28 0.03 | 19.95 0.03 | 19.01 0.04 | 16.59 0.12 | 15.65 0.04 | 8.20 0.17 | 16.61 0.31 | 41.92 0.63 | 96.12 2.41 | — | — | — | — | 40.05 258.74 (1) | — | 13.52 | 12.60 | 2.56 | ||
| 3 | 5291698 | AKARI J13070+2338 | 13:07:00.6 | +23:38:05.1 | 0.28 | 21.46 0.18 | 20.58 0.03 | 19.38 0.02 | 19.02 0.02 | 18.56 0.05 | 16.44 0.07 | 15.31 0.04 | 8.65 0.18 | 14.71 0.28 | 26.38 0.42 | 75.79 2.14 | — | — | 453.78 255.58 (1) | — | 507.33 244.22 (1) | 53.72 338.50 (1) | 12.33 | 9.86 | 1.95 | ||
| 4 | — | IRAS F13073+6057 | 13:09:16.9 | +60:42:08.9 | 0.64 | 22.65 0.32 | 22.91 0.15 | 21.59 0.12 | 20.47 0.06 | 19.42 0.11 | 17.50 0.24 | 16.64 0.11 | 2.23 0.05 | 4.23 0.08 | 10.86 0.22 | 26.94 1.07 | 84.43 17.73 (1) | 194.70 42.83 (3) | — | 818.30 171.84 (1) | — | — | 12.75 | 11.67 | 2.35 | ||
| 5 | 5317429 | AKARI J14063+0103 | 14:06:38.2 | +01:02:54.5 | 0.24 | 19.40 0.05 | 18.69 0.01 | 18.10 0.01 | 17.70 0.01 | 17.64 0.03 | 17.51 0.21 | 16.65 0.13 | 3.09 0.07 | 8.87 0.18 | 75.79 1.07 | 236.16 4.45 | — | — | 598.65 252.74 (1) | — | 1332.88 255.74 (1) | — | 12.63 | 10.28 | 2.59 | ||
| 6 | — | IRAS F14481+4454 | 14:49:53.6 | +44:41:50.3 | 0.67 | 21.16 0.08 | 20.74 0.03 | 20.56 0.03 | 20.47 0.04 | 20.02 0.14 | — | — | 2.02 0.04 | 5.50 0.10 | 24.57 0.41 | 65.77 1.65 | 85.09 17.87 (2) | 189.70 32.25 (3) | — | 500.50 115.12 (1) | — | — | 13.29 | 9.16 | 3.16 | ||
| 7 | 5365228 | AKARI J15324+3242 | 15:32:44.0 | +32:42:46.6 | 0.93 | 20.18 0.05 | 19.91 0.02 | 19.53 0.02 | 19.23 0.02 | 18.40 0.04 | — | — | 0.41 0.01 | 0.82 0.02 | 10.55 0.23 | 48.31 1.22 | 71.03 21.31 (2) | 234.10 35.12 (3) | 61.96 191.01 (1) | 711.80 170.83 (1) | 983.85 189.00 (1) | 433.56 325.80 (1) | 13.43 | 10.85 | 2.88 | ||
| 8 | — | IRAS F23497-0448 | 23:52:15.1 | -04:32:10.5 | 0.16 | 19.98 0.07 | 19.47 0.01 | 18.86 0.01 | 18.74 0.02 | 19.19 0.09 | — | — | 0.19 0.01 | 1.25 0.03 | 18.78 0.39 | 128.23 2.98 | 311.50 93.45 (1) | 396.30 67.37 (3) | — | 571.50 165.73 (1) | — | — | 11.98 | 9.65 | 1.94 |
3 Results
3.1 Result of SED fitting
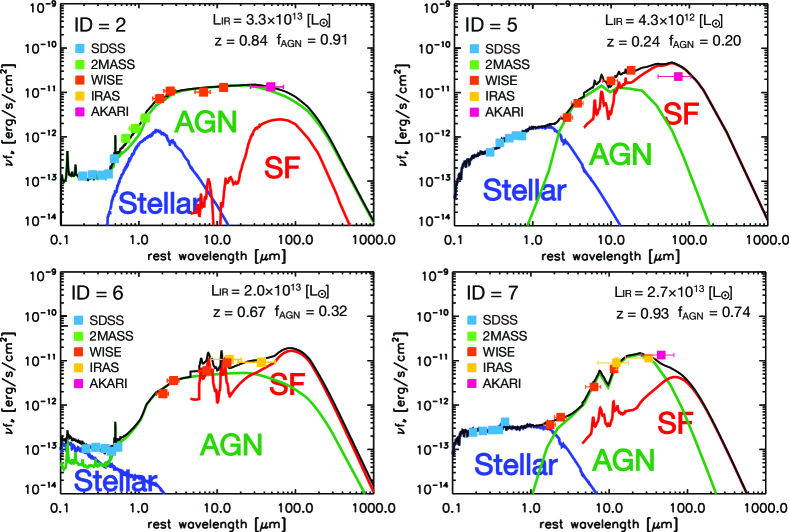
Figure 3 shows the example of the SED fitting. The best-fit AGN template for our IR-bright DOGs sample tends to favor the “torus” template presented by Silva et al. (2004) or Polletta et al. (2007), which is consistent with the report by Tsai et al. (2015) based on the WISE-selected IR luminous sources. A remarkable aspect we found is that IR-bright DOGs have a flat SED in MIR region which provides us a clue of an empirical relation of their MIR and IR luminosities (see Section 4.1). It should be noted that one object with ID=1 cannot be well-fitted by SEABASs code. Its best-fit SED in FIR region provided significantly lower than observed flux at 90 . One possible reason is that this object has only one photometric point in the FIR regime that could not be enough to constrain the FIR SEDs. Another possibility is that its 90 m flux density might be overestimated due to the deblending issue and thus SEABASs with considering energy balance between UV/optical and IR cannot reproduce the FIR emission. Therefore, we excluded this object for the SED fitting and we derive the stellar mass, total IR luminosity, and SFR for the remaining 7 DOGs with ID=2-8 (see Table 1). Hereinafter, we focus on these objects.
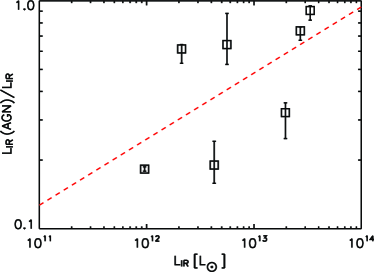
3.2 Energy contribution of AGN to the IR luminosity
Since SEABASs executes the three-component SED fitting of stellar, AGN, and SF, we can calculate the energy contribution of each component to the IR luminosity. Figure 4 shows the luminosity contribution of AGN to the IR luminosity ( (AGN)) as a function of IR luminosity. We found that the energy contribution of AGN to the IR luminosity increases with increasing the IR luminosity. This result is in good agreement with those from AKARI selected LIRGs/ULIRGs (e.g., Lee et al., 2012; Ichikawa et al., 2014) and those from IR-faint DOGs (e.g., Riguccini et al., 2015), in the sense that more IR-luminous sources tend to be more AGN-dominated. The fact that the luminous IR sources tend to be more AGN dominated relatively reported by several authors can be applicable for IR-bright DOGs.
4 Discussions
4.1 Predicting from 22 and 90 flux density
Here we discuss the correlation among the MIR luminosity, FIR luminosity, and total IR luminosity for IR-bright DOGs. As shown in Figure 3, the SEDs of DOGs in MIR regime appears flat, which gives the possibility to estimate their IR luminosities from a MIR luminosity at “observed-frame” without considering -correction. We derive 22 and 90 m luminosity density at observed frame, (22 or 90 ), just from the observed flux density by multiplying for each DOG, where is luminosity distance.
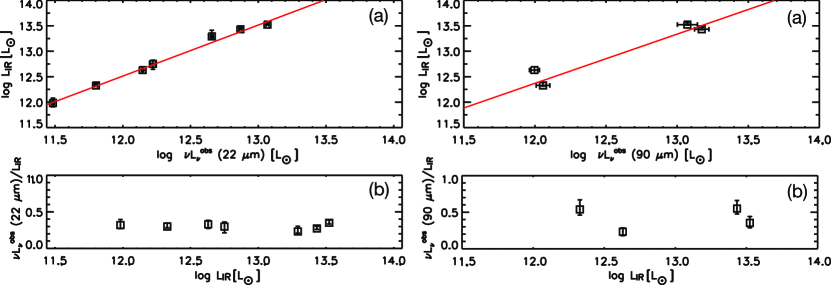
Figure 5(a) shows the relation between the 22 and 90 luminosity in the observed frame and IR luminosity. We see tight correlations between 22 luminosity and IR luminosity, and 90 luminosity and IR luminosity. Figure 5(b) shows the ratio of the 22 and 90 , and IR luminosity as a function of IR luminosity. The ratio of WISE 22 and IR luminosity have similar value regardless of IR luminosity, which suggests that 22 luminosity is a more linear relationship with IR luminosity. We obtained the following conversion formulae:
| (1) | |||||
| (2) | |||||
The Spearman rank correlation coefficients for each relationship are 1.00 and 0.60 with null hypothesis probability and 4.0 , respectively, indicating that 22 luminosity can be used to predict the total IR luminosity for IR-bright DOGs with without considering -correction. At the same time, we should keep in mind that whether or not this empirical relation is applicable to other galaxies is unknown, and thus this relation may be useful only for IR-bright DOGs.
4.2 Stellar mass and SFR
Since SEABASs has the advantage of being able to decompose the total SED into stellar, AGN, and SF components, we used IR luminosity contributed from SF activity and convert it to SFR using Kennicutt (1998) equation with the the Chabrier IMF calibrated by Salim et al. (2016),
| (3) |
where SFR and (SF) are given in unit of yr-1 and , respectively. For the stellar mass, we used the output from the SED fitting based on SEABASs assuming same IMF. Note that the rest-frame UV continuum may be contributed by scattered light from AGNs particularly for luminous DOGs (e.g., Hamann et al., 2016), which induces an uncertainty for estimated stellar mass.
4.2.1 One to one comparison with literature
Before comparing SFR– relation of IR-bright DOG sample with those of other population, we investigate whether or not the estimate of stellar mass and SFR based on SEABAS have a systematic offset compared to those derived from previous works using some local galaxies/ULIRGs. One caution here is that the difference of the assumed IMF also affects the stellar mass and SFR (e.g., Rieke et al., 2009; Casey et al., 2014), which induces a systematic offset on SFR– plane. Therefore, we corrected the stellar mass and SFR in the literature to those assumed Chabrier IMF by dividing them by 1.58 Salim et al. (2007) (see also Tacconi et al., 2008) if needed.
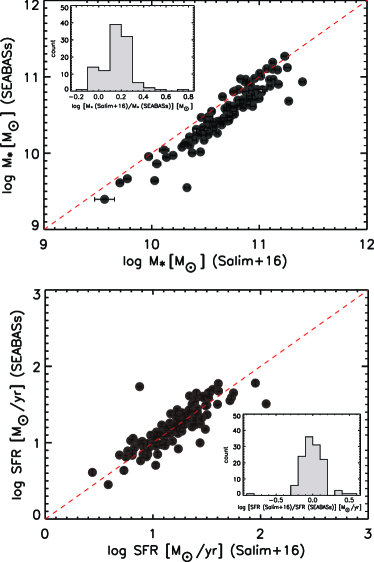
First, we compare stellar mass and SFR with those of local galaxies at estimated by Salim et al. (2007). They recently provided a catalog (GALEX–SDSS–WISE Legacy Catalog: GSWLC) of physical properties including stellar masses and SFRs that were derived by the SED fitting following a Bayesian methodology for UV/optical data. Note that in addition to SFRs derived from the SED fitting, they provided MIR SFRs derived from IR templates based on WISE 22 data to avoid potential systematics. This is because they do not use the FIR data to derive the SFR that could induce large uncertainties (see e.g., Toba & Nagao, 2016). So, we first cross matched the GSWLC catalog with AKARI FIS BSC ver.2, and derived stellar mass and SFR of matched sources as described above. We then compared each quantity of them with those in GSWLC where we used MIR-SFR derived from ALLWISE catalog.
Figure 6 shows the comparison of stellar masses derived from our method and those in GSWLC. Our estimate of SFR is in good agreement with that in Salim et al. (2007) while the stellar mass we estimated is slightly smaller than that in Salim et al. (2007); the typical offset of stellar mass is dex. This offset is roughly consistent with that results from the comparison between GSWLC and the Max Planck Institute for Astrophysics/Johns Hopkins University (MPA/JHU) catalog (Kauffmann et al., 2003; Brinchmann et al., 2004) (see Salim et al., 2007, in detail). We should keep in mind this offset when comparing the stellar masses with local SDSS galaxies.
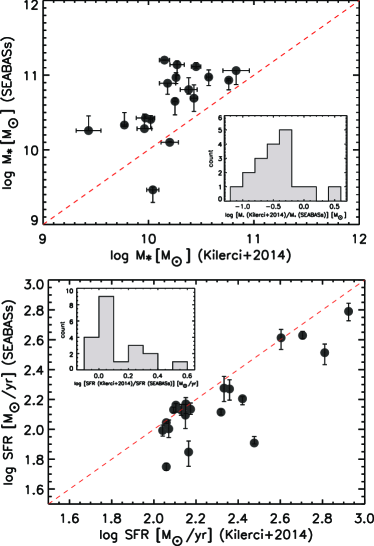
Next, we compare stellar mass and SFR with those of local ULIRGs at estimated by Kilerci, Goto, & Doi (2014). They constructed a ULIRG sample by cross-matching the AKARI FIS BSC version 1 (Yamamura et al., 2010) with the SDSS DR10 (Ahn et al., 2014). Figure 7 shows the comparison of stellar masses and SFRs derived from our method and those in Kilerci, Goto, & Doi (2014). Our estimate of SFR is roughly consistent with that in Kilerci, Goto, & Doi (2014) although we underestimate significantly SFR for some ULIRGs, while the stellar mass we estimated is obviously larger than that in Kilerci, Goto, & Doi (2014); the typical offset of stellar mass is 0.5 dex. We note that Kilerci, Goto, & Doi (2014) reported that all of the adopted stellar mass values in their work might be underestimated by 0.5 dex by comparing the derived stellar mass with previous works, which could be a possible interpretation of the discrepancy of our estimate of stellar mass. We should keep in mind this offset when comparing the stellar mass with local ULIRGs.
4.2.2 Stellar mass and SFR relation
We discuss where IR-bright DOGs lie in SFR– plane and compare it with that of the literature. We first estimated the SFR based on the IR luminosity from SF.
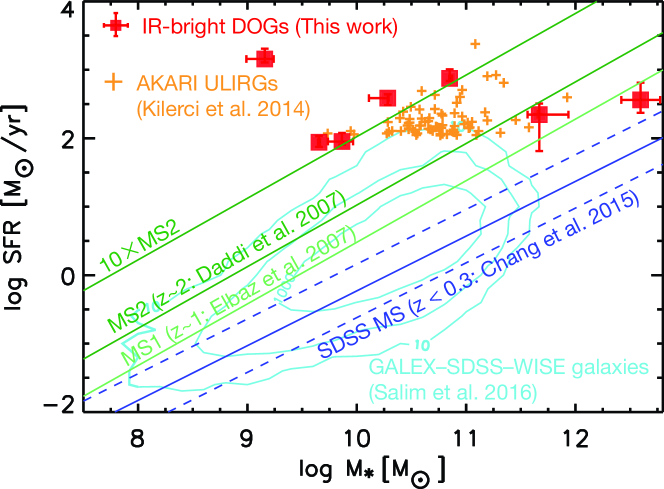
Figure 8 shows the resultant stellar mass and SFR relation for our DOG sample, the main-sequence (MS) sample for star forming galaxies selected by the SDSS and WISE (Chang et al., 2015), and selected by the Galaxy Evolution Explorer (GALEX) satellite (Martin et al., 2005), SDSS, and WISE (Salim et al., 2016). The stellar mass and SFR of the MS presented by Elbaz et al. (2007) and Daddi et al. (2007) for star forming galaxies at = 1 and 2, respectively, are also shown in Figure 8. Note that we corrected a possible offset of stellar masses discussed in Section 4.2.1 for local SDSS sample provided by (Salim et al., 2016). We remind that we corrected the stellar mass and SFR in the literature to those assumed Chabrier IMF if needed. We found that most IR-bright DOGs lie above these relations significantly although the redshift of our DOG sample is less than 1.0. They cover a locus of merger-driven starburst galaxies (e.g., Rodighiero et al., 2011), indicating that our IR-bright DOG sample detected by IRAS and/or AKARI is basically starburst galaxies. The stellar mass and SFR of a ULIRG sample presented by Kilerci, Goto, & Doi (2014) are also plotted. We also corrected a possible offset of stellar masses discussed in Section 4.2.1 for them. We found that some IR-bright DOGs have larger SFR value given a same stellar mass (although remaining objects overlapped with local ULIRGs in SFR– plane.) This is partially due to the difference of the redshift distribution; redshift of sample in Kilerci, Goto, & Doi (2014) is less than 0.5. However, it is difficult to conclude this offset is statistically robust due to small sample size, and thus it will be future work. The tendency of the large offset of IR-bright DOG from MS in SFR– plane is likely to be inconsistent with that of IR-faint DOGs (Kartaltepe et al., 2012; Riguccini et al., 2015). They reported that IR-faint DOGs with no significant AGN contribution are mainly located within the star-forming MS, although some author reported that they are widely distributed on SFR– plane (Calanog et al., 2013; Corral et al., 2016). Note that our sample is relatively low-redshift () compared with IR-faint DOG sample (). Also, the MIR flux range of them is significantly different. Taking these results into account, the SF properties of IR-bright DOGs is not necessary to same as IR-faint (i.e., classical) DOGs. This work enables us to constrain SFR– relation of previously unknown, IR-bright DOGs whose properties differ from those of classical, IR-faint DOGs, for the first time.
It should be noted that SFR– relation of MS is also related to its other physical properties such as metallicity (e.g., Mannucci et al., 2010), molecular gas fraction (e.g., Daddi et al., 2010; Sargent et al., 2014), and starburst compactness (e.g., Elbaz et al., 2011). However, a full exploitation of how each physical property of IR-bright DOGs affects the SFR– relation requires a further observation to derive each quantity, which is beyond the scope of this paper, and will be a future work. We here just discuss a possibility of that the large offset of our DOG sample from MS can be explained depending on the metallicity of IR-bright DOGs and MS. Since the dispersion of SFR and stellar mass due to the metallicity of MS is 0.2-0.4 dex (Savaglio et al., 2005; Lara-López et al., 2012), the large offset of IR-bright DOGs cannot be explained only by metallicity. Therefore, taking the redshift evolution of SFR– relation (Whitaker et al., 2012; Lee et al., 2015; Tomczak et al., 2016) and uncertainty of SFR– for MS due to the dispersion of at least metallicity into account, our IR-bright DOGs detected by IRAS and/or AKARI seems to be more specific population compared with IR-faint DOGs regarding the SFR– relation.
References
- Ahn et al. (2014) Ahn, C. P., Alexandroff, R., Allende Prieto, C., et al. 2014, ApJS, 211
- Alam et al. (2015) Alam, S., Albareti, F. D., Allende Prieto, C., et al. 2015, ApJS, 219, 12
- Beichman et al. (1988) Beichman, C. A., Neugebauer, G., Habing, H. J., Clegg, P. E., & Chester, T. J. (ed.) 1988, in Infrared Astronomical Satellite (IRAS) Catalogs and Atlases Volume 1: Explanatory Supplement (Washington, DC: NASA)
- Brinchmann et al. (2004) Brinchmann, J., Charlot, S., White, S. D. M., et al. 2004, MNRAS, 351, 1151
- Bruzual & Charlot (2003) Bruzual, G., & Charlot, S. 2003, MNRAS, 344, 1000
- Bussmann et al. (2012) Bussmann, R. S., Dey, A., Armus, L., et al. 2012, ApJ, 744, 150
- Calanog et al. (2013) Calanog, J. A., Wardlow, J., Fu, H., et al. 2013, ApJ, 775, 61
- Calzetti et al. (2000) Calzetti, D., Armus, L., Bohlin, R. C., et al. 2000, ApJ, 533, 682
- Casey et al. (2014) Casey, C. M., Narayanan, D., & Cooray, A. 2014, Physics Reports, 541, 45
- Chabrier (2003) Chabrier, G. 2003, PASP, 115, 763
- Chang et al. (2015) Chang, Y.-Y., van der Wel, A., da Cunha, E., & Rix, H.-W. 2015, ApJS, 219
- Chary & Elbaz (2001) Chary, R., & Elbaz, D. 2001, ApJ, 556, 562
- Corral et al. (2016) Corral, A., et al. 2016, A&A, 592, 109
- Cutri et al. (2014) Cutri, R. M., & et al. 2014, VizieR Online Data Catalog, 2328, 0
- Cutri et al. (2003) Cutri, R. M., Skrutskie, M. F., van Dyk, S., et al. 2003, 2MASS All Sky Catalog of point sources
- Daddi et al. (2007) Daddi, E., Dickinson, M., Morrison, G., et al. 2007, ApJ, 670, 156
- Daddi et al. (2010) Daddi, E., et al. 2010, ApJ, 714, L118
- Dey et al. (2008) Dey, A., Soifer, B. T., Desai, V., et al. 2008, ApJ, 677, 943
- Elbaz et al. (2007) Elbaz, D., Daddi, E., Le Borgne, D., et al. 2007, A&A, 468, 33
- Elbaz et al. (2011) Elbaz, D., et al. 2011, A&A533, 119
- Hamann et al. (2016) Hamann, F., Zakamska, N. L., Ross, N., et al. 2017, MNRAS, 464, 3431
- Hopkins et al. (2008) Hopkins, P. F., Hernquist, L., Cox, T. J., & Kereš, D. 2008, ApJS, 175, 356
- Ichikawa et al. (2014) Ichikawa, K., Imanishi, M., Ueda, Y., et al. 2014, ApJ, 794, 139
- Kartaltepe et al. (2012) Kartaltepe, J. S., et al. 2012, ApJ, 757, 23
- Kauffmann et al. (2003) Kauffmann, G., et al. 2003, MNRAS, 341, 54
- Kawada et al. (2007) Kawada, M., Baba, H., Barthel, P. D., et al. 2007, PASJ, 59, 389
- Kennicutt (1998) Kennicutt, R. C., Jr. 1998, ARA&A, 36, 189
- Kilerci, Goto, & Doi (2014) Kilerci Eser, E., Goto, T., & Doi, Y. 2014, ApJ, 797
- Koyama et al. (2013) Koyama, Y., Smail, I., Kurk, J., et al. 2013, MNRAS, 434, 423
- Lara-López et al. (2012) Lara-López, M. A., Bongiovanni, A., Cepa, J., et al. 2010, A&A, 519
- Lee et al. (2012) Lee, J. C., Hwang, H. S., Lee, M. G., Kim, M., & Lee, J. H. 2012, ApJ, 756, 95
- Lee et al. (2015) Lee, N., Sanders, D. B., Casey, C. M., et al. 2015, ApJ, 801
- Mannucci et al. (2010) Mannucci, F., Cresci, G., Maiolino, R., Marconi, A., & Gnerucci, A. 2010, MNRAS, 408, 2115
- Martin et al. (2005) Martin, D. C., Fanson, J., Schiminovich, D., et al. 2005, ApJ, 619, L1
- Moshir et al. (1992) Moshir, M., Kopman, G., & Conrow, T. A. O. 1992, IRAS Faint Source Survey, Explanatory Supplement Version 2 (Pasadena, CA: California Institute of Technology)
- Mullaney et al. (2011) Mullaney, J. R., Alexander, D. M., Goulding, A. D., & Hickox, R. C. 2011, MNRAS, 414, 1082
- Murakami et al. (2007) Murakami, H., Baba, H., Barthel, P., et al. 2007, PASJ, 59, 369
- Neugebauer et al. (1984) Neugebauer, G., Habing, H. J., van Duinen, R., et al. 1984, ApJ, 278, L1
- Noeske et al. (2007) Noeske, K. G., Weiner, B. J., Faber, S. M., et al. 2007, ApJ, 660, L43
- Polletta et al. (2007) Polletta, M., Tajer, M., Maraschi, L., et al. 2007, ApJ, 663, 81
- Rieke et al. (2009) Rieke, G. H., Alonso-Herrero, A., Weiner, B. J., Pérez-González, P. G., Blaylock, M., Donley, J. L., & Marcillac, D. 2009, ApJ, 692, 556
- Riguccini et al. (2015) Riguccini, L., Le Floc’h, E., Mullaney, J. R., et al. 2015, MNRAS, 452, 470
- Rodighiero et al. (2011) Rodighiero, G., Daddi, E., Baronchelli, I., et al. 2011, ApJ, 739
- Rovilos et al. (2014) Rovilos, E., Georgantopoulos, I., Akylas, A., et al. 2014, MNRAS, 438, 494
- Salim et al. (2016) Salim, S., Lee, J. C., Janowiecki, S., et al. 2016, ApJS, 227
- Salim et al. (2007) Salim, S., et al. 2007, ApJS, 173, 267
- Sanders & Mirabel (1996) Sanders, D. B., & Mirabel, I. F. 1996, ARA&A, 34, 749
- Sargent et al. (2014) Sargent, M. T., et al. 2014, ApJ, 793, 19
- Savaglio et al. (2005) Savaglio, S., Glazebrook, K., Le Borgne, D., et al. 2005, ApJ, 635, 260
- Silva et al. (2004) Silva, L., Maiolino, R., & Granato, G. L. 2004, MNRAS, 355, 973
- Skrutskie et al. (2006) Skrutskie, M. F., Cutri, R. M., Stiening, R., et al. 2006, AJ, 131, 1163
- Tacconi et al. (2008) Tacconi, L. J., et al. 2008, ApJ, 680, 246
- Taylor et al. (2005) Taylor, M. B., Britton, M., & Ebert, R. 2005, in Astronomical Data Analysis Software and Systems XIV, ed. P. Shopbell, 29
- Toba et al. (2017) Toba, Y., Nagao, T., Kajisawa, M., et al. 2017, ApJ, 835, 36
- Toba & Nagao (2016) Toba, Y., & Nagao, T. 2016, ApJ, 820, 46
- Toba et al. (2015) Toba, Y., Nagao, T., Strauss, M. A., et al. 2015, PASJ, 67, 86
- Tomczak et al. (2016) Tomczak, A. R., Quadri, R. F., Tran, K.-V. H., et al. 2016, ApJ, 817
- Tsai et al. (2015) Tsai, C.-W., Eisenhardt, P. R. M., Wu, J., et al. 2015, ApJ, 805, 90
- Whitaker et al. (2012) Whitaker, K. E., van Dokkum, P. G., Brammer, G., & Franx, M. 2012, ApJ, 754
- Wright et al. (2010) Wright, E. L., Eisenhardt, P. R. M., Mainzer, A. K., et al. 2010, AJ, 140, 1868
- Yamamura et al. (2010) Yamamura, I., Makiuti, S., Ikeda, N., et al. 2010, yCat, 2298, 0
- York et al. (2000) York, D. G., Adelman, J., Anderson, J. E., Jr., et al. 2000, AJ, 120, 1579