Identification of Candidate Millisecond Pulsars from Fermi LAT Observations II
Abstract
Following our work presented in Dai et al. (2016), we report our detailed data analysis for another 38 Fermi -ray un-associated sources. These sources are selected from the Fermi Large Area Telescope (LAT) third source catalog on the basis of the properties of known -ray millisecond pulsars (MSPs) and for the purpose of finding likely candidate MSPs. From our analysis of the LAT data, we identify that among the 38 sources, 28 of them are single point-like sources with clean background and their spectra show significant curvature. We also conduct analysis of archival X-ray data available for 24 of the 28 sources. In the fields of 10 sources, there are at least one X-ray object, and in those of the other 14 sources, no X-ray object is detected but probably due to the X-ray observations being short. We discuss the possible MSP nature for these sources. Six of them (J0514.64406, J1035.76720, J1624.24041, J1744.17619, J1946.45403, and J2039.65618) are most likely associated with pulsars because of multi-wavelength identifications including direct radio or -ray detection of pulsations. To firmly establish the associations or verify the MSP nature for other sources, deep X-ray and/or optical observations are needed.
1 Introduction
The launch of the Fermi Gamma-Ray Space Telescope (Fermi) in 2008 June marks a new era in -ray astronomy. With its unprecedented capabilities, the Large Area Telescope (LAT) onboard Fermi has allowed us to, for the first time, find large numbers of different classes of -ray sources in the sky and study their properties in detail. Using the first four-years (year 2008–2012) all-sky monitoring data obtained with LAT, more than 3000 sources in the energy range of 0.1–100 GeV have been found (Acero et al., 2015). Classification studies of these sources, those contained in the Fermi LAT third source catalog (3FGL), have confirmed the results from the surveys of the sky with previous Gamma-Ray telescopes, e.g., the Compton Gamma-Ray Observatory: the dominant class of the -ray sources is Active Galactic Nuclei (AGN; Ackermann et al. 2015) and in the Milky Way, pulsars are the majority (Abdo et al., 2013; Acero et al., 2015).
From Fermi LAT observations of pulsars, it has been learned that they have stable -ray emission and their spectra can generally be described by a power law (PL) with an exponential cutoff (Abdo et al., 2013). Such spectral properties well match the theoretical expectations for the high-energy emission mechanisms of pulsars (e.g., Muslimov & Harding 2004), and can be used for finding candidate new pulsars among the nearly 1000 3FGL sources that have not been found to be associated with any known types of high-energy objects (Acero et al., 2015). Currently more than 200 -ray pulsars have been identified111https://confluence.slac.stanford.edu/display/GLAMCOG/Public+List+of+LAT-Detected+Gamma-Ray+Pulsars, and among them more than 20 are newly discovered millisecond pulsars (MSPs). The discoveries of the significant number of new MSPs were made due to Fermi LAT’s first detection of them, so that follow-up radio and other wavelength observations could be carried out for identification.
For the purpose of finding new MSPs, we have conducted a systematic study of un-associated 3FGL sources. We have selected 101 sources from 3FGL, requiring the properties of being non-variables with curved spectra and having Galactic latitudes of 5 degrees (Dai et al. 2016; hereafter paper I). There were 24 sources with a low detection significance (average_sig6; Acero et al. 2015). No data analysis was conducted for the 24 sources because of their low detection significance: the low photon counts do not allow us to clearly determine their properties. For the remaining 77 sources, their Fermi LAT data were analyzed. From the analysis, those contaminated by extended background emission or mixed with nearby unknown sources were excluded. The further selection was conducted on the basis of the spectra we obtained. In this way, we were able to find ‘good’ candidate MSPs for follow-up identification. In Paper I, we reported our target selection, and because large amount of computing time is required for Fermi data analysis, the detailed LAT data analysis for 39 of them was presented. The sources are mostly in the Northern Hemisphere, and we were able to find 24 from them as possible candidate MSPs (which were thus taken as the targets for our follow-up observation program conducted with optical telescopes). In this paper, we report our data analysis for the other 38 sources that are in the Southern Hemisphere.
2 Fermi LAT Data Analysis
2.1 Fermi LAT Data
LAT onboard Fermi is an instrument generally carrying out an all-sky survey in the energy range from 20 MeV to 300 GeV. With its wide field-of-view and high sensitivity, -ray events are distinguished from background events through measuring the direction, energy, and arrival time of each -ray photon (Atwood et al., 2009). In our data analysis, we used the latest Pass 8 data, which were from 2008 August 4 15:43:39 to 2015 October 22 00:26:36 (UTC). We extracted data within 15 deg of a target’s position in the energy range from 200 MeV to 300 GeV, for which photons below 200 MeV were not included to avoid the relative large uncertainties of the instrument response function of the LAT in the low energy range. In addition, as recommended by the LAT team, we selected events with zenith angles less than 90 deg to exclude possible contamination from the Earth’s limb.
2.2 Maximum Likelihood Analysis
Using the newly released LAT science tools package v10r0p5, we performed a standard binned maximum likelihood analysis (Mattox et al., 1996) to the data of each target. In a source model for a target, all sources within the 20 deg region were included. The spectral parameters of these sources are provided in 3FGL, and the spectral normalization parameters of those within 5 deg from each target were set free and all the other parameters were fixed at their catalog values. For the Galactic and the extragalactic diffuse emission, we included the model gll_iem_v06.fits and spectrum file iso_P8R2_SOURCE_V6_v06.txt in the source model. The normalization parameters of the two diffuse emission components were left free.
We obtained the Test Statistic (TS) map of a 2 region centered at the position of each target. TS values are calculated from TS, where and are the maximum likelihood values for a model without and with an additional source at a specified location respectively (Abdo et al., 2010). The TS value for a given source is approximately the square of the detection significance. We examined the TS map of each target, and selected ‘clean’ sources among the targets, which we defined to be point-like sources, not mixed with other unknown sources and/or not in a region with strong extended emission (see examples in Paper I). We were able to find 29 sources as such clean sources. They are listed in Tables 1 & 2. We then ran gtfindsrc in the LAT software package to determine the positions for these 29 sources. The best-fit positions we obtained are consistent with those provided in 3FGL within error circles.
The other 9 sources, which were found not to be clean point-like sources, were excluded from our target list. For them, further data analysis to determine their properties would require large amount of computing time. Their spectral parameters in 3FGL are provided here in Table 3. Among them, six sources were fitted with a power law (PL) model,
| (1) |
where and are the normalization and photon index, respectively. The other three sources were fitted with a LogParabola model,
| (2) |
where , , and are flux density, photon index, and the curvature, respectively. The energy was set such that errors on differential fluxes were minimal, and “Signif_curve” (in Table 3) is the curvature significance estimated from likelihood values for a PL model or a LogParabola model.
2.3 Spectral Analysis
To obtain the -ray spectrum for each clean point-like source, we ran gtlike at the best-fit position determined. We evenly divided energy logarithmically from 0.1 to 300 GeV into 15 energy bands. We first modeled each source with a simple PL, with fixed at the value derived from the above. The spectral data points were obtained, but only those with TS were kept. We secondly repeated the analysis using a PL with an exponential cutoff (PLE),
| (3) |
where is the cutoff energy and GeV was set. The results from the two spectral models were compared, and the curvature significance Signif_curve was estimated from Signif_curve, where and are the maximum likelihood values modeled with PLE and PL, respectively. The analysis shows that all the sources had significant curvature except one, J0737.23233. Its spectral results are given in Table 2, indicating that a PLE model is not significantly better than a PL one. In Figure 1, its spectrum is also shown. We excluded this source from our candidate list.
2.4 Variability Analysis
We performed temporal analysis of the LAT data for the 28 remaining sources. The time period was from 2008 August 4 23:59:59 to 2015 September 30 23:59:56(UTC) and we divided it into 30-day intervals. The PL model, with photon index fixed at the value obtained in Section 2.3, was used for conducting likelihood analysis in each time bin at the best-fit position of each source. We obtained the light curves and TS curves for the sources. Consistent with the results in the LAT third source catalog, we did not find any significant flux variations in the light curves.
3 X-ray Data Analysis
The possible X-ray counterparts of the 28 candidate MSPs were searched in archival X-ray observations. We utilized publicly available X-ray observations from Swift, Chandra, XMM-Newton, and Suzaku satellites. Among the candidates, 26 of them were observed at-least once with the above mentioned observatories, and we selected the longest-exposure observation among the available datasets. However, two sources (J1744.17619 and J2039.65618; Hui et al., 2015; Salvetti et al., 2015; Romani, 2015) have been well studied in multi-wavelength and verified to likely be MSPs. These two sources were thus not included in this analysis. We used the HEASOFT package version 6.15.1 distributed by the High Energy Astrophysics Science Archive Research Center (HEASARC) for the analysis.
3.1 Data analysis
3.1.1 Swift XRT Analysis
The data for the candidate MSPs obtained with the Swift X-ray Telescope (XRT; Burrows et al., 2005) were downloaded from HEASARC. The unfiltered event files from Photon Counting (PC) mode observations were reduced using the xrtpipeline task and calibration files version 20150721 available in the Swift CALDB. The X-ray sources in the XRT images were detected from running the command detect available in the ximage. We used a detection threshold of and considered only the X-ray sources within the Fermi error circle as the possible X-ray counterparts. The exact positions of the X-ray sources detected were estimated with using the xrtcentroid task. For the possible counterparts, we extracted the source and background spectra from a circular region of radius 47 arcseconds along with the ancillary response files (ARF) and response matrix files (RMF). If there were sufficient spectral counts to perform spectral modeling, we grouped the spectra using grppha with a minimum of 20 counts per bin and adopted the statistic. For the sources with limited net counts, we used the Cash Statistic (Cash, 1979) for the spectral fitting.
For the detected X-ray sources, we tested the spectral models such as PL, blackbody (BBODY), and APEC, each combined with interstellar absorption. In all cases, we fixed the absorption column density (tbabs; Wilms et al., 2000) to the Galactic values (Kalberla et al., 2005). The spectral fitting results with an absorbed PL model are summarized in Table 4. In many cases, no X-ray source was detected, thus we estimated the upper limits on the count rates using the uplimit command in ximage. The upper limits were then converted into fluxes with the webPIMMS222http://heasarc.gsfc.nasa.gov/cgi-bin/Tools/w3pimms/w3pimms.pl used (assuming an absorbed PL model with and the absorption column density of the Galactic value). The upper limits are listed in the Table 5.
3.1.2 Chandra Analysis
The Chandra observations were analyzed using the science threads of Chandra Interactive Analysis of Observations (CIAO) version 4.6 with CALDB version 4.6.1.1. The Chandra data were reprocessed with the CIAO tool chandra_repro. We ran the celldetect task on the reprocessed event files with a detection threshold of to detect the X-ray sources. The source and background regions were extracted from a circular regions of radius 5–10 arcseconds, and we performed the specextract task in CIAO to generate the source and background spectra and the corresponding response files (ARF and RMF). The source spectra were grouped using grppha with minimum counts 20 per bin, and the spectral fitting was performed with the statistic. For the low quality spectra, we used the Cash Statistic.
3.1.3 XMM-Newton Analysis
We retrieved the observation data files from the XMM-Newton Science Archive and used the XMM-Newton Science Analysis Software (SAS) version 14.0 to analyze them. We performed standard data processing for the European Photon Imaging Camera (EPIC) pn (Strüder et al., 2001) and MOS (Turner et al., 2001) detectors with the epchain and emchain tools. The high particle background time intervals were excluded from the observations and only 0–4 pattern events from the pn and 0–12 from the two MOS detectors were selected. We ran the detection on the cleaned and filtered event files in the 0.3–10 keV energy range using the SAS task edetect_chain. As mentioned in the Section 3.1.1, we selected the X-ray sources within the Fermi error circles and extracted the source and background spectra from circular regions of radius 12–30 arcseconds. The source and background spectra, together with response and ancillary response files, were obtained using the especget task. For each source, we fitted simultaneously the pn and MOS spectra using XSPEC version 12.8.1g. The spectral modeling was performed with either the statistic or the Cash Statistic. The resulting spectral model parameters are given in Table 4.
3.1.4 Suzaku Analysis
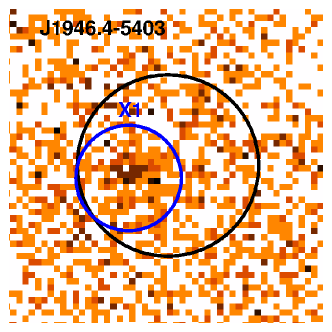
Suzaku (Mitsuda et al., 2007) observed the candidate J1946.4-5403 with its X-ray imaging spectrometer (XIS) on 2011 October 31 for an exposure time of 42.4 ks (Observation ID: 706026010). We cleaned and calibrated the unfiltered event files (XIS data) using standard filtering criteria with the specific headas tool aepipeline and calibration files (version 20130110) available in the Suzaku CALDB. The source, shown in Figure 2, and background regions were taken from a circular region of radius and the spectra, response matrices, and ancillary response files were generated using xselect for XIS0, XIS1 and XIS3. The front illuminated (FI) CCDs spectra, XIS0 and XIS3, were added using the ftool addascaspec. The co-added spectrum was then grouped to minimum counts of 20 and statistics was used for the spectral fitting.
3.2 Individual Sources
Among the 24 sources studied here, 10 of them have one or more X-ray sources within the Fermi error circle and the rest of them do not have. In the following sections, we discuss the properties of individual sources which we fitted with spectral models other than a PL.
3.2.1 J0838.82829
We have detected only one source, named as X1, for J0838.82829 in the Swift observation (ObsID: 00041343002). We examined the spectrum with an absorbed PL model and the spectral results are given in Table 4. We then added a blackbody component (BBODY) to the PL and the spectral fit was improved marginally ( 3.7 for 2 degrees of freedom [dof] at a confidence level of ). The spectral parameters, keV, , and ( =11.4/12), are consistent with those of typical MSPs (Zavlin, 2007; Marelli, 2012).
3.2.2 J0933.96232
The 43 ks Chandra ACIS-S observation detected only one X-ray source (X1) in the field of J0933.96232. The absorbed PL model did not provide a statistically acceptable fit ( =25.9/7) for the spectrum of this source. We also tried different models such as a BBODY or an APEC. In all cases, the spectral fits were worse (). Thus, we used two-component model such as a PL plus APEC model. This model gave an acceptable fit, =8.6/5, from which , keV, and . We note that Saz Parkinson et al. (2016) also analyzed the same observation, and reported the detection of X1. However, only the PL model was considered in their analysis.
3.2.3 J1119.92204
The field of J1119.92204 was observed by Swift on multiple occasions (ObsID: 00049351025 and 00049351021) and Hui et al. (2015) have reported their data analysis. Two sources were detected with Swift. XMM-Newton observed the field on 2014 June 14 for a total exposure of ks (Obs. ID: 0742930101). In the XMM-Newton observation, one additional source was detected. Among them, the source X1 had enough spectral counts, allowing detailed spectral modeling. We initially fitted the spectrum with an absorbed PL model which provides an acceptable fit, with ( =45.8/33). The addition of a blackbody component to the PL improved the spectral fit significantly, 12.5 for 2 dof at a confidence level of . The best-fit parameters are keV, , and . The parameters of X1 were consistent with those of typical MSPs (Zavlin, 2007; Marelli, 2012), while the emission from each of the other two sources (X2 and X3) favors a non-thermal case (Table 4).
3.2.4 J1624.24041
The field of J1624.2-4041 was observed by XMM-Newton for an exposure of 31 ks on 2013 August 14 (ObsID: 0722940101). We identified 8 possible X-ray sources and analyzed the spectra of these sources with an absorbed PL model. All the sources were well fitted except the source X6 (See Table 4). For X6, the PL model could provide a statistically acceptable fit (C = 8.2 for 8 dof), but resulted in an unphysically large photon index, . Therefore, the non-thermal case is not favored for this source. We tested an absorbed blackbody model. With fixed at the Galactic value , the model yielded a temperature of keV with C = 8.8 for 8 dof, which indicates a possible thermal origin for this source.
3.2.5 J1626.22428c
The deep Chandra ACIS-I observations (ObsID: 17249 and 637; Exposure times of 100.1 and 97.7 ks respectively) conducted on 2014 October 06 and 2000 May 15 covered the field of J1626.22428c. We reprocessed these long observations using standard tools in CIAO and identified two X-ray sources. The emission from the first source (X1) can be fitted by a PL model in both observations. The PL index and flux are constant within the uncertainties (see Table 4). The spectra of the source X2 cannot be described by a single component model (PL, blackbody, or APEC) or two-component models (such as a PL plus blackbody or a PL plus APEC). Thus, we attempted a broken PL model in both observations. For the 2014 October observation, the broken PL fit results in below the break energy and above the break energy with = 19.2/15. For the 2000 May observation, the broken PL provided an acceptable fit with , , and ( = 5.3/7). These spectral parameters have been widely reported for high-redshift radio loud quasars (Fabian et al., 2001; Yuan et al., 2006; D’Ammando & Orienti, 2016). Thus from the X-ray properties we can say that X2 is possibly a background quasar.
4 Results and Discussion
We have analyzed the Fermi LAT data for another 38 un-associated sources selected from 3FGL for identifying candidate MSPs. From the analysis, 29 clean point-like sources were found, while one of them, J0737.33233, was excluded as a candidate MSP since its spectrum does not show significant curvature. Among the remaining 28 sources, J2043.84801 appears to possibly have two components in its spectrum, which is shown in Figure 3. We examined its TS maps and it is consistent with being a point source. The TS maps at low and high energy ranges (e.g., 0.1–1.0 GeV and 1.0–300 GeV, respectively) were also calculated, but no evidence was found for having an additional source at the source position. Such a source needs further studies for investigating the possible nature of its emission.
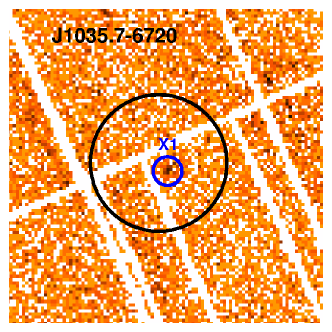
Five of the 28 sources have already been identified as likely pulsars from radio searches or -ray data analysis: J0514.64406 is probably the counterpart to PSR J05144407 (but with a spin period of 302.2 ms; Bhattacharyya et al. 2016); J1946.45403 is an MSP in a 3-hours binary (a possible black widow system; Camilo et al. 2015); J1035.76720, J1624.24041, and J1744.17619 have been found with -ray pulsations (Camilo et al., 2015). Optical and/or X-ray observations have also helped identification of possible MSP nature for several sources: J2039.65618 is very likely a redback MSP system with an orbital period of 5.4 hours (Salvetti et al., 2015; Romani, 2015); J0933.96232 (Saz Parkinson et al. 2016 and this work) and J1119.92204 (2FGL J1120.02204; Guillemot et al. 2012; Hui et al. 2015; this work) were found with possible X-ray counterparts and suggested to likely be MSPs. These sources are marked as ‘c-MSP’ in Table 1. In addition we note in Camilo et al. (2015), 13 of our candidates are listed as their targets for searching for radio pulsars, although thus far no radio pulsation signals have been found yet. These studies strongly support our data analysis results.
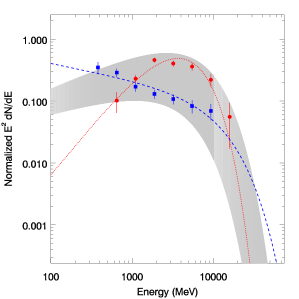
MSPs generally have -ray spectra with and in the ranges of 0.4–2.0 and 1.1–5.4 GeV respectively (see Abdo et al. 2013 for details). Recently, Xing & Wang (2016) have analyzed the spectra of 39 MSPs listed in the second Fermi -ray pulsar catalog and obtained the spectral ranges of –1.64 and –4.65 GeV (3) from fitting their spectra with a PLE model. If we consider the range, which is relatively well determined, five sources have their values out of the range, especially the sources J1539.23324 and J1626.22428c that have the parameters of , GeV and , GeV, respectively. For this reason, we tentatively suggest that the five sources are not MSPs, marked with ‘N’ in Table 1. The spectra of J1539.23324 and J1626.22428c are shown as an example in Figure 4. The first source has been searched in X-ray data as a candidate MSP but no possible counterpart was found (Hui et al., 2015) and is listed as a candidate blazar in the Fermi third AGN catalog (Ackermann et al., 2015). The second one, with a larger value, is possibly associated with the blazar PMN J16262426 (Ackermann et al., 2015). However if this is the case, none of the two X-ray sources reported in Section 3.2.5 would be the counterpart because of the position mismatch (Griffith & Wright, 1993). On the other hand, the other three ‘N’ sources include J0933.96232, which is considered as a promising MSP candidate. Whether the range derived in Xing & Wang (2016) is a reliable criterion for excluding non-MSP sources will be tested, once the nature of such ‘N’ sources are identified.
We have analyzed archival X-ray data that were available for 24 of our selected candidate MSPs. In the fields of 10 of them, at least one object was detected. For the likely pulsars J1035.76720, J1624.24041, and J1946.45403, the spectra of the objects are consistent with being a non-thermal PL with photon indices of –3. In addition, the flux ratios between their -ray 0.1–100 GeV flux () and the X-ray fluxes of the detected objects are in a range of 100–1000, also consistent with that of the most known -ray pulsars (Abdo et al., 2013). Both properties suggest that the X-ray objects, particularly in the fields of J1035.76720 and J1946.45403 (containing only one object), are likely the counterparts. While detailed X-ray studies of the objects in the fields of J0933.96232 and J1119.92204 have been previously conducted, our analysis of the different sets of X-ray data have confirmed the previous results. In order to identify the X-ray objects in each source field and possibly verify their pulsar nature, optical observations of them for searching for variability can be the next step. Nearly 70% of the Fermi -ray MSPs are in a binary (e.g., Abdo et al. 2013; Camilo et al. 2015). Since the companions of MSP binaries are irradiated by pulsar winds, they may show significant orbital modulation at optical bands, thus revealing their pulsar binary nature (e.g., Romani 2015). Finally 14 of our selected candidates were not detected with any X-ray objects in their fields, the reason for which is probably because the X-ray observations were not sufficiently deep. The lower limits on the -ray–to–X-ray flux ratios are only as large as 100 (see Table 5). Deep X-ray observations are needed in order for finding X-ray objects and thus allowing further multi-wavelength studies.
As a summary for this systematic study, we have selected 101 sources from the Fermi 3FGL un-associated sources on the basis of the properties of the known -ray MSPs and conducted detailed LAT data analysis for 77 of them that were detected with a detection significance of . Our analysis indicates that 52 sources are point-like without strong background contamination and their emission is well described by a PLE model. A few of the 52 sources have already been studied at multiwavelengths and shown to be likely pulsars. We consider the remaining ones as good candidate MSPs for follow-up identification studies. For 44 of these candidates, we have conducted analysis of the archival X-ray observations. We have obtained spectral properties of the X-ray objects detected in the fields of 14 candidates, and derived flux upper limits for the other 30 candidates that did not have any X-ray objects detected in their fields (Paper I and this work). The X-ray study results generally support their pulsar nature. Finally we note that approximately 10 of our candidates (excluding those already identified as pulsars) are also listed as promising dark matter subhalo candidates (marked with c-subhalo in Table 1; see also Paper I) in Bertoni et al. (2015). This possibility certainly makes the candidates as more interesting targets for follow-up studies.
References
- Abdo et al. (2010) Abdo, A. A., Ackermann, M., Ajello, M., et al. 2010, ApJS, 188, 405
- Abdo et al. (2013) Abdo, A. A., Ajello, M., Allafort, A., et al. 2013, ApJS, 208, 17
- Acero et al. (2015) Acero, F., Ackermann, M., Ajello, M., et al. 2015, ApJS, 218, 23
- Ackermann et al. (2015) Ackermann, M., et al. 2015, Astrophys. J., 810, 14
- Ackermann et al. (2015) Ackermann, M., Ajello, M., Atwood, W. B., et al. 2015, ApJ, 810, 14
- Atwood et al. (2009) Atwood, W. B., Abdo, A. A., Ackermann, M., et al. 2009, ApJ, 697, 1071
- Bertoni et al. (2015) Bertoni, B., Hooper, D., & Linden, T. 2015, J. Cosmology Astropart. Phys, 12, 035
- Bhattacharyya et al. (2016) Bhattacharyya, B., Cooper, S., Malenta, M., et al. 2016, ApJ, 817, 130
- Burrows et al. (2005) Burrows, D. N., Hill, J. E., Nousek, J. A., et al. 2005, Space Sci. Rev., 120, 165
- Camilo et al. (2015) Camilo, F., Kerr, M., Ray, P. S., et al. 2015, ApJ, 810, 85
- Cash (1979) Cash, W. 1979, ApJ, 228, 939
- Dai et al. (2016) Dai, X.-J., Wang, Z.-X., Vadakkumthani, J., & Xing, Y. 2016, Research in Astronomy and Astrophysics, 16, 012
- D’Ammando & Orienti (2016) D’Ammando, F., & Orienti, M. 2016, MNRAS, 455, 1881
- Fabian et al. (2001) Fabian, A. C., Celotti, A., Iwasawa, K., et al. 2001, MNRAS, 323, 373
- Griffith & Wright (1993) Griffith, M. R., & Wright, A. E. 1993, AJ, 105, 1666
- Guillemot et al. (2012) Guillemot, L., Freire, P. C. C., Cognard, I., et al. 2012, MNRAS, 422, 1294
- Hui et al. (2015) Hui, C. Y., Park, S. M., Hu, C. P., et al. 2015, ApJ, 809, 68
- Kalberla et al. (2005) Kalberla, P. M. W., Burton, W. B., Hartmann, D., et al. 2005, A&A, 440, 775
- Marelli (2012) Marelli, M. 2012, ArXiv e-prints
- Mattox et al. (1996) Mattox, J. R., Bertsch, D. L., Chiang, J., et al. 1996, ApJ, 461, 396
- Mitsuda et al. (2007) Mitsuda, K., Bautz, M., Inoue, H., et al. 2007, PASJ, 59, 1
- Muslimov & Harding (2004) Muslimov, A. G., & Harding, A. K. 2004, ApJ, 606, 1143
- Romani (2015) Romani, R. W. 2015, ApJ, 812, L24
- Salvetti et al. (2015) Salvetti, D., Mignani, R. P., De Luca, A., et al. 2015, ApJ, 814, 88
- Saz Parkinson et al. (2016) Saz Parkinson, P. M., Xu, H., Yu, P. L. H., et al. 2016, ApJ, 820, 8
- Strüder et al. (2001) Strüder, L., Briel, U., Dennerl, K., et al. 2001, A&A, 365, L18
- Turner et al. (2001) Turner, M. J. L., Abbey, A., Arnaud, M., et al. 2001, A&A, 365, L27
- Wilms et al. (2000) Wilms, J., Allen, A., & McCray, R. 2000, ApJ, 542, 914
- Xing & Wang (2016) Xing, Y., & Wang, Z. 2016, ApJ, 831, 143
- Yuan et al. (2006) Yuan, W., Fabian, A. C., Worsley, M. A., & McMahon, R. G. 2006, MNRAS, 368, 985
- Zavlin (2007) Zavlin, V. E. 2007, Ap&SS, 308, 297
| Source name | Spectra model | Flux/ | Ec | TS | Signif_Curve | Comments | |
|---|---|---|---|---|---|---|---|
| (photons cm-2 s-1) | (GeV) | () | |||||
| J0048.16343 | PowerLaw | 1.5 0.3 | 2.1 0.1 | 87 | 3.48 | ||
| PLSuperExpCutoff | 0.8 0.3 | 0.7 0.9 | 2 2 | 98 | |||
| J0514.64406 | PowerLaw | 5.9 0.5 | 2.58 0.07 | 261 | 7.72 | c-MSP | |
| PLSuperExpCutoff | 4.3 0.6 | 0.5 0.5 | 0.5 0.1 | 315 | |||
| J0802.35610 | PowerLaw | 9.0 0.7 | 2.39 0.06 | 332 | 7.10 | ||
| PLSuperExpCutoff | 7.3 0.7 | 1.4 0.2 | 1.5 0.4 | 382 | |||
| J0838.82829 | PowerLaw | 7.3 0.6 | 2.58 0.07 | 482 | 5.11 | ||
| PLSuperExpCutoff | 5.8 0.6 | 1.6 0.1 | 6 2 | 506 | |||
| J0933.96232 | PowerLaw | 10.1 0.6 | 2.03 0.04 | 842 | 12.72 | c-MSP | |
| PLSuperExpCutoff | 6.0 0.6 | 0.6 0.2 | 1.9 0.3 | 996 | N | ||
| J0954.83948 | PowerLaw | 15.6 0.8 | 2.60 0.05 | 696 | 4.26 | ||
| PLSuperExpCutoff | 14.7 0.9 | 2.2 0.1 | 4 1 | 712 | N | ||
| J1035.76720 | PowerLaw | 18.7 0.3 | 2.19 0.01 | 1493 | 12.84 | c-MSP | |
| PLSuperExpCutoff | 14.4 0.8 | 1.3 0.1 | 2.2 0.3 | 1637 | |||
| J1119.92204 | PowerLaw | 17.2 0.7 | 2.24 0.03 | 2114 | 12.57 | c-MSP c-subhalo | |
| PLSuperExpCutoff | 13.7 0.7 | 1.3 0.1 | 1.7 0.2 | 2262 | |||
| J1231.65113 | PowerLaw | 13.8 0.9 | 2.70 0.06 | 461 | 6.25 | ||
| PLSuperExpCutoff | 12.0 0.9 | 1.7 0.2 | 1.1 0.3 | 492 | |||
| J1400.22413 | PowerLaw | 3.4 0.5 | 2.15 0.08 | 169 | 5.95 | ||
| PLSuperExpCutoff | 1.8 0.2 | 0.7 0.4 | 1.7 0.5 | 204 | |||
| J1539.23324 | PowerLaw | 6.5 0.5 | 1.89 0.04 | 581 | 12.35 | c-AGN | |
| PLSuperExpCutoff | 3.5 0.4 | 0.4 0.2 | 2.2 0.3 | 733 | N | ||
| J1544.12555 | PowerLaw | 7.9 0.7 | 2.36 0.06 | 265 | 6.17 | ||
| PLSuperExpCutoff | 6.1 0.7 | 1.5 0.2 | 2.2 0.6 | 300 | |||
| J1624.24041 | PowerLaw | 27 1 | 2.36 0.03 | 1049 | 9.61 | c-MSP | |
| PLSuperExpCutoff | 19.7 0.9 | 1.58 0.04 | 2.8 0.1 | 1082 | |||
| J1626.22428c | PowerLaw | 26 3 | 2.50 0.05 | 587 | 3.17 | c-AGN | |
| PLSuperExpCutoff | 23 3 | 2.3 0.1 | 10 5 | 542 | N | ||
| J1645.72149 | PowerLaw | 10 1 | 2.54 0.07 | 176 | 3.68 | ||
| PLSuperExpCutoff | 9 1 | 1.9 0.3 | 2 1 | 188 | |||
| J1649.63007 | PowerLaw | 7.1 0.8 | 2.24 0.06 | 208 | 6.23 | ||
| PLSuperExpCutoff | 4.2 0.8 | 1.2 0.3 | 2.6 0.7 | 244 | |||
| J1702.85656 | PowerLaw | 34 1 | 2.53 0.03 | 2209 | 6.65 | ||
| PLSuperExpCutoff | 32 1 | 2.21 0.07 | 5 1 | 2228 | N | ||
| J1744.17619 | PowerLaw | 18.5 0.7 | 2.15 0.03 | 2023 | 14.72 | c-MSP | |
| PLSuperExpCutoff | 13.6 0.8 | 1.1 0.1 | 1.9 0.2 | 2211 | |||
| J1753.64447 | PowerLaw | 7.5 0.7 | 2.24 0.06 | 250 | 6.10 | ||
| PLSuperExpCutoff | 5.0 0.7 | 1.2 0.3 | 2.1 0.6 | 286 | |||
| J1757.76030 | PowerLaw | 2.6 0.4 | 2.00 0.08 | 160 | 5.14 | ||
| PLSuperExpCutoff | 1.2 0.3 | 0.8 0.4 | 4 1 | 187 | |||
| J1808.33357 | PowerLaw | 10 1 | 2.43 0.06 | 186 | 7.39 | ||
| PLSuperExpCutoff | 6.9 0.8 | 1.1 0.2 | 1.3 0.2 | 237 | |||
| J1831.66503 | PowerLaw | 3.2 0.4 | 2.08 0.07 | 177 | 6.12 | ||
| PLSuperExpCutoff | 1.7 0.4 | 0.6 0.4 | 2.0 0.7 | 213 | |||
| J1946.45403 | PowerLaw | 8.9 0.5 | 2.20 0.04 | 795 | 11.49 | c-MSP | |
| PLSuperExpCutoff | 6.2 0.5 | 0.8 0.2 | 1.3 0.2 | 927 | |||
| J2039.65618 | PowerLaw | 13.0 0.6 | 2.17 0.03 | 1517 | 8.59 | c-MSP | |
| PLSuperExpCutoff | 10.6 0.7 | 1.61 0.09 | 4.4 0.8 | 1571 | |||
| J2043.84801 | PowerLaw | 3.6 0.5 | 2.20 0.08 | 189 | 5.85 | ||
| PLSuperExpCutoff | 2.0 0.4 | 0.8 0.4 | 1.8 0.5 | 221 | |||
| J2112.53044 | PowerLaw | 13.5 0.6 | 2.01 0.03 | 2053 | 13.54 | c-subhalo | |
| PLSuperExpCutoff | 9.7 0.6 | 1.1 0.1 | 3.0 0.4 | 2237 | |||
| J2131.16625 | PowerLaw | 5.1 0.5 | 2.42 0.08 | 243 | 4.12 | ||
| PLSuperExpCutoff | 4.0 0.6 | 1.6 0.3 | 2.3 0.8 | 258 | |||
| J2133.06433 | PowerLaw | 5.4 0.6 | 2.27 0.07 | 283 | 6.31 | c-subhalo | |
| PLSuperExpCutoff | 3.6 0.5 | 1.1 0.3 | 1.7 0.5 | 311 |
| Source name | Spectra model | Flux/ | Ec | TS | Signif_Curve | |
|---|---|---|---|---|---|---|
| (photon cm-2 s-1) | (GeV) | () | ||||
| J0737.2-3233 | PowerLaw | 14 1 | 2.53 0.06 | 326 | 2.87 | |
| PLSuperExpCutoff | 13 1 | 2.1 0.2 | 3 1 | 330 |
| Source name | Spectra model | Flux density/10-12 | E0 | Signif_Avg | Signif_Curve | ||
|---|---|---|---|---|---|---|---|
| (photon cm-2MeV-1s-1) | (MeV) | () | () | ||||
| J0456.26924 | PowerLaw | 0.88 0.10 | 2.3 | 1057 | 9.9 | 3.6 | |
| J0816.15044 | PowerLaw | 2.40 0.32 | 2.5 | 771 | 7.75 | 3.6 | |
| J0905.82127 | PowerLaw | 4.93 0.75 | 2.7 | 477 | 6.6 | 3.3 | |
| J1256.15703 | PowerLaw | 5.16 0.77 | 2.7 | 544 | 6.4 | 3.3 | |
| J1408.02924 | PowerLaw | 6.46 0.87 | 2.7 | 419 | 7.4 | 3.3 | |
| J1820.43217 | PowerLaw | 1.00 0.16 | 2.3 | 1011 | 6.2 | 3.3 | |
| Source Name | Spectra Model | Flux_Density | Eb | Signif_Avg | Signif_Curve | ||
| (photon cm-2MeV-1s-1) | (MeV) | ||||||
| J1128.65434 | LogParabola | 29.1 3.4 | 2.56 | 0.94 | 336 | 8.5 | 4.2 |
| J1557.04225 | LogParabola | 35.3 3.7 | 2.33 | 0.55 | 369 | 11.5 | 4.4 |
| J1729.72408 | LogParabola | 16.6 1.7 | 2.47 | 0.40 | 567 | 11.7 | 4.4 |
| Source | Data | ObsID | Exp | X-ray | R.A. | Dec. | GXr () | ||||
|---|---|---|---|---|---|---|---|---|---|---|---|
| (ks) | Source | (h:m:s) | () | () | () | ||||||
| J0802.3 | XMM | 0691980301 | 18.1 | X1 | 8:02:16.56 | -56:11:51.00 | 1.50 | 11.4/4(C) | 1333 (8.8) | ||
| X2 | 8:02:08.64 | -56:12:13.68 | 1.50 | 0.9/5 (C) | 336 | ||||||
| X3 | 8:02:13.92 | -56:13:21.36 | 1.50 | 2.3/4(C) | 374 | ||||||
| X4 | 8:01:59.04 | -56:11:24.00 | 1.50 | 0.2/2(C) | 277 | ||||||
| X5 | 8:02:19.20 | -56:14:37.32 | 1.50 | 2.2/2(C) | 308 | ||||||
| J0838.8 | Swift | 00041343002 | 4.2 | X1 | 8:38:43.20 | -28:27:01.45 | 1.39 | 15.1/14 | 2 (9.4) | ||
| J0933.9 | Chandra | 14813 | 43.6 | X1 | 9:34:00.58 | -62:33:52.44 | 2.04 | 25.9/7* | (12) | ||
| J0954.8 | Swift | 00031664001 | 3.6 | X1 | 9:55:27.78 | -39:47:49.84 | 1.35 | 1.4/3(C) | 16 (17) | ||
| J1035.7 | XMM | 0692830201 | 24.9 | X1 | 10:35:27.60 | -67:20:15.36 | 1.80 | 11.7/14(C) | 781 (21) | ||
| J1119.9 | XMM | 0742930101 | 73.6 | X1 | 11:19:58.08 | -22:04:57.00 | 0.37 | 45.8/33 | 128 (18) | ||
| X2 | 11:20:01.68 | -22:04:55.92 | 0.37 | 3.4/8 | 343 | ||||||
| X3 | 11:19:59.04 | -22:03:15.48 | 0.37 | 3.3/3(C) | 1607 | ||||||
| J1624.2 | XMM | 0722940101 | 31.0 | X1 | 16:24:09.84 | -40:44:25.08 | 2.60 | 4.8/7(C) | 567 (27) | ||
| X2 | 16:24:07.68 | -40:44:37.32 | 2.60 | 9.2/6(C) | 1216 | ||||||
| X3 | 16:24:02.16 | -40:45:44.28 | 2.60 | 10.8/6(C) | 1055 | ||||||
| X4 | 16:24:15.12 | -40:47:12.48 | 2.60 | 8.8/8(C) | 1406 | ||||||
| X5 | 16:24:09.36 | -40:42:38.88 | 2.60 | 10.4/8(C) | 2755 | ||||||
| X6 | 16:24:04.56 | -40:47:20.76 | 2.60 | 8.2/8(C) | 78 | ||||||
| X7 | 16:24:12.48 | -40:47:57.12 | 2.60 | 4.9/8(C) | 714 | ||||||
| X8 | 16:24:26.16 | -40:45:40.32 | 2.60 | 15.7/7(C) | 2328 | ||||||
| J1626.2 | Chandra | 17249 | 100.0 | X1 | 16:26:48.49 | -24:28:38.91 | 1.34 | 7.5/6(C) | 845 (29) | ||
| X2 | 16:26:40.49 | -24:27:15.13 | 1.34 | 59.0/17* | |||||||
| 637 | 97.7 | X1 | 16:26:48.41 | -24:28:36.93 | 1.34 | 9.6/6(C) | 1361 | ||||
| X2 | 16:26:40.48 | -24:27:14.60 | 1.34 | 23.5/9* | |||||||
| J1946.4 | Suzaku | 706026010 | 42.4 | X1 | 19:46:33.82 | -54:02:37.23 | 0.37 | 23.7/18 | 72 (9.2) | ||
| J2112.5 | XMM | 0672990201 | 33.8 | X1 | 21:12:32.16 | -30:44:04.92 | 0.66 | 7.7/5 | 1284 (19) |
Notes:* denotes the cases where the reduced and we tried other spectral models. (1) Source Name; (2) Data; (3) ID of the observations; (4) Exposure time in kilo-seconds for each observation; (5) X-ray sources in the error circle; (6)–(7) Right Ascension (R.A.; J2000.0) and Declination (Dec.; J2000.0); 8) Galactic absorption column density in units of ; (9) Photon index; (10) Unabsorbed flux in 0.3-10 keV band in units of ; (11) value for the model, where C-statistics is indicated by C.; (12) -ray to X-ray flux ratios (GXr) for each candidate MSP with X-ray sources detected in the field, where the -ray 0.1–100 GeV flux () of each candidate MSP, in units of , is given in parentheses.
| Src | R.A. | Dec. | Data | ObsID | Exp | CR | ||||
|---|---|---|---|---|---|---|---|---|---|---|
| Name | (deg) | (deg) | Time | () | () | () | () | |||
| J0048.16343 | 12.21070306 | -63.76885597 | Swift | 00047132001 | 3099 | 1.97 | 1.7 | |||
| J1231.65113 | 187.9228875 | -51.2445342 | Swift | 00041384001 | 3602 | 13.90 | 12 | |||
| J1400.22413 | 210.0116122 | -24.2486119 | Swift | 00047217004 | 2186 | 5.33 | 3.4 | |||
| J1539.23324 | 234.8356327 | -33.41744465 | Swift | 00048054023 | 15084 | 9.06 | 1.0 | |||
| J1544.12555 | 236.0585575 | -25.9120224 | Swift | 00085021004 | 993 | 11.00 | 7.9 | |||
| J1649.63007 | 252.4595489 | -30.1831453 | Swift | 00085034001 | 4155 | 15.90 | 7.1 | |||
| J1702.85656 | 255.6861421 | -56.91435142 | Swift | 00041424001 | 1214 | 11.30 | 37 | |||
| J1753.64447 | 268.3488964 | -44.76971147 | Swift | 00047264001 | 1567 | 13.20 | 7.6 | |||
| J1757.76030 | 269.4143008 | -60.55432813 | Swift | 00047265005 | 1994 | 7.19 | 3.7 | |||
| J1808.33357 | 272.1154608 | -33.86901995 | Swift | 00047271002 | 7123 | 18.10 | 8.7 | |||
| J1831.66503 | 277.7440476 | -65.06402308 | Swift | 00047281002 | 1704 | 6.70 | 3.7 | |||
| J2043.84801 | 310.9822976 | -48.02857435 | Swift | 00047307004 | 1116 | 2.83 | 3.6 | |||
| J2131.16625 | 322.7121318 | -66.40198989 | Swift | 00085130006 | 845 | 2.44 | 4.9 | |||
| J2133.06433 | 323.3171713 | -64.53428129 | Swift | 00047316004 | 3357 | 3.09 | 5.1 |
Notes:(1) Source Name; (2)-(3) Right Ascension (R.A.; J2000.0) and Declination (Dec.; J2000.0) of each source; (4) Data; (5) ID of Observation used in the analysis; (6) Exposure time in seconds for each observation; (7) upper limit of count rate in unit of (8) Galactic absorption column density in ; (9) upper limit of flux in 0.3-10 keV band in units of ; (10) -ray 0.1–100 GeV flux; (11) Lower limit on the -ray to X-ray flux ratio.