Discovery of Scattering Polarization in the Hydrogen Lyman- Line of the Solar Disk Radiation
Abstract
There is a thin transition region (TR) in the solar atmosphere where the temperature rises from 10,000 K in the chromosphere to millions of degrees in the corona. Little is known about the mechanisms that dominate this enigmatic region other than the magnetic field plays a key role. The magnetism of the TR can only be detected by polarimetric measurements of a few ultraviolet (UV) spectral lines, the Lyman- line of neutral hydrogen at 121.6 nm (the strongest line of the solar UV spectrum) being of particular interest given its sensitivity to the Hanle effect (the magnetic-field-induced modification of the scattering line polarization). We report the discovery of linear polarization produced by scattering processes in the Lyman- line, obtained with the Chromospheric Lyman-Alpha Spectro-Polarimeter (CLASP) rocket experiment. The Stokes profiles observed by CLASP in quiet regions of the solar disk show that the and linear polarization signals are of the order of 0.1 % in the line core and up to a few percent in the nearby wings, and that both have conspicuous spatial variations with scales of arcsec. These observations help constrain theoretical models of the chromosphere–corona TR and extrapolations of the magnetic field from photospheric magnetograms. In fact, the observed spatial variation from disk to limb of polarization at the line core and wings already challenge the predictions from three-dimensional magnetohydrodynamical models of the upper solar chromosphere.
1 Introduction
The upper layers of the solar chromosphere, and the transition region (TR) in particular, are key to understanding several of the most fundamental problems in astrophysics such as the source of the solar wind, the energization of the corona, or the acceleration of energetic particles (e.g., Priest, 2014). Most of what we know about this puzzling atmospheric region has been learned from ground-based observations in the H line (e.g., Kneer, 2010; Rutten & Rouppe van der Voort, 2017) and by combining space-based observations of the radiation intensity in ultraviolet (UV) spectral lines and magnetohydrodynamical numerical simulations (e.g., Hansteen et al., 2014; Pereira et al., 2014). Yet, we lack quantitative information on the single most important physical parameter: its magnetic field. To explore the magnetic field of the upper solar chromosphere and TR requires spectropolarimetry, i.e., the ability to detect the polarization state of photons in magnetically sensitive spectral lines, at UV wavelengths where photons are relatively scarce. In particular, the magnetic field of the rarified plasma of the chromosphere–corona TR can be probed only through a handful of UV spectral lines sensitive to the Hanle effect (the magnetic-field-induced modification of the line scattering polarization; see Landi Degl’Innocenti & Landolfi, 2004), but their observation and modeling are not easy (e.g., Trujillo Bueno, 2014). On the one hand, these wavelengths cannot be observed from the ground, which poses a clear instrumental and observational challenge; on the other, the formation of the polarization profiles of these lines involves complex atomic and radiative mechanisms whose impact is only known theoretically, since the physical conditions of the TR are not accessible in terrestrial laboratories. These difficulties have left the strength and geometry of the magnetic field in the numerical models of the upper solar chromosphere largely unconstrained. Unable to directly confront models to observable quantities sensitive to the magnetic field, complex extrapolations of solar surface magnetograms are instead used, which are problematic because they are difficult or impossible to validate against actual observations (e.g., De Rosa et al., 2009).
The dominant spectral feature in the UV solar spectrum is the hydrogen Lyman- emission line at 121.6 nm, which forms all through the upper chromosphere and in the TR. This resonance line is dominated by scattering, and hence it could show a linear polarization pattern sensitive to the geometry of the formation region and to the presence of magnetic fields through the Hanle effect. A first—and for almost 40 years, only—attempt to detect solar limb polarization in this line using a slit-less spectropolarimeter failed, presumably due to in-flight degradation of its efficiency (Stenflo et al., 1980). Recent theoretical work has predicted that in models of the solar atmosphere, with magnetic fields between 10 and 100 Gauss, the measurable level of linear polarization in the Lyman- radiation of the solar disk should be of the order of 0.1 % in the line core and up to a few percent in the nearby wings (Trujillo Bueno et al., 2011; Belluzzi et al., 2012; Štěpán et al., 2015).
In order to achieve the first measurement of the linear polarization produced by scattering processes in the hydrogen Lyman- line radiation of the solar disk, we have developed the Chromospheric Lyman-Alpha Spectro-Polarimeter (CLASP; Kano et al., 2012; Kobayashi et al., 2012). CLASP was successfully launched from White Sands Missile Range by a NASA sounding rocket on 2015 September 3, and the aim of this Letter is to show and discuss the results of these unprecedented spectropolarimetric observations.
2 The instrument
The CLASP (Narukage et al., 2015, 2017) consists of a Cassegrain telescope with an aperture of 27 cm; a spectropolarimeter to measure the wavelength variation of the Stokes , and profiles along the 400 arcsec covered by the spectrograph’s slit (nearly half the solar radius); and a slit-jaw optical system to take fast-cadence (0.6 sec) chromospheric images with a Lyman- broadband filter (FWHM=7 nm). The spectropolarimeter uses a rotating half-waveplate for the Lyman- wavelength (Ishikawa et al., 2013, 2015), located in front of the slit, which modulates the polarization of the incident radiation 4 times per rotation (one rotation takes 4.8 s). It also uses a single concave diffraction grating, mounted in the inverse Wadsworth configuration, which serves both as the spectral dispersion element and beam splitter (Narukage et al., 2015). Each of the resulting optically symmetric channels goes through a linear-polarization analyzer mounted from each other to simultaneously measure two orthogonal polarization states. From the observed signals in both channels, we derive the wavelength variation of the Stokes profile and of the fractional polarization ( and ) applying dual channel demodulation (Ishikawa et al., 2014), with plate scales of 0.0048 nm pixel-1 and 1.1 arcsec pixel-1. Additionally, since the rotating half-waveplate was located in front of the slit and the fold mirror of the slit-jaw system behaved as a partial linear polarizer, the CLASP slit-jaw system itself also provided images of the broadband fractional polarization, in addition to the intensity images mentioned above.
3 Observational Results
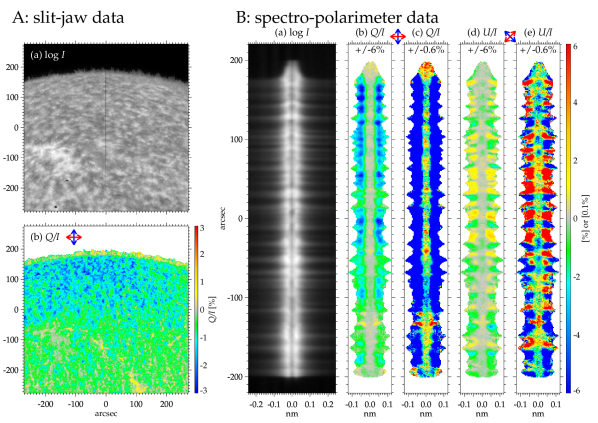
During its ballistic flight on 2015 September 3, CLASP observed first a quiet region at the solar disk center during 17:02:53–17:03:09UT in order to quantify the instrumental polarization, and we confirmed that the spurious polarization is one order of magnitude smaller than 0.1 % (Giono et al., 2016, 2017). Afterward, during 17:03:36–17:08:25UT, CLASP observed relatively quiet regions of the Sun (Figure 1(Aa)), with the slit oriented radially from 20 arcsec off-limb toward the disk center.
Figure 1(B) shows the wavelength variation of Stokes , and measured by CLASP at each pixel along the slit. The intensity emission profile shows significant spatial fluctuations on scales 10 arcsec, which essentially corresponds to the chromospheric network that results from intense photospheric magnetic field concentrations and related heating events: bright in the network and dark in the internetwork (Figure 1(Aa); see also Kubo et al., 2016). In the wings, is negative (the linear polarization is perpendicular to the limb) with amplitudes larger than 1 % and increasing up to % toward the limb (i.e., with a very clear center-to-limb variation, hereafter CLV). The wing signals are also very significant ( %), with positive and negative values fluctuating around zero on spatial scales of 10 arcsec; they are a clear observational signature of the breaking of the axial symmetry (around the solar local vertical) of the Lyman- radiation in the solar chromosphere, caused by the horizontal atmospheric inhomogeneities of the solar chromospheric plasma. At the line center, the and signals on the solar disk are 0.1 %, and fluctuating around zero on spatial scales of 10 arcsec. However, at the off-limb positions sampled by the spectrograph’s slit the line-center signals are predominantly positive (parallel to the solar limb) with amplitudes of about %. Note that although weak ( 0.1 %), the measured and line-core signals are an order of magnitude larger than the instrumental polarization level (Ishikawa et al., 2014; Giono et al., 2016, 2017) of CLASP.
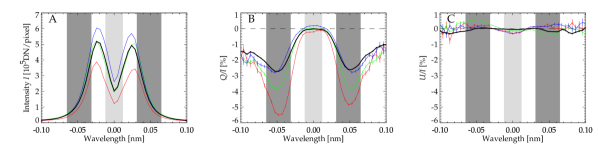
The overall shape of the profiles (Figure 2), as well as the very significant negative signals in the wings and their clear CLV (Figures 1(B) and 3), are essentially consistent with the theoretical predictions (Belluzzi et al., 2012). The and line-center amplitudes ( %) also follow the theoretical expectations for moderate ( arcsec) spatial resolution observations (Trujillo Bueno et al., 2011; Štěpán et al., 2015), such as those obtained by CLASP. However, the line-center signals do not show any clear CLV, in marked contrast with the results of radiative transfer calculations in one-dimensional (1D) and three-dimensional (3D) models of the solar atmosphere (Trujillo Bueno et al., 2011; Štěpán et al., 2015).
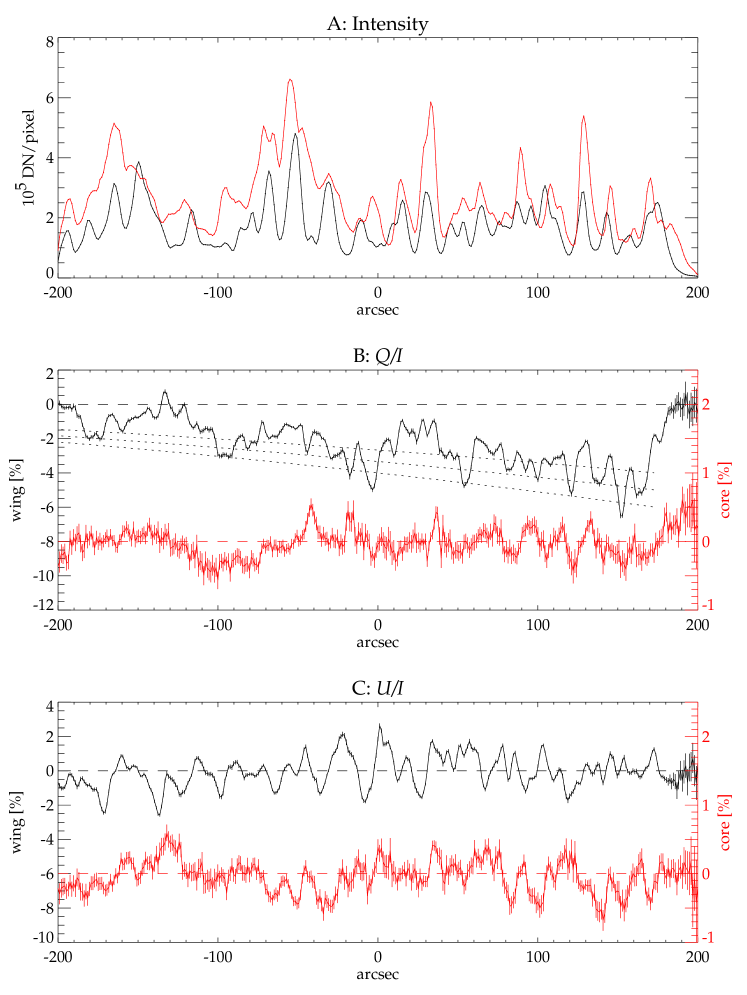
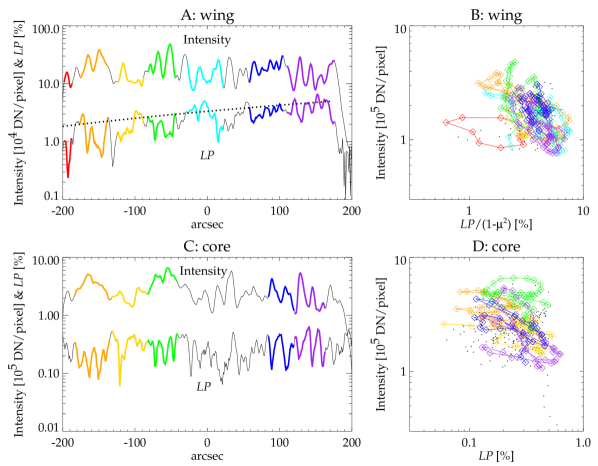
Spatial fluctuations on scales of arcsec are seen both in intensity () and linear polarization (, ). Maxima and minima of intensity along the slit in the line core are systematically shifted from those in the wings (Figure 3), the shift becoming more pronounced closer to the limb (especially at slit locations above 100 arcsec). This effect is due to the different optical depths in the core and wings, and hence to the different geometrical heights they sample (higher in the core, deeper in the wings). Interestingly, maxima of intensity often match minima of total linear polarization () on the Lyman- wings and vice versa, as shown by the colored segments in Figure 4(A). The anticorrelation between and LP is even more noticeable after removing from LP its CLV, proportional to . In some places, even in the Lyman- line core, LP is anti-correlated with the intensity (Figure 4(C)). The fact that regions with lower line intensity are, on average, more polarized than the high-intensity regions had been predicted by radiative transfer investigations of the Lyman- scattering polarization in 3D models of the solar atmosphere (Štěpán et al., 2015).
The CLASP slit-jaw system also, serendipitously, provided images of the broadband fractional polarization (Figure 1(Ab)), in addition to the intensity images (Figure 1(Aa)). Since the Lyman- amplitudes are much larger in the wings than in the core, the broadband signal that results from the wavelength-integrated Stokes and profiles is dominated by the polarization in the wings. Interestingly enough, a comparison of this image with the intensity image clearly shows that the low-intensity regions (e.g., quiet-Sun areas) are indeed more polarized than the high-intensity regions (e.g., plage areas).
4 Discussion
In general, there is a good agreement between the theoretical predictions and the spectropolarimetric observations obtained by CLASP. This is far from trivial since the quantum theory of polarization in spectral lines taking into account partial frequency redistribution phenomena is still under development. Many of the subtle spectroscopic and radiative transfer effects it predicts (and explains) take place only in the extremely rarefied but generally optically thick plasma of a stellar atmosphere (e.g., Landi Degl’Innocenti, 1998; Stenflo et al., 2000; Manso Sainz & Trujillo Bueno, 2003), and cannot be investigated through specifically dedicated laboratory experiments.
The pattern observed by CLASP, with its strong ( %) near-wing polarization signals, demonstrates that the underlying physical mechanism is the joint action of partial frequency redistribution and -state interference (i.e., in the scattering events the photon goes through the two upper levels of Lyman- at the same time). Without -state interference, the wing signals would be significantly weaker (see Belluzzi et al., 2012), contrary to the observations by CLASP.
The complex polarization patterns shown in Figure 1(B) and especially the very significant polarization amplitudes at the Lyman- wings are very sensitive to the thermal structure of the upper solar chromosphere, while the line core polarization is sensitive (via the Hanle effect) to the presence of weak (10–100 Gauss) magnetic fields in the enigmatic TR. The lack of CLV in at line center is, however, an important and intriguing surprise, whose theoretical interpretation must significantly alter our empirical understanding of the solar TR. This is because the significant CLV at the center of the Lyman- profile predicted by state-of-the-art 3D models of the solar atmosphere (see Štěpán et al., 2015) can be made to disappear either by increasing the magnetization and/or the geometrical complexity of the model’s chromosphere–corona TR, which is intimately related to the magnetic-field topology (Štěpán et al. 2017, in preparation; Trujillo Bueno et al. 2017, in preparation).
Finally, the non-trivial fact that the upper chromosphere and TR of the Sun generate significant linear polarization signals in the (optically thick) hydrogen Lyman- line of the solar disk radiation supports the theoretical expectation that other ultraviolet lines with complementary magnetic sensitivities, such as the He ii line at 30.4 nm (Trujillo Bueno et al., 2012) and the Mg ii h & k lines around 280.0 nm (Belluzzi & Trujillo Bueno, 2012), should also be linearly polarized by anisotropic radiation pumping processes and that vacuum-ultraviolet spectropolarimetry is a key gateway to the magnetism and geometry of the outer atmosphere of the Sun and other stars. To fully open up this new diagnostic window, we need high-precision instruments like CLASP on board space telescopes.
References
- Belluzzi & Trujillo Bueno (2012) Belluzzi, L., & Trujillo Bueno, J. 2012, ApJ, 750, L11
- Belluzzi et al. (2012) Belluzzi, L., Trujillo Bueno, J., & Štěpán, J. 2012, ApJ, 755, L2
- De Rosa et al. (2009) De Rosa, M. L., Schrijver, C. J., Barnes, G., et al. 2009, ApJ, 696, 1780
- Giono et al. (2016) Giono, G., Ishikawa, R., Narukage, N., et al. 2016, Sol. Phys., 291, 3831
- Giono et al. (2017) —. 2017, Sol. Phys., 292, 57
- Hansteen et al. (2014) Hansteen, V., De Pontieu, B., Carlsson, M., et al. 2014, Science, 346, 1255757
- Ishikawa et al. (2014) Ishikawa, R., Narukage, N., Kubo, M., et al. 2014, Sol. Phys., 289, 4727
- Ishikawa et al. (2013) Ishikawa, R., Kano, R., Bando, T., et al. 2013, Appl. Opt., 52, 8205
- Ishikawa et al. (2015) Ishikawa, S., Shimizu, T., Kano, R., et al. 2015, Sol. Phys., 290, 3081
- Kano et al. (2012) Kano, R., Bando, T., Narukage, N., et al. 2012, SPIE Conference Series, 8443, 84434F
- Kneer (2010) Kneer, F. 2010, Mem. Soc. Astron. Italiana, 81, 604
- Kobayashi et al. (2012) Kobayashi, K., Kano, R., Trujillo-Bueno, J., et al. 2012, ASP Conference Series, 456, 233
- Kubo et al. (2016) Kubo, M., Katsukawa, Y., Suematsu, Y., et al. 2016, ApJ, 832, 141
- Landi Degl’Innocenti (1998) Landi Degl’Innocenti, E. 1998, Nature, 392, 256
- Landi Degl’Innocenti & Landolfi (2004) Landi Degl’Innocenti, E., & Landolfi, M. 2004, Polarization in Spectral Lines (Kluwer Academic Publishers, Dordrecht), doi:10.1007/978-1-4020-2415-3
- Manso Sainz & Trujillo Bueno (2003) Manso Sainz, R., & Trujillo Bueno, J. 2003, Physical Review Letters, 91, 111102
- Narukage et al. (2015) Narukage, N., Auchère, F., Ishikawa, R., et al. 2015, Appl. Opt., 54, 2080
- Narukage et al. (2017) Narukage, N., Kubo, M., Ishikawa, R., et al. 2017, Sol. Phys., 292, 40
- Pereira et al. (2014) Pereira, T. M. D., De Pontieu, B., Carlsson, M., et al. 2014, ApJ, 792, L15
- Priest (2014) Priest, E. 2014, Magnetohydrodynamics of the Sun (Cambridge Univ. Press, Cambridge)
- Rutten & Rouppe van der Voort (2017) Rutten, R. J., & Rouppe van der Voort, L. H. M. 2017, A&A, 597, A138
- Stenflo et al. (1980) Stenflo, J. O., Dravins, D., Wihlborg, N., et al. 1980, Sol. Phys., 66, 13
- Stenflo et al. (2000) Stenflo, J. O., Keller, C. U., & Gandorfer, A. 2000, Astronomy and Astrophysics, 355, 789
- Štěpán et al. (2015) Štěpán, J., Trujillo Bueno, J., Leenaarts, J., & Carlsson, M. 2015, ApJ, 803, 65
- Trujillo Bueno (2014) Trujillo Bueno, J. 2014, ASP Conference Series, 489, 137
- Trujillo Bueno et al. (2012) Trujillo Bueno, J., Štěpán, J., & Belluzzi, L. 2012, ApJ, 746, L9
- Trujillo Bueno et al. (2011) Trujillo Bueno, J., Štěpán, J., & Casini, R. 2011, ApJ, 738, L11