Central Engine and Host Galaxy of RXJ 1301.9+2747: A Multi-wavelength view of a Low-mass Black Hole Active Galactic Nuclei with Ultrasoft X-ray Emission
Abstract
RXJ 1301.9+2747 is an optically identified very low mass AGN candidate with , which shows extremely soft X-ray emission and unusual X-ray variability in the form of short-lived flares. We present an analysis of multiwavelength observations of RXJ 1301.9+2747 in order to study the properties of the active nucleus and its host galaxy. The UV-to-X-ray spectrum in the quiescent state can be well and self-consistently described by a thermal and a Comptonized emission from accretion disk, with blackbody dominating 70% of the X-rays in the 0.2-2 keV. The same model can describe the X-ray spectrum in the flare state but the Comptonized component becomes dominant (%). The best-fit implies an Eddington ratio of and a black hole mass of M⊙, in agreement with the estimation from the optical data within errors. However, the best-fitting model under-predicts the optical flux for the HST point source by a factor of 2. The excess of nuclear optical emission could be attributed to a nuclear stellar cluster which is frequently seen in low mass AGNs. The X-ray to optical spectral slope () is lower than in most other active galaxies, which may be attributed to intrinsically X-ray weakness due to very little hot and optically thin coronal emission. We performed a pilot search for weak or hidden broad emission lines using optical spectropolarimetry observations, but no any polarized broad lines are detected. The host galaxy appears to be a disk galaxy with a boxy pseudobulge or nuclear bar accounting for 15% of the total starlight, which is consistent with the general characteristics of the host of low mass AGNs.
Subject headings:
galaxies: active – galaxies: individual (RXJ 1301.9+2747) – galaxies: nuclei – X-rays: galaxies1. Introduction
Supermassive black holes (SMBHs) with masses of reside in the center of most bulge-dominated galaxies in the local universe. The discovery of the correlation between BH masses and the stellar velocity dispersions, , of their host galaxies ( relation, Gebhardt et al., 2000; Ferrarese & Merritt, 2000), strongly suggests coevolution of galaxies and BHs. It is however not known when and how this relation is established. In current models of galaxy evolution, SMBHs must have formed from much less massive “seed” BHs and grown up by fast accretion and/or merging (e.g., White & Rees, 1978; Volonteri et al., 2003; Begelman et al., 2006). The nature of such seed BHs is thus the major challenge to any cosmological BH growth model.
BHs with masses in the range of (IMBHs hereafter) are of particularly important. By filling the mass gap between supermassive and stellar-mass BHs, these objects are potential analogs of the seeds of supermassive BHs (e.g., Volonteri, 2010; Greene, 2012). Recent optical and X-ray observations have yielded a sample of 200-300 candidate IMBHs which revealed themselves as active nuclei in small galaxies (Greene & Ho, 2004, 2007b; Dong et al., 2012; Kamizasa et al., 2012; Schramm et al., 2013; Reines et al., 2013; Moran et al., 2014), and are beginning to constrain formation and evolution models of seed BHs (Greene, 2012). In fact, deviations in the relation have been observed in a population of IMBHs (e.g., see review by Kormendy & Ho, 2013). The host galaxies of IMBHs appear very different from their supermassive counterparts. Detailed bulge-disk-bar decompositions of IMBH AGNs have shown that majority of galaxies have disks and are likely to contain pseudobulges, with very few of them living in classical bulges (Greene et al., 2008; Jiang et al., 2011a) suggesting that bulge may not be a necessary condition for BH growth and a secular evolution of the low mass BHs is favored.
Presumably, IMBHs likely have not had the opportunity to become full-grown. The accretion process and the disk corona geometry around the central IMBH could be markedly different from that around SMBHs in luminous AGNs (e.g., Godet et al., 2012; Miniutti et al., 2013; Jin et al., 2016). Therefore, AGNs with IMBHs provide an excellent diagnostic tool for probing the BH accretion processes in a poorly explored regime of parameter space (e.g., Dewangan et al., 2008; Miniutti et al., 2009; Yuan et al., 2010; Dong et al., 2012; Yuan et al., 2014; Pan et al., 2015; Ludlam et al., 2015; Ho & Kim, 2016; Plotkin et al., 2016). They are potential candidates enabling us to test if the accretion physics is the same at all scales from the stellar mass to supermassive BHs (McHardy et al., 2006; Gültekin et al., 2014; Zhou et al., 2015).
The broadband spectral energy distribution (SED) of AGNs are powerful diagnostics on the detailed BH accretion processes as well as the interplay with the host galaxies (e.g., Elvis et al., 1994; Ho, 1999; Vasudevan & Fabian, 2009; Jin et al., 2012a). Although it is not straightforward to measure the SEDs for low mass and hence low luminosity AGNs because of the strong contamination from the hosts, there are increasing observational evidence suggesting the unusual multiband properties for these systems. Chandra and XMM-Newton observations of IMBH AGNs discovered with SDSS have shown that while the soft X-ray spectral properties are consistent with that for AGNs with more massive BHs, the X-ray-to-optical spectral slopes () tend to be steeper (on average) than expected for their UV luminosities, suggesting that at least some of them may be intrinsically X-ray weak (Greene & Ho, 2007; Desroches et al., 2009; Miniutti et al., 2009; Dong et al., 2012). Low mass AGNs with high accretion rates () have also been found very radio-quiet on average (Greene et al., 2006). Yuan et al. (2014) recently extended the study to relatively low Eddington ratio sources (, Plotkin et al. 2016), and found that they tend to be intrinsically X-ray weak, very similar to that of the prototype IMBH AGN NGC 4395. On the other hand, Gültekin et al. (2014) have shown that low mass BHs do belong the “fundamental plane of BH accretion”, a correlation between the X-ray, radio continuum emission and mass of accreting BHs (Merloni et al., 2003; Falcke et al., 2004; Gallo et al., 2012).
More recently, Terashima et al. (2012) reported an extreme case of IMBH AGN, 2XMM J123103.2+110648 (J1231+1106), with a central BH mass as small as (Ho et al. 2012), whose X-ray spectrum completely lacks emission at energies keV, and can be described entirely by a soft thermal component of temperature keV. Such an extreme soft excess is unprecedented among AGNs, even at the very low mass end (e.g., Dewangan et al., 2008; Desroches et al., 2009; Miniutti et al., 2009; Ai et al., 2011). A similarly extremely soft X-ray spectrum was also found in GSN 069 () by Miniutti et al. (2013). In either case, the thermal X-ray spectrum appears to be a close analog to the typical high/soft state in BH X-ray binaries (BHBs), which would suggest a new, and possibly accretion disk dominated, AGN spectral state. The discovery of a 3.8 hr periodicity from J1231+1106 adds further confidence of the similarity of this ultrasoft AGN to the BHBs (Lin et al., 2013). Lin et al. (2013) claimed that the ultrasoft X-ray spectra in the two objects could be associated with tidal disruption events, as both clearly show long-term luminosity evolution, making the nature of their ultrasoft X-ray emission intriguing.
RX J1301.9+2746 (hereafter J1302) is another ultra-soft and highly variable AGN (Sun, Shu & Wang 2013, hereafter S13). Our detailed analysis of the optical spectrum taken from the SDSS revealed that the galaxy hosts a Seyfert-like nucleus at . Using the width of the [OIII]5007 line as a proxy for the stellar velocity dispersion of the host galaxy, we obtained a BH mass of with an intrinsic scatter of 0.5 dex, placing J1302 in the regime of IMBHs. The X-ray properties of this source not only show many similarities to J1231+1106 and GSN069 (lack hard X-rays and no detectable broad H and H lines), but also exceptional in at least two respects: 1) Its X-ray light curve shows clearly two distinct states: a long quiescent state and a short flare (or eruptive) state, which differs in count rates by a factor of 5–7; 2) Significant detection in the radio (1.4 GHz) with VLA (7). Because of these unique properties, J1302 remains a valuable target for further study. Here we present an analysis of multi-wavelength observations of J1302, including X-ray from Chandra/XMM-Newton, optical from HST, ultraviolet (UV) from XMM-Newton/OM and GALEX, near-to-mid infrared from 2MASS, WISE and Spitzer, and radio from the Very Large Array (VLA), in order to investigate the nuclear SED of J1302 over a wide range in frequency as well as the host galaxy properties. In Section 2, we present the observations and data analysis. The results are discussed and concluded in Section 3 & 4, respectively.
2. Observations and data
2.1. Spectropolarimetric Observation
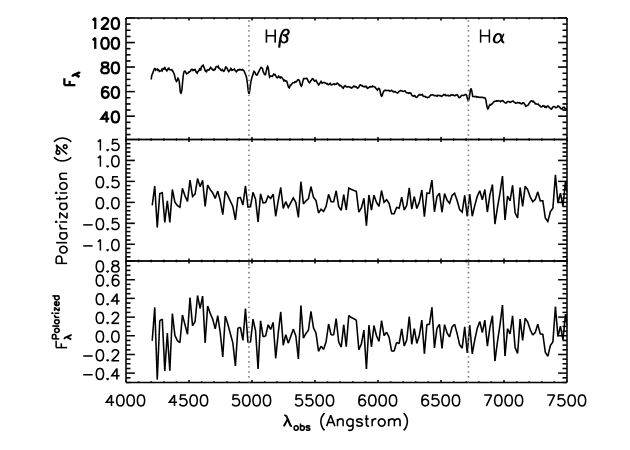
Spectropolarimetric observation was made with the CCD Spectropolarimeter (SPOL; Schmidt et al. 1992) at the 6.5 m Multiple Mirror Telescope (MMT) on 2016 April 3. We used a low-resolution grating (6001 mm-1) providing spectral coverage of 4100–8200Å. An entrance slit of 1.″1 width centered on the nucleus was used to match the seeing. The resulting spectral resolution is 15Å FWHM, corresponding to FWHM km/s around the . The total exposure time was 40 minutes. A /4 rotatable achromatic retardation plate was used to provide linear polarization measurements. The data reductions, including bias subtraction, flat-field correction, and cosmic-ray removal, were accomplished with standard procedures using the IRAF script provided by the instrument’s PI Dr. Paul Smith 111http://james.as.arizona.edu/ psmith/SPOL/spolred.html. Stokes and parameters were measured individually and then combined to obtain the degree of polarization.
2.2. Analysis of the HST Images
J1302, as a member of Coma cluster, was observed by HST/WFPC2 in F814W (roughly the band of the Johnson system) and F450W () filter in a project studying current starburst and post-starburst early-type galaxies in nearby clusters of galaxies on 1997 July 12 (Caldwell et al., 1999). Some results from HST observations have been presented by Caldwell et al. (1999), which reveal J1302 to be an edge-on disk galaxy with a very bright nucleus. Here we examine the HST data in detail in the context of the broadband SED analysis on the nucleus. For ease of rejecting cosmic rays, the total exposure time (1200s and 800s for and bands respectively) were divided into two equal exposures in the observations of each band. These images are then combined using astrodrizzle to remove cosmic-ray hits and to correct for possible geometric distortion. J1302 was located at the center of PC1 chip and thus the final pixel scale is 0.″0455.
Then we try to perform a two-dimensional (2D) decomposition of J1302 using GALFIT (Peng et al., 2002, 2010). The AGN is represented by a point source modeled with the TinyTim PSF, and the host galaxy is modeled by a bulge as Sérsic function or a disk as exponential (Exp) function (equivalent to ), or a combination of them. The sky background have been subtracted during astrodrizzle combination, also confirmed by our residual sky estimation. Other objects, like background galaxies or foreground stars are masked out. The single Sérsic fitting scheme gives an unacceptable large residuals in the image, while Sérsic + Exp fitting scheme yields a much better result. For example, in our fittings to the HST I-band image, the single Sérsic model yields fit statistics , while it is significantly improved using the Sérsic + Exp model with for four extra parameters. During the B-band fitting, we have fixed the Sérsic index to be the value given by band because a totally free fitting yields an unreasonable high index.
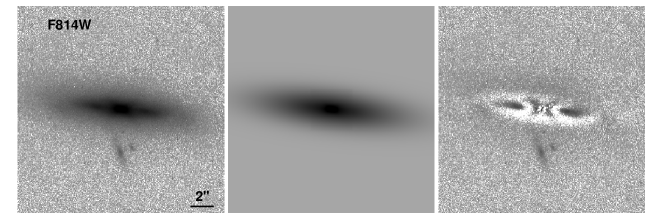
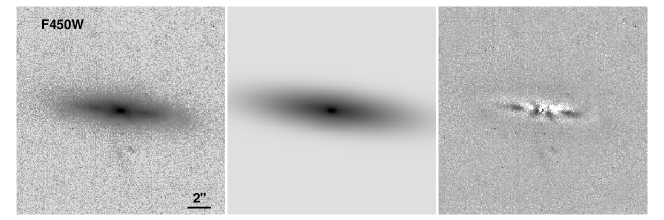
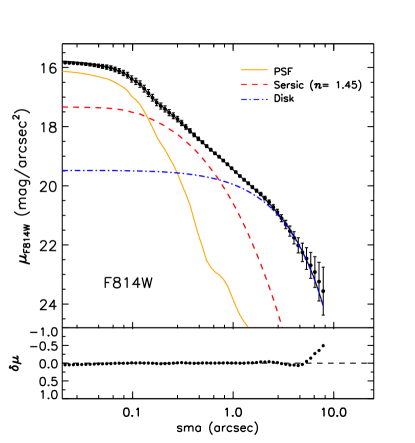
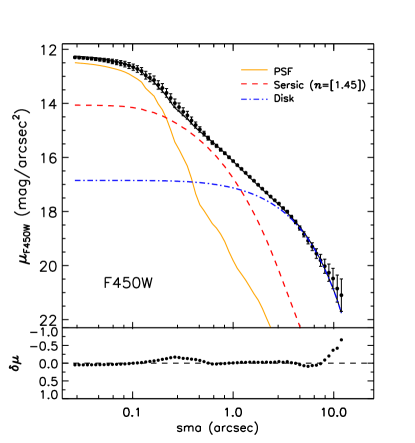
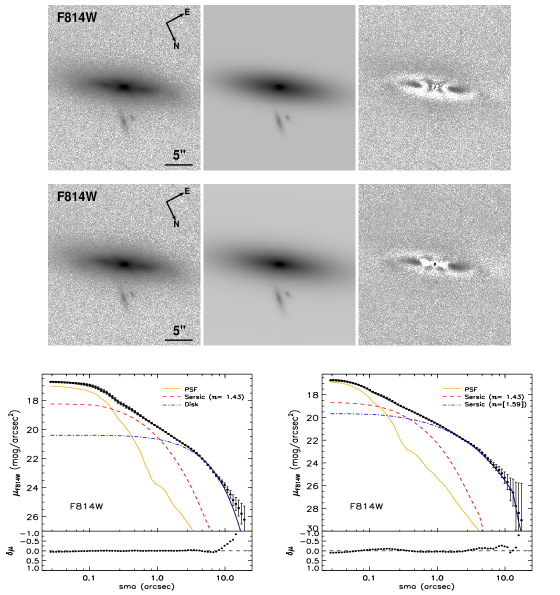
The top panels of Figure 1 show the F814W and F450WHST image (left panel) and the GALFIT model (middle panel). The best-fit yields ( Å), ( Å) with an effective radius of 0.″41, and ( Å), ( Å) with an effective radius of 0.″37, for the F814W and F450W, respectively. The residuals after subtracting the model from the original image are shown in the right panel. The weak residuals seen in the central region ( arcsec), especially in the F450W HST image, could indicate small-scale structure in the host galaxy (Section 3.3). The bottom panels of Figure 1 show a radial profile plot of the best fit from GALFIT consisting of a central PSF (orange), a Sérsic of (red dashed), and an outer disk (blue dot-dashed). The residuals at large radii ( arcsec) are likely due to more extended disk emission which deviates from the adopted exponential profile (). Allowing the Sérsic index of the disk component to vary yields very similar results, indicating that the current HST observations are not sensitive to detect more extended, low surface brightness emission from the galaxy. In fact, previous studies have shown that the disk component is always fitted by an exponential profile, as in nearby inactive galaxies and galaxies with IMBHs, although disk profiles do vary at large radii (e.g., Jiang et al., 2011b). Parameters of the F814W and F435W fits can be seen in Table 1, which are consistent with each other except the magnitudes. Additional checks on the photometry and potential systematic errors are presented in the Appendix A.
2.3. X-ray Observations
J1302 was observed by XMM-Newton EPIC cameras on December 2000 with a total exposure time of 29 ks, and Chandra on June 2009 for about 5 ks. The data were processed following the standard criteria, which is detailed in S13. We found in both XMM-Newton and Chandra observations that the source displays ultrasoft X-ray emission and unusual giant flares in the light curves for a duration of ks. Though only one and a possible decline of another flare are recorded in the XMM-Newton observation, a very similar flare seen in the Chandra data is suggesting that the flare itself appears repetitive and occurs very frequently in the object. In this paper, we will present a more physical description of the X-ray spectrum of J1302, by jointly fitting the X-ray and UV data (see Section 3.1). We will use principally the XMM-Newton PN data, which have much higher sensitivity. As the source shows peculiar temporal and spectral behaviors, we attempted to quantify the spectral variability during flares by dividing the data into high and low flux intervals, using count rate thresholds of 0.35 counts s-1 for the PN data. We classify the data above the count rate thresholds as belonging to the flare state, and those which fall below, to the quiescent state.
2.4. Ultraviolet Observations
2.4.1 XMM-Newton Optical Monitor
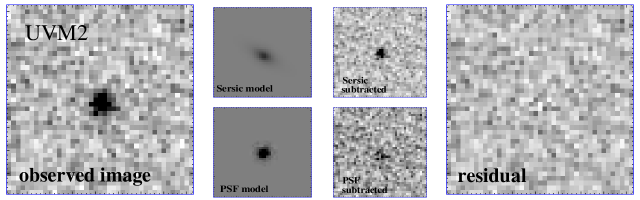
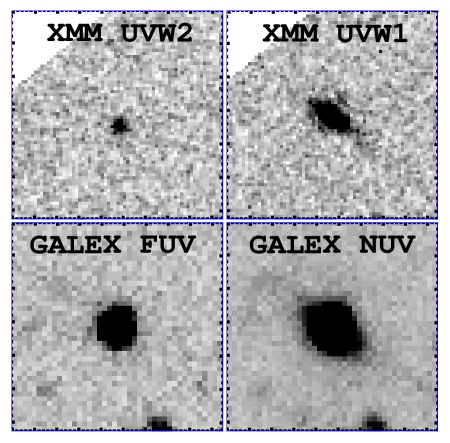
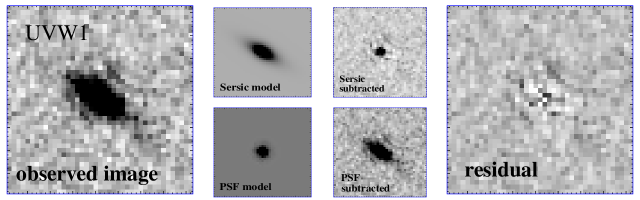
The Optical Monitor (OM) data from XMM-Newton for the J1302 were taken simultaneously with the X-ray observations, using the UVW2 and UVW1 filter, which is centered at 2120Å and 2910Å, respectively. The FWHM of the PSF is 2″, or 2.1 pixels. However, only a few OM images (four) were taken and hence we are not able to construct the UV lightcurve to examine whether the UV flux is variable, i.e., significant flux enhancements as seen in the X-ray. Top panels of Figure 2 show the XMM-Newton/OM UVW2 (left) and UVW1 images (right). Inspection of the images shows that the source is extended, in particular in the UVW1 image. In order to determine the AGN and host galaxy contribution quantitatively, we first tried to perform 2D decomposition using GALFIT for the UVW1 filter, which is close to the HST F450W band. However, as the OM UV spatial resolution is worse than the HST, we choose a simple model consisting of an AGN point source and a single Sérsic component. The Sérsic index of the host galaxy component is slightly larger than in the HST filters with . The best-fit effective radius of the host galaxy, as described by the Sérsic component, is also larger than in the F450W filter (3.″5 compared to 0.″37), and the PSF component has a relatively low luminosity. Note that excluding the PSF component results in acceptably residuals, but the Sérsic index is a factor of two higher. This is possibly because the single Sérsic component tend to trace the concentrated light in the PSF-dominated region which is supported by the fitted smaller effective radius of 2.″75.
Details on the tests on the AGN and host galaxy decomposition with simulations are presented in Appendix. The flux density from the best-fit (PSF+Sérsic) model is for the AGN and for the galaxy, respectively. Note that given the poor resolution, the PSF component likely consists of some host galaxy light which is difficult to be disentangled. We also performed the AGN and host galaxy modeling in the UVW2, but with parameters for the Sérsic component held fixed except its magnitude. The results for the UVW2 fits can be seen in Table A1 in the Appendix.
2.4.2 GALEX
Beside the XMM-Newton OM data, J1302 was also imaged and detected in the near-UV (NUV; 2316Å) and far-UV (FUV; 1539Å) by GALEX All-sky Imaging Survey on April 2009, for a total exposure time of 26 ks and 18 ks, respectively. The FWHM of the PSF for the NUV filter is 4.″0 (2-3 pixels) and for the FUV filter is 5.″6 (3-4 pixels). The lower panels of Figure 2 show the GALEX NUV and FUV images, which have not been analyzed before. As in the XMM-Newton/OM, the source is extended in the both images. We tried to perform similar 2D decomposition of the AGN and galaxy emission using GALFIT. Our GALFIT results show that the PSF component has a flux of and , and the Sérsic has a flux of and , respectively. Since the NUV band of GALEX surrounds the OM UVW2 filter, the flux gives us the opportunity to check for long-term variability in the UV. We find that the flux density derived from XMM-Newton/OM UVW2 is a factor of 9 higher than that from GALEX NUV for the point source, meaning that there is a variability for the J1302 nucleus in the UV. However, it should be noted that the GALEX PSF component may consist of considerable host galaxy light due to its poorer resolution (5″, or 2.4 kpc), and vice versa. In this case, the GALFIT decomposition is very uncertain and one has to treat the results with caution.
2.5. Radio observations
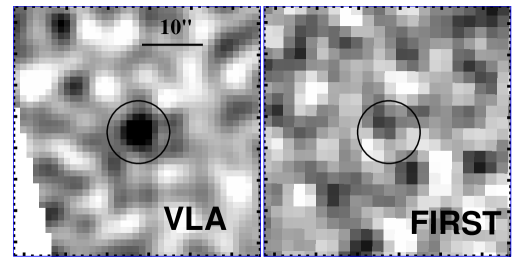
As part of deep VLA 1.4 GHz imaging of Coma cluster, J1302 was observed with VLA on 2006 June. The VLA observations were performed in its B configuration, reaching 22 Jy in the deepest part, or W Hz-1 for galaxies at the distance of Coma (Miller et al., 2009). As shown in Figure 3, J1302 was near the edge of the mosaic (20″ from the edge, where the local noise level is high), and detected at a level of . The peak and integrated 1.4 GHz flux density is 779106 and 866197 Jy (Miller et al., 2009), corresponding to radio luminosity at 1.4 GHz of erg/s. With the same configuration, J1302 was not detected by Faint Images of the Radio Sky at Twenty cm (FIRST) using VLA, with a limiting flux of 950 Jy/beam (Figure 3, right). This upper limit is consistent with the above reported flux by Miller et al. (2009), thus it is not apparent whether the source is variable or not.
With a FWHM of 5″, VLA observations cannot resolve the radio emission, preventing further studies on the origin of it in J1302. However, as we discussed below, the radio emission from J1302 is likely associated with an AGN, and couldn’t be produced by a single BHB, as the highest previous known is around erg/s (Corbel et al., 2013), fare less than what is observed. A young radio supernova remnant can also be ruled out since the VLA flux density at 1.4 GHz has no evidence of being declined in more than a decade (from 1995 to 2006) which would be otherwise detected in the FIRST survey. The origin of the radio emission from circumnuclear star formation is also impossible. J1302 was detected in 24m with a flux of 1.01 mJy (see Section 2.5). Based on the local galaxy templates (Chary & Elbaz, 2001), the predicted FIR luminosity is . In combination with the radio power, the FIR/radio ratio is estimated to be , much less than the typical value of 2.6 for star-forming galaxies (Ivison et al., 2010), suggesting a significant radio excess from AGN.
We obtained a radio-loudness parameter, , which is defined as the ratio of the flux densities between 6 cm and optical 4400 Å. The latter is the flux for the nuclear point sources as derived from the GALFIT-decomposition of HST B-band image, while the radio flux at 6 cm is estimated from the observed 1.4 GHz flux by assuming a radio spectral index (). Thus J1302 is formally radio quiet, as a radio-loud object is usually defined to have (Kellermann et al., 1989). However, it should be noted that our estimate on the radio loudness by the extrapolation is uncertain, as it depends strongly on the radio spectral index which is unknown. Recent studies have shown that the radio spectral indices are in the range 0.5-0.9 (e.g., Greene et al., 2006; Wrobel & Ho, 2006; Nyland et al., 2012; Reines & Deller, 2012; Gültekin et al., 2014). Assuming a radio spectral index of for J1302 will yield a factor of 1.5 increase in the value of radio loudness. The value for J1302 is slightly higher than the majority of the low-mass AGNs studied by Greene et al. (2006), which have upper limits in the range , but comparable to the measurements in the extended sample of AGNs with low-mass BHs (Greene & Ho, 2007b; Gültekin et al., 2014), with a median value of . Note that only eleven of the objects are detected in the FIRST survey (6%, Greene & Ho 2007b), suggesting that low-mass AGNs may have a low incidence of radio activity.
2.6. Infrared observations
J1302 was detected at 24m, as part of /MIPS survey program of Coma cluster. The 80 percent completeness limit of the survey is 0.33 mJy. By using a 21″aperture photometry (corrected by a factor of 1.29 for total), the 24m flux for J1302 was estimated to be 1.05 mJy (Mahajan et al., 2010). This corresponds to a star formation rate (SFR) of 0.064 M⊙ yr-1 (Elbaz et al., 2010), if assuming that the AGN has little contribution to the 24m flux.
J1302 is also included in the Wide-field Infrared Survey Explorer (; Wright et al. 2010) source catalog. has mapped the whole sky in 4 bands centered at 3.4, 4.6, 12, and 22m (W1, W2, W3, W4), with an angular resolution of 6.″1, 6.″4, 6.″5, and 12.″0. J1302 is detected with a high S/N in W1 and W2, while it is marginally detected in W3 and not detected in W4. The average magnitude over the set of observations is W1=12.58 mag (2.85 mJy), W2=12.558 mag (1.62 mJy), W3=11.295 mag (0.88 mJy), and W4 mag (2.89 mJy). The upper limit on the W4 flux is consistent with the observed 24m flux with /MIPS.
To construct the broad-band SED of J1302, we also took near-infrared magnitudes from the 2MASS Point Source Catalog (Skrutskie et al. 2006) in the J (13.31 mag), H (12.67 mag), and (12.336 mag) bands. The corresponding flux density is 7.55 mJy, 8.73 mJy and 7.76 mJy, respectively. Given the poor resolution, the 2MASS magnitudes include flux from both the AGN and the host galaxy.
3. Results and Discussion
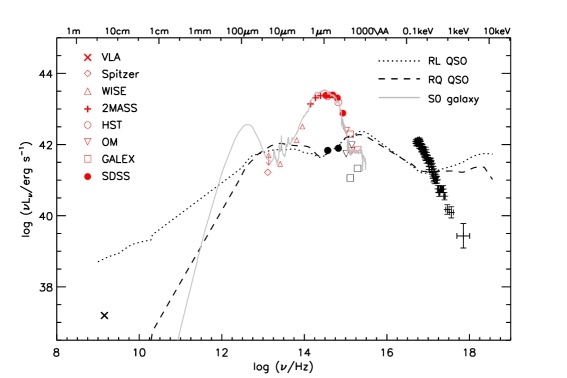
We have combined the photometric data described in the previous section to construct the broadband SED for J1302. This is one of the most complete SEDs available for low-mass AGNs (e.g., Moran et al., 1999, 2005; Thornton et al., 2008; Jiang et al., 2013). The result, plotted in units and corrected for Galactic absorption, is displayed in Figure 4. The SED template from a S0 galaxy is overplotted for comparison, as it is consistent with the classification of J1302 from ground-based imaging. Thanks to the high resolution HSTdata obtained, we can reveal partially the nuclear SED of J1302. As Figure 4 shows, the optical nuclear SED is at least ten times weaker than that of host galaxy. A comparison with the median SEDs of radio-quiet and radio-loud quasars (Elvis et al. 1994) suggests that the SED of J1302 differs dramatically from the ones of quasars, particularly from the UV to the X-ray. The obvious big blue bump in optical/UV as seen in typical quasars is not observed in J1302 which is likely shifted to higher frequencies. While possible source variability is present in the UV, the XMM-Newton/OM measurements appear to agree roughly with disk blackbody model which can well fit the X-ray data (S13). Further characterization of the optical-to-X-ray data will be presented in the next Section.
3.1. X-ray Spectral Properties
As we found in S13, the X-ray spectrum of J1302 is extreme steep ( in the quiescent state) which is unprecedented among AGNs. Modeling the quiescent state spectrum with a disk blackbody yields an effective disk temperature of 40 eV, which is comparable to the expectation from the standard accretion disk model (Yuan et al. 2010; S13). The fitted disk temperature is, however, in remarkable contrast to the canonical temperatures of 0.1-0.2 keV found for the soft X-ray excess in AGNs which are too high to conform to the disk model prediction (e.g., Crummy et al., 2006; Ai et al., 2011). The dominance of thermal disk emission in the spectrum is by analog with BHBs in their high/soft state, suggesting that the source has a high Eddington ratio (). If explaining the ultrasoft X-ray emission with the Comptonization of seed photons from the disk, an even higher Eddington ratio of will be implied (Done et al., 2007). In combination with the observed luminosity, the BH mass may be at an order of , consistent with the estimation from optical (S13). The quiescent state however, requires an additional steep power-law () contributing to 15% of the total luminosity, presumably arising from the Comptonization by transient heated electrons in corona. It is possible that the additional power-law component likely increases in luminosity during the flare state, resulting in a hardening of the X-ray spectrum.
Here, we consider simultaneous fits to the X-ray and UV data for the two flux states, using a more physical model, namely the optxagnf model in XSPEC (Done et al., 2012; Jin et al., 2012a). It assumes that the gravitational energy released in the disk is emitted as a color corrected blackbody (BB) down to a coronal radius , while within this radius the available energy is distributed between two Comptonization components: a soft one via Comptonization in an optically thick cool corona to account for the observed soft X-ray excess, and a hard one in an optically thin hot corona to model the standard X-ray power-law emission above 2 keV. The key aspect of this model is that the optical/UV luminosity constrains the mass accretion rate through the outer disk, provided there is an independent estimate of the BH mass. The parameters of the optxagnf model are the BH mass (), Eddington ratio (), dimensionless BH spin (), coronal radius () marking the transition from blackbody emission to a Comptonised spectrum, the outer radius of the disk ( in units of ), electron temperature () and optical depth () for the soft Comptonisation component, fraction of the power within which is emitted in the hard Comptonisation component (), and normalization.
However, as we mentioned in Section 2.3.2, the NUV flux from GALEX which is not simultaneous with the X-ray data, and is found a factor of lower than that observed with XMM-Newton/OM. This is likely due to the uncertainty in image decompositions. Therefore only the XMM-Newton/OM data are used in our spectral fits. However, there are too many parameters to constrain and the UV data are not sufficient to remove the degeneracies, so we assumed a non–rotating Schwarzschild BH, and fixed the outer radius at 10, the hard powerlaw index at . In our fittings to the quiescent data, we also fixed the coronal radius to 10 which is the typical value for AGNs (Jin et al., 2012b), as it is found pegged to the maximum value of 100 allowed in the optxagnf model. In fact, spectral-timing and reverberation studies are suggestive of a physically small corona of above the central BH in AGNs (e.g., Fabian et al., 2009; Wilkins et al., 2015). Compact coronae with radii less than have also been inferred from X-ray microlensing analyses of some bright quasars (e.g., Chartas et al., 2009; Reis & Miller, 2013). Both Galactic absorption (fixed at cm-2) and intrinsic absorption from the host galaxy are included in the final model. We accounted for the Galactic extinction by setting . This model provides a good description of the UV and X-ray data with a reduced . The parameters for the optxagnf fit are shown in Table 3. The best-fit implies a BH mass of M⊙ and Eddington ratio =0.14, which are in agreement with those derived from optical spectrum in S13. Therefore, if the optxagnf model is correct to explain the observed X-ray spectrum for J1302 then a low mass BH accreting at high Eddington rate can be inferred.
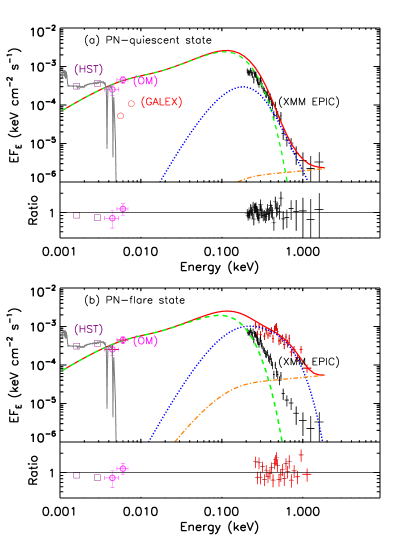
Figure 5(a) shows the best-fit optxagnf model for the X-ray quiescent data (red solid line), alongside with different SED components. The thermal emission from accretion disk dominates the X-ray spectrum at the quiescent state by accounting for % of the total flux in the 0.2-2 keV, while the Comptonization from low temperature corona contributes %. The best-fit electron temperature and optical depth for the soft Comptonization component is keV and , respectively. They are consistent with the average values, i.e., and , in the study of a large sample of type 1 AGNs by Jin et al. (2012b), suggesting that the Comptonization by an optically thick corona could account for, at least partially, the observed soft excess emission. The high temperature optically thin Comptonization component, however, contributes to only % of the X-ray flux. This suggests that J1302 may differ from many other AGNs in its environment surrounding the central engine, i.e., lacking the standard optically thin electron population in corona. It may be possible that in J1302 the hot disk corona is strongly suppressed due to the formation of jet given its detection in the radio, as found in BHBs during their high/soft state. However, as the high temperature Comptonization to produce the power law emission which dominates above 2 keV is still consistent with the data, future longer observations at higher energies than our XMM-Newton data are needed to better constrain the coronal parameters. We note that, by extrapolating the best-fitting model to the optical emission from the HST point source, the model under-predicts the flux by a factor of , as shown in Figure 5. This is likely due to the emission from nuclear star clusters (NSCs), for which we will discuss in detail in Section 3.2.3.
The X-ray data for the flare state along with the best-fit optxagnf model are shown in Figure 5(b), and the best-fit parameters are summarized in Table 3. It was found that when fixing the coronal breaking radius , as did for the quiescent data, spectral fits with the optxagnf model result in an extremely large optical depth, which is approaching the maximum value of allowed in the model. The large optical depth is indicative of more low-energy photons being upscattered by the Comptonization process. We then allowed the corona radius to vary in the spectral fits, and the best-fit yields a more extended corona of , with a 90% confidence lower limit at 11.8. In this situation, it is possible that the configuration of the corona is changed before and during the flare, e.g., a layer of warm, optically thick material over the surface of the accretion disk may arise for a short period. Although the physical condition on the corona is unclear, it has been suggested that the magnetic reconnection may play a critical role in accelerating the non-thermal electrons associated with the corona which could be responsible on the X-ray flares (e.g., Wang et al., 2001; Wilkins et al., 2015; Li et al., 2016). In the flare state, the best-fit of the optxagnf model suggests that the X-ray spectrum is dominated by the low temperature Comptonization component which accounts for 80% of the total emission in the 0.2–2 keV.
3.2. Broadband Continuum Properties
3.2.1 The ratio of optical/UV to X-rays
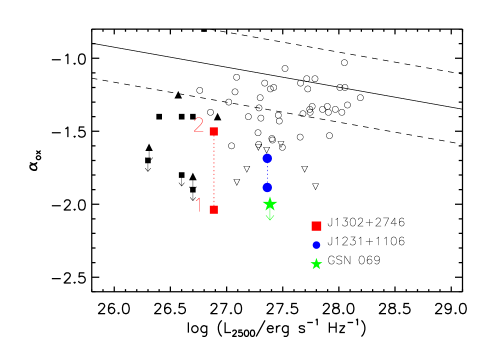
As we have seen in the above Section, J1302 appears to have different disk-corona geometries from other AGNs. In order to gain insights into the unusual X-ray properties of J1302, we turn now to the analysis of the optical-to-X-ray flux ratio. Given the extremely weak hard X-ray emission, the ratio in this object maybe unusually large compared to previously known AGNs. The optical-to-X-ray flux ratio is often parameterized by , which is defined as the effective spectral index between 2500Å and 2 keV222=0.384log(). To calculate the monochromatic 2500Å flux, we used the /OM flux at Å (UVW2)333Using the monochromatic 2910Å flux as an extrapolation results in a consistent but slightly flatter 1.95 in the quiescent state., assuming an UV spectral index . The /OM data which are taken simultaneously with the X-ray observations allow for more reliable measurement of . The X-ray monochromatic flux at 2 keV is estimated from the best-fitting spectral model (S13), since it is not detected directly. In Figure 6 we plot the versus . It is well known that AGNs are increasingly X-ray weak for higher UV luminosities. Such relation for the optically selected AGNs is shown by the solid line and the dotted line is the 1 scatter (Steffen et al. 2006). J1302 is displayed as red filled square in the flare and quiescent state, respectively. It shows that the for J1302, like some low mass AGNs with high-Eddington ratios (Dong et al. 2012), falls below the low-luminosity extrapolation of the previously found relation. In particular, J1302 in the quiescent state is significantly (hard) X-ray weak compared to typical AGNs ( times weaker than expected with respect to its optical/UV emission). The and for the flare and quiescent state (see Table 4)444 is the average expected from the Steffen et al. (2006) relation., corresponding to being X-ray weaker than at the 2.15 and 10.64 level, respectively (e.g., Plotkin et al., 2016). For comparison, we also plot the for the ultrasoft AGN J1302+2746 and GSN 069 (Terashima et al. 2012; Miniutti et al. 2013), which are found to be significantly lower than the extrapolation of the relation, indicating similar hard X-ray weakness.
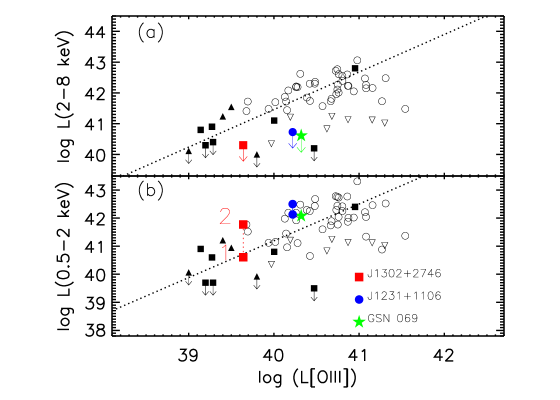
A similar perspective comes from comparing the hard X-ray luminosity with optical line emission, e.g., [Oiii], as the two are strongly correlated in unobscured AGNs (e.g., Heckman et al., 2005; Panessa et al., 2006). The hard X-ray (2–8 keV) and [Oiii] line luminosity relation is shown in Figure 7(a). We include the best-fitting relation from a sample of Seyfert galaxies with high BH masses (e.g., Panessa et al. 2006), and low-mass AGN sample from Dong et al. (2012) for comparison. The intrinsic 0.5–2 keV luminosity of J1302 is , while the 2–8 keV luminosity is . J1302, together with the other two ultrasoft AGNs, do lie below the relation defined by the higher luminosity sources. According to this correlation the observed upper limit on implies that the hard X-ray emission in J1302 is at least five times fainter than in typical AGNs. Note that given the low luminosity of the J1302 nucleus, a fraction of the [Oiii] line luminosity may be associated with the star formation process. Using the [Oii]3727 emission line as a tracer of star formation, and the observed median [Oiii]/[Oii] ratio of –0.54 dex for galaxies (Moustakas et al., 2006), we obtained a SFR of 0.21 M⊙ yr-1assuming the [Oiii] line is due to star formation activity. This SFR is a factor of three larger than that obtained from the IR luminosity (Section 2.5), suggesting that most, if not all, of the [Oiii] is ionized by AGN emission. This is supported by the observed ratios of the narrow lines [Oiii]/ and [Nii]/, which place J1302 into the Seyfert regime on the BPT diagram of Kewley et al. (2006). Subtracting the SFR contribution from the [Oiii] luminosity, the hard X-ray emission for J1302 is still three times fainter than typical AGNs.
We argue that the X-ray weakness of J1302 is not due to intrinsic absorption, though it has been proposed to play a role in some IMBH AGNs (e.g., Dong et al. 2012; Yuan et al. 2014). J1302 displays a highly variable soft X-ray emission (S13), and its X-ray spectra show no evidence of any significant intrinsic X-ray absorption. Comparing the 0.5–2 keV emission with the strength of the [Oiii] line further supports this, as illustrated in Figure 7(b). The ratio of soft X-ray to [Oiii] luminosity can be used as an indicator of X-ray absorption. Obscured AGNs fall off the correlation being underluminous in X-rays for a given [Oiii] luminosity. As can be seen, J1302 do lie within the – relation defined by unabsorbed type 1 AGNs, both of high and low BH mass. Another trend can be seen is that J1302, especially at its quiescent state, extends the – relation down to the lower luminosity regime for low mass AGNs (Yuan et al. 2014).
The above analysis strongly suggests that J1302 is intrinsically X-ray weak, though the true nature of which is unclear. One possibility is that J1302 may represent an extreme case of a low BH mass but high Eddington ratio system in which the standard hard X-ray corona is absent or unable to efficiently up-scatter the disk photons (e.g., Leighly et al., 2007; Miniutti et al., 2013). When the Eddington ratio is high (), the structure of the standard thin accretion disk changes to a geometrically and optically thick slim accretion disk, where outflow and/or disk-wind becomes important. In this situation, a dense, highly ionized “failed wind” produced by overionization could fall into the corona and thus may quench the hard X-ray emission through bremsstrahlung (Proga 2005).
3.2.2 Intrinsically lack of BLR?
Note that, like the other two ultrasoft X-ray AGNs, J1302 is unabsorbed in the X-rays but do not show any broad Balmer lines in the optical, suggesting that this AGN may lack the BLR or that the corresponding emission lines are much weaker than in typical AGN, as suggested by Miniutti et al. (2013). This is puzzling and in apparent contradiction with the unification model of AGNs (Antonucci 1993). The contradiction might be attributed to a patchy torus, which could block most of the BLR emission while enable occasional leakage of the central X-ray emission. If this is the case for J1302, we would expect X-ray spectral transitions, i.e., from unabsorbed to heavily obscured (to be testified with future X-ray observations). Meanwhile, we also expect a hidden BLR. We have therefore conducted a pilot search for weak or hidden broad emission lines (BELs) in J1302 using optical spectropolarimetry. The results are shown in Figure 8. Although a small polarization (including instrumental one) is detected, no polarized broad H or H is seen, suggesting that J1302 may intrinsically lack a BLR. However, the spectral resolution of our observation is not high, which may not be efficient to detect broad in polarization if its FWHM is less than 700 km/s. In addition, as the object was observed in a relatively short (40 min) exposure and the S/N is poor in the spectropolarimetry data, deeper spectropolarimetric observations are needed to firmly exclude the presence of weak or hidden BELs.
Models have suggested that if the BLR is part of an outflow, or disk-wind, it is unable to form once the AGN accretion rates below the critical value of (Nicastro, 2000; Elitzur & Ho, 2009). In this scenario, J1302 appears to be a puzzling “true” Seyfert 2 candidate with Eddington ratio much higher than the critical value for the BLR disappearance. Miniutti et al. (2013) proposed that the lack of BLR in GSN 069, another ultrasoft AGN similar to J1302, maybe attributed to either the lack of hard X-ray emission in a two-phase BLR model, or an evolutionary scenario in which the BLR has not fully formed. Such idea can be tested in J1302 by detecting and following the evolution of the hard X-ray emission (if present). The (quasi)-simultaneous optical/UV spectroscopic campaign may be useful to confirm/dismiss the above interpretation.
3.3. Host Galaxy Structure and BH-Host Connection
From our GALFIT decompositions, we conclude that the host galaxy can be well fitted in the both HST filters by a Sérsic profile with and 0.″41 at 2″, and an exponential profile (equivalent to Sérsic function that is usually used to describe disk at the outer region, see Figure 1). The structure of the inner region of the host galaxy remains complicated due to the slight excess of emission between arcsec in the F435W filter, which could be attributed to the PSF mismatch. Looking at the inner region, there is a significant vertical “X”-shaped structure in the residual image (Figure 1). Such a structure has also been reported by Caldwell et al. (1999), and not unusual for Milky Way mass galaxies in the local Universe (Laurikainen et al., 2014), which is confirmed by N-body simulation as a natural evolution result from a pure disk galaxy (Li & Shen 2012). By excluding the AGN emission, we find that the inner Sérsic component contributes of the total flux of the host galaxy. Such the ratio between the bulge and total light () is consistent with the median value () found for the galaxies hosting low-mass BHs (Jiang et al., 2011a). The flatter index () and small B/T suggest the bulge of J1302 to be pseudobulge. As the pseudobulges are believed to be formed by secular processes driven by disk instabilities, including the slow rearrangement of material by bars, oval disks, and spiral structure, the presence of a low-mass AGN in J1302 seems to support the hypothesis that low-mass BHs evolve secularly and are most likely not fueled by major mergers (Kormendy & Kennicutt, 2004).
For galaxies with classical bulges, BH masses have been found to correlate with bulge luminosity (the relation, e.g., Marconi & Hunt 2003). Considering that pseudobulges have quite different properties from those rapidly formed classical bulges, we may expect differing BH scaling relations as well, which are observed with small samples with dynamical BH masses (Greene et al., 2008). We discuss shortly the connection between the BH in J1302 and the bulge luminosity of its host galaxy. The lack of detectable BELs from either direct and polarized optical lights prevents us from estimating the mass of the central BH using conventional virial method. If we employ the relation at the low-mass end by Xiao et al. (2011) and use the velocity dispersion traced by narrow lines, we find a BH mass of M⊙ for J1302 (S13). For the estimate an absolute magnitude for the bulge, we use the F435W B-band magnitude of the corresponding Sérsic component, which yields for the host galaxy. Extrapolating the Graham (2007) relation down to a lower luminosity, we find a predicted mass of M⊙, which is a factor of higher than current estimate. Adopting the recently revised relation by McConnell & Ma (2013), we obtain a predicted mass of M⊙(assuming a conversion factor of =0.9 for the bulge lights, Bentz et al. 2009). Using the -band absolute magnitude and the Bentz et al. (2009) relation result in a similar higher BH mass of M⊙. Note that the pseudobulge in J1302 may contain younger stars which would affect the estimate on the -band bulge luminosity. We find mag for the host galaxy, which is close to the typical color of S0/Sab galaxies found in Fukugita et al. (1995), mag, suggesting that the correction for age or mass-to-light ratio to the bulge luminosity is small. Therefore, though with large uncertainty associated with the BH mass measurement, J1302 , like other pseudobulges containing low-mass BHs (Greene et al. 2008; Jiang et al. 2011a), appears to deviate from the relation of classical bulges and elliptical galaxies.
3.3.1 Nature of the Extra Lights in the Optical
As we mentioned in Section 3.1, fitting the XMM-Newton UV and the X-ray SED with optxagnf model identified the presence of a significant optical excess in the HST bands, although this model accounts for the X-ray emission very nicely. The unresolved morphology from the HST suggests that the optical excess emission comes from a very compact region of pc, which is likely associated with a NSC. The coexistence of NSCs with BHs is not unusual and has been inferred for many low mass AGNs (e.g., Seth et al., 2008, 2010). For example, it has already been demonstrated that the first two prototype of this kind, NGC 4395 and POX 52, has both an AGN and a nuclear star cluster in its center (Filippenko & Ho, 2003; Thornton et al., 2008).
We attempted to fit the optical excess in the SED (XMM-Newton/UVW1, HST/F435W and HST/F814W) using stellar population models representing emission from a stellar cluster. We used the Maraston (2005) simple stellar population models which are constructed assuming the Salpeter initial mass function. These models provide spectra over a finely spaced age and metallicity grid555See http://www.maraston.eu. However, the metallicity () of the stellar population could not be constrained and so we froze it to Solar values as it is the approximate midpoint of the metallicity range in the Maraston (2005) model. The best fit model is shown in Figure 5 (grey curve). The age of the stellar population was found to be 80 Myr. Changing the metallicity to lower values results in higher ages. For instance, fixing metallicity at and yields a stellar age equal to 300 Myr and 65 Myr, respectively. Note that previous studies have found significant evidence for multiple stellar populations in NSCs (e.g., Siegel et al. 2007; Seth et al. 2010), but the statistics of our data are insufficient to allow us to attempt to fit for an additional stellar contribution.
Although the formation mechanisms for NSCs are still under debates, they may lead to the formation of central BHs. One possibility is that NSCs are created from gas accretion onto the nucleus due to disk gas dynamics (Bekki et al. 2006). This in situ scenario is favored by observations that NSCs in spiral galaxies have complicated star formation histories, suggesting frequent episodic star formation (Walcher et al. 2006; Rossa et al. 2006). Indeed, Caldwell & Rose (1997) have shown that J1302 is a very strong post-starburst galaxy with a post-starburst age of 500 Myr, based on the presence of enhanced Balmer absorption lines compared to those in normal galaxies (see also S13). It is quite possible that the formation of central BH in J1302 was connected with the starburst event. The presence of a young stellar population with ages up to Myr around the J1302 nucleus seems to reconcile this picture, indicative of further gas accretion onto the nucleus. If our interpretation of optical excess component with NSC is correct, we could be expecting its mass is the same order as BH, i.e., M⊙. Future high-resolution observations with Integral Field Unit spectroscopy will be helpful to construct a dynamical model to estimate the mass (and mass-to-light ratio) of the NSC and of a central BH inside it.
4. Conclusions
We have conducted follow-up multiwavelength study of the nuclear and host galaxy properties of J1302 , a newly discovered low mass galaxy that displays extremely soft and variable X-ray emission. We have shown that the UV-to-X-ray SED can be well and self-consistently described by thermal emission from an optically thick accretion disk around a BH, with a optically thin Comptonized emission from corona. The derived parameters ( and ) from modeling agree with the independent estimates based on the optical data. We thus consider the ultrasoft X-ray emission could be a signature of X-rays from an accretion disk around an IMBH.
The source appears intrinsically X-ray weak, especially in the quiescent state, with hard X-ray emission at least three times fainter than in typical AGNs. The lack of hard X-ray emission may be connected with the absence of broad optical lines in J1302. We performed a pilot search for weak or hidden broad emission lines using optical spectropolarimetry observations. Although a small polarization is detected, no polarized broad (or ) is seen, indicating that J1302 likely intrinsically lacks a BLR. J1302 is detected significantly in the radio, which is most likely related to the accreting low-mass BH. But the radio emission is not strong enough to qualify the source as radio loud.
We performed a comprehensive analysis of the HST images in and bands to quantify the structure and morphology of the host galaxy. The galaxy is an isolated, nearly edge-on S0 galaxy with a relatively weak pseudobulge (Sérsic index ) that accounts for 15% of the total light of the host galaxy. The inner structure of the galaxy is complex, with a significant “X”-shaped structure in the residual image, which may result from the internal disk dynamical instabilities. The pseudobulge has relatively blue colors (1.33 mag). Consistent with other low-mass AGNs, J1302 seems to deviate from the relation of classical bulges and elliptical galaxies. Although unresolved in the morphology, we identified a significant optical excess in the HST bands from the SED modeling, which is likely due to the presence of a NSC. Further high resolution UV observations with HST are required to confirm this scenario, and helpful to further constrain the stellar properties of NSC if present.
References
- Ai et al. (2011) Ai, Y. L., Yuan, W., Zhou, H. Y., Wang, T. G., & Zhang, S. H. 2011, ApJ, 727, 31
- Antonucci (1993) Antonucci, R. 1993, ARA&A, 31, 473
- Begelman et al. (2006) Begelman, M. C., Volonteri, M., & Rees, M. J. 2006, MNRAS, 370, 289
- Bekki et al. (2006) Bekki, K., Couch, W. J., & Shioya, Y. 2006, ApJ, 642, L133
- Bentz et al. (2009) Bentz, M. C., Peterson, B. M., Pogge, R. W., & Vestergaard, M. 2009, ApJ, 694, L166
- Biggs & Ivison (2006) Biggs, A. D., & Ivison, R. J. 2006, MNRAS, 371, 963
- Caldwell & Rose (1997) Caldwell, N., & Rose, J. A. 1997, AJ, 113, 492
- Caldwell et al. (1999) Caldwell, N., Rose, J. A., & Dendy, K. 1999, AJ, 117, 140
- Chary & Elbaz (2001) Chary, R., & Elbaz, D. 2001, ApJ, 556, 562
- Chartas et al. (2009) Chartas, G., Kochanek, C. S., Dai, X., Poindexter, S., & Garmire, G. 2009, ApJ, 693, 174
- Corbel et al. (2013) Corbel, S., Coriat, M., Brocksopp, C., et al. 2013, MNRAS, 428, 2500
- Crummy et al. (2006) Crummy, J., Fabian, A. C., Gallo, L., & Ross, R. R. 2006, MNRAS, 365, 1067
- Desroches et al. (2009) Desroches, L.-B., Greene, J. E., & Ho, L. C. 2009, ApJ, 698, 1515
- Dewangan et al. (2008) Dewangan, G. C., Mathur, S., Griffiths, R. E., & Rao, A. R. 2008, ApJ, 689, 762-774
- Done et al. (2007) Done, C., Gierliński, M., & Kubota, A. 2007, A&A Rev., 15, 1
- Done et al. (2012) Done, C., Davis, S. W., Jin, C., Blaes, O., & Ward, M. 2012, MNRAS, 420, 1848
- Dong et al. (2012) Dong, X.-B., Ho, L. C., Yuan, W., et al. 2012, ApJ, 755, 167
- Dong et al. (2012) Dong, R., Greene, J. E., & Ho, L. C. 2012, ApJ, 761, 73
- Elbaz et al. (2010) Elbaz, D., Hwang, H. S., Magnelli, B., et al. 2010, A&A, 518, L29
- Elitzur & Ho (2009) Elitzur, M., & Ho, L. C. 2009, ApJ, 701, L91
- Elvis et al. (1994) Elvis, M., Wilkes, B. J., McDowell, J. C., et al. 1994, ApJS, 95, 1
- Erwin et al. (2008) Erwin, P., Pohlen, M., & Beckman, J. E. 2008, AJ, 135, 20
- Fabian et al. (2009) Fabian, A. C., Zoghbi, A., Ross, R. R., et al. 2009, Nature, 459, 540
- Falcke et al. (2004) Falcke, H., Körding, E., & Markoff, S. 2004, A&A, 414, 895
- Ferrarese & Merritt (2000) Ferrarese, L., & Merritt, D. 2000, ApJ, 539, L9
- Filippenko & Ho (2003) Filippenko, A. V., & Ho, L. C. 2003, ApJ, 588, L13
- Fukugita et al. (1995) Fukugita, M., Shimasaku, K., & Ichikawa, T. 1995, PASP, 107, 945
- Gallo et al. (2012) Gallo, E., Miller, B. P., & Fender, R. 2012, MNRAS, 423, 590
- Gebhardt et al. (2000) Gebhardt, K., Bender, R., Bower, G., et al. 2000, ApJ, 539, L13
- Godet et al. (2012) Godet, O., Plazolles, B., Kawaguchi, T., et al. 2012, ApJ, 752, 34
- Graham (2007) Graham, A. W. 2007, MNRAS, 379, 711
- Greene & Ho (2004) Greene, J. E., & Ho, L. C. 2004, ApJ, 610, 722
- Greene et al. (2006) Greene, J. E., Ho, L. C., & Ulvestad, J. S. 2006, ApJ, 636, 56
- Greene & Ho (2007) Greene, J. E., & Ho, L. C. 2007a, ApJ, 656, 84
- Greene & Ho (2007b) Greene, J. E., & Ho, L. C. 2007b, ApJ, 670, 92
- Greene et al. (2008) Greene, J. E., Ho, L. C., & Barth, A. J. 2008, ApJ, 688, 159-179
- Greene (2012) Greene, J. E. 2012, Nature Communications, 3, 1304
- Gültekin et al. (2014) Gültekin, K., Cackett, E. M., King, A. L., Miller, J. M., & Pinkney, J. 2014, ApJ, 788, L22
- Gunn et al. (1998) Gunn, J. E., Carr, M., Rockosi, C., et al. 1998, AJ, 116, 3040
- Heckman et al. (2005) Heckman, T. M., Ptak, A., Hornschemeier, A., & Kauffmann, G. 2005, ApJ, 634, 161
- Kormendy & Ho (2013) Kormendy, J., & Ho, L. C. 2013, ARA&A, 51, 511
- Ho (1999) Ho, L. C. 1999, ApJ, 516, 672
- Ho et al. (2012) Ho, L. C., Kim, M., & Terashima, Y. 2012, ApJ, 759, L16
- Ho & Kim (2016) Ho, L. C., & Kim, M. 2016, ApJ, 821, 48
- Ivison et al. (2010) Ivison, R. J., Magnelli, B., Ibar, E., et al. 2010, A&A, 518, L31
- Jiang et al. (2011a) Jiang, Y.-F., Greene, J. E., Ho, L. C., Xiao, T., & Barth, A. J. 2011a, ApJ, 742, 68
- Jiang et al. (2011b) Jiang, Y.-F., Greene, J. E., & Ho, L. C. 2011b, ApJ, 737, L45
- Jiang et al. (2013) Jiang, N., Ho, L. C., Dong, X.-B., Yang, H., & Wang, J. 2013, ApJ, 770, 3
- Jin et al. (2012a) Jin, C., Ward, M., Done, C., & Gelbord, J. 2012a, MNRAS, 420, 1825
- Jin et al. (2012b) Jin, C., Ward, M., & Done, C. 2012b, MNRAS, 425, 907
- Jin et al. (2016) Jin, C., Done, C., & Ward, M. 2016, MNRAS, 455, 691
- Kamizasa et al. (2012) Kamizasa, N., Terashima, Y., & Awaki, H. 2012, ApJ, 751, 39
- Kewley et al. (2006) Kewley, L. J., Groves, B., Kauffmann, G., & Heckman, T. 2006, MNRAS, 372, 961
- Kellermann et al. (1989) Kellermann, K. I., Sramek, R., Schmidt, M., Shaffer, D. B., & Green, R. 1989, AJ, 98, 1195
- Kormendy & Kennicutt (2004) Kormendy, J., & Kennicutt, R. C., Jr. 2004, ARA&A, 42, 603
- Laurikainen et al. (2014) Laurikainen, E., Salo, H., Athanassoula, E., Bosma, A., & Herrera-Endoqui, M. 2014, MNRAS, 444, L80
- Leighly et al. (2007) Leighly, K. M., Halpern, J. P., Jenkins, E. B., et al. 2007, ApJ, 663, 103
- Li & Shen (2012) Li, Z.-Y., & Shen, J. 2012, ApJ, 757, L7
- Li et al. (2016) Li, Y.-P., Yuan, F., & Wang, Q. D. 2016, arXiv:1611.02904
- Lin et al. (2013) Lin, D., Irwin, J. A., Godet, O., Webb, N. A., & Barret, D. 2013, ApJ, 776, L10
- Ludlam et al. (2015) Ludlam, R. M., Cackett, E. M., Gültekin, K., et al. 2015, MNRAS, 447, 2112
- McHardy et al. (2006) McHardy, I. M., Koerding, E., Knigge, C., Uttley, P., & Fender, R. P. 2006, Nature, 444, 730
- Marconi & Hunt (2003) Marconi, A., & Hunt, L. K. 2003, ApJ, 589, L21
- Mahajan et al. (2010) Mahajan, S., Haines, C. P., & Raychaudhury, S. 2010, MNRAS, 404, 1745
- Maraston (2005) Maraston, C. 2005, MNRAS, 362, 799
- McConnell & Ma (2013) McConnell, N. J., & Ma, C.-P. 2013, ApJ, 764, 184
- Merloni et al. (2003) Merloni, A., Heinz, S., & di Matteo, T. 2003, MNRAS, 345, 1057
- Moran et al. (1999) Moran, E. C., Filippenko, A. V., Ho, L. C., et al. 1999, PASP, 111, 801
- Moran et al. (2005) Moran, E. C., Eracleous, M., Leighly, K. M., et al. 2005, AJ, 129, 2108
- Moustakas et al. (2006) Moustakas, J., Kennicutt, R. C., Jr., & Tremonti, C. A. 2006, ApJ, 642, 775
- Miller et al. (2009) Miller, N. A., Hornschemeier, A. E., & Mobasher, B. 2009, AJ, 137, 4436
- Miniutti et al. (2009) Miniutti, G., Ponti, G., Greene, J. E., et al. 2009, MNRAS, 394, 443
- Miniutti et al. (2013) Miniutti, G., Saxton, R. D., Rodríguez-Pascual, P. M., et al. 2013, MNRAS, 433, 1764
- Nicastro (2000) Nicastro, F. 2000, ApJ, 530, L65
- Nyland et al. (2012) Nyland, K., Marvil, J., Wrobel, J. M., Young, L. M., & Zauderer, B. A. 2012, ApJ, 753, 103
- Moran et al. (2014) Moran, E. C., Shahinyan, K., Sugarman, H. R., Vélez, D. O., & Eracleous, M. 2014, AJ, 148, 136
- Page et al. (2012) Page, M. J., Brindle, C., Talavera, A., et al. 2012, MNRAS, 426, 903
- Pan et al. (2015) Pan, H.-W., Yuan, W., Zhou, X.-L., Dong, X.-B., & Liu, B. 2015, ApJ, 808, 163
- Panessa et al. (2006) Panessa, F., Bassani, L., Cappi, M., et al. 2006, A&A, 455, 173
- Peng et al. (2002) Peng, C. Y., Ho, L. C., Impey, C. D., & Rix, H.-W. 2002, AJ, 124, 266
- Peng et al. (2010) Peng, C. Y., Ho, L. C., Impey, C. D., & Rix, H.-W. 2010, AJ, 139, 2097
- Plotkin et al. (2016) Plotkin, R. M., Gallo, E., Haardt, F., et al. 2016, ApJ, 825, 139
- Pohlen & Trujillo (2006) Pohlen, M., & Trujillo, I. 2006, A&A, 454, 759
- Polletta et al. (2007) Polletta, M., Tajer, M., Maraschi, L., et al. 2007, ApJ, 663, 81
- Proga (2005) Proga, D. 2005, ApJ, 630, L9
- Reines & Deller (2012) Reines, A. E., & Deller, A. T. 2012, ApJ, 750, L24
- Reines et al. (2013) Reines, A. E., Greene, J. E., & Geha, M. 2013, ApJ, 775, 11
- Reis & Miller (2013) Reis, R. C., & Miller, J. M. 2013, ApJ, 769, L7
- Rossa et al. (2006) Rossa, J., van der Marel, R. P., Böker, T., et al. 2006, AJ, 132, 1074 6
- Schramm et al. (2013) Schramm, M., Silverman, J. D., Greene, J. E., et al. 2013, ApJ, 773, 150
- Skrutskie et al. (2006) Skrutskie, M. F., Cutri, R. M., Stiening, R., et al. 2006, AJ, 131, 1163
- Schmidt et al. (1992) Schmidt, G. D., Stockman, H. S., & Smith, P. S. 1992, ApJ, 398, L57
- Seth et al. (2008) Seth, A., Agüeros, M., Lee, D., & Basu-Zych, A. 2008, ApJ, 678, 116
- Seth et al. (2010) Seth, A. C., Cappellari, M., Neumayer, N., et al. 2010, ApJ, 714, 713
- Siegel et al. (2007) Siegel, M. H., Dotter, A., Majewski, S. R., et al. 2007, ApJ, 667, L57
- Steffen et al. (2006) Steffen, A. T., Strateva, I., Brandt, W. N., et al. 2006, AJ, 131, 2826
- Sun et al. (2013) Sun, L., Shu, X., & Wang, T. 2013, ApJ, 768, 167 (S13)
- Terashima et al. (2012) Terashima, Y., Kamizasa, N., Awaki, H., Kubota, A., & Ueda, Y. 2012, ApJ, 752, 154
- Thornton et al. (2008) Thornton, C. E., Barth, A. J., Ho, L. C., Rutledge, R. E., & Greene, J. E. 2008, ApJ, 686, 892-910
- van Dokkum et al. (2015) van Dokkum, P. G., Abraham, R., Merritt, A., et al. 2015, ApJ, 798, L45
- Vasudevan & Fabian (2009) Vasudevan, R. V., & Fabian, A. C. 2009, MNRAS, 392, 1124
- Volonteri et al. (2003) Volonteri, M., Haardt, F., & Madau, P. 2003, ApJ, 582, 559
- Volonteri (2010) Volonteri, M. 2010, A&A Rev., 18, 279
- Walcher et al. (2006) Walcher, C. J., Böker, T., Charlot, S., et al. 2006, ApJ, 649, 692
- Wang et al. (2001) Wang, T. G., Matsuoka, M., Kubo, H., Mihara, T., & Negoro, H. 2001, ApJ, 554, 233
- Wilkins et al. (2015) Wilkins, D. R., Gallo, L. C., Grupe, D., et al. 2015, MNRAS, 454, 4440
- White & Rees (1978) White, S. D. M., & Rees, M. J. 1978, MNRAS, 183, 341
- Wright et al. (2010) Wright, E. L., Eisenhardt, P. R. M., Mainzer, A. K., et al. 2010, AJ, 140, 1868-1881
- Wrobel & Ho (2006) Wrobel, J. M., & Ho, L. C. 2006, ApJ, 646, L95
- Xiao et al. (2011) Xiao, T., Barth, A. J., Greene, J. E., et al. 2011, ApJ, 739, 28
- Yuan et al. (2010) Yuan, W., Liu, B. F., Zhou, H., & Wang, T. G. 2010, ApJ, 723, 508
- Yuan et al. (2014) Yuan, W., Zhou, H., Dou, L., et al. 2014, ApJ, 782, 55
- Zhou et al. (2015) Zhou, X.-L., Yuan, W., Pan, H.-W., & Liu, Z. 2015, ApJ, 798, L5
| Filter | Component | (″/pc) | ||||||
|---|---|---|---|---|---|---|---|---|
| (1) | (2) | (3) | (4) | (5) | (6) | (7) | (8) | (9) |
| F814W | PSF | 18.12 | ||||||
| Sérsic | 16.39 | 1.45 | 0.41/193 | 0.54 | 2.68 | |||
| Exp Disk | 14.50 | [1.0] | 2.86/1332 | 0.24 | ||||
| F450W | PSF | 19.04 | ||||||
| Sérsic | 17.57 | [1.45] | 0.37/178 | 0.52 | 1.49 | |||
| Exp Disk | 16.05 | 2 | [1.0] | 2.69/1280 | 0.24 |
Note. — Col. (1): filter. Col. (2): Components used in the fitting schemes. Col. (3): The integrated magnitudes on the Vega system, not corrected for Galactic extinction. Col. (4): The absolute Johnson and magnitude after Galactic extinction correction. We assume a power-law continuum for the central AGN, an Sb galaxy for the Sérsic component, and an galaxy for the disk, using templates from Kinney et al (1996). Col. (5): Flux density in units of . Col. (6): The Sérsic index. Col. (7): The effective radius of the Sérsic component or scale length of exponential disk, in units of arcsec and pc, respectively. Col. (8): Axis ratio. Col. (9): Diskness (negative)/boxiness (positive) parameter, defined in Eqn. (3) of Peng et al. (2002). The brackets mean that they are fixed. The formal errors given by GALFIT are all tiny: for magnitude and Sérsic index, for .
| Instrument | Wavelength or Energy | log (/ ) | Reference |
|---|---|---|---|
| GALEX† | 1539Å (FUV) | 41.86 (41.33) | (1) |
| GALEX† | 2316Å (NUV) | 42.29 (41.06) | (1) |
| XMM† | 2120Å (UVW2) | 41.83 (41.98) | (1) |
| XMM† | 2910Å (UVW1) | 42.39 (41.74) | (1) |
| SDSS | 3588Å () | 42.88 | (2) |
| SDSS | 4862Å () | 43.31 | (2) |
| SDSS | 6289Å () | 43.39 | (2) |
| SDSS | 7712Å () | 43.40 | (2) |
| SDSS | 9230Å () | 43.38 | (2) |
| HST† | 4500Å (B) | 43.19 (41.90) | (1) |
| HST† | 8140Å (I) | 43.35 (41.83) | (1) |
| 2MASS | 1.22m (J) | 43.37 | (2) |
| 2MASS | 1.61m (H) | 43.31 | (2) |
| 2MASS | 2.12m (K) | 43.14 | (2) |
| WISE | 3.4 m (W1) | 42.51 | (1) |
| WISE | 4.6 m (W2) | 42.12 | (1) |
| WISE | 12 m (W3) | 41.46 | (1) |
| WISE | 22 m (W4) | 41.70 | (1) |
| Spitzer | 24m (MIPS) | 41.22 | (3) |
| VLA | 20 cm | 37.19 | (4) |
| XMM | 0.5–2 keV (PN quiescent sate) | 41.83 | (5) |
| XMM | 0.5–2 keV (PN flare sate) | 40.45 | (5) |
| XMM | 2–10 keV (PN) | 40.31 | (5) |
Note. — (1) This work; (2) From NED database; (3) Mahajan et al. (2010); (4) Miller et al. (2009); (5) Sun et al. (2013). †Host galaxy flux from the GALFIT decomposition, while the AGN flux is given in parenthesis.
| Model Component | Parameter | Quiescent | Flare |
|---|---|---|---|
| Extinction | E(B-V) | 0.0128† | 0.0128† |
| Absorption | ( cm-2) | ||
| optxagnf | ( M⊙) | 2.8 | 1.7 |
| log | -0.84 | -0.82 | |
| () | 10† | 21.2 | |
| log () | 5.0† | 5.0† | |
| (keV)⋆ | 0.1 | 0.13 | |
| ⋆: | 18.0 | 24.2 | |
| 0.07 | |||
| Statistics | 26.4/40 | 37.9/24 |
Note–
⋆: The 90% confidence errors are calculated with BH mass fixed.
†: The parameters are fixed during the fittings.
For the flare state spectral fittings, the errors on BH and log are
derived by fixing the corona breaking radius.
| Name | Morph. | log() | a | log(L0.5-2keVa) | log(LO[III]) | log(L1.4GHz) | Ref. | |||
|---|---|---|---|---|---|---|---|---|---|---|
| M⊙ | ||||||||||
| RX J1301-2746 | disk | 0.024 | 5.9 | 7.1(4.4) | 40.45 (41.8) | 39.64 | 37.6 | -2.04 (-1.50) | -0.99 (-0.46) | 1 |
| 2XMM J1231+1106 | disk | 0.119 | 5 | 4.8 | 42.13 (42.5) | 40.22 | -1.89 (-1.68) | -0.77 (-0.57) | 2,3 | |
| GSN 069 | 0.018 | 6.08 | 6.7 | 42.08 | 40.32 | -2 | -0.89 | 4 |
a Parentheses show the values corresponding to flare state. b The difference between and the value expected from the Steffen et al. (2006) relation. (1) S13; (2) Ho et al. 2012; (3) Terashima et al. (2012); (4) Miniutti et al. (2013)
Appendix A Test on the HST AGN-to-galaxy decomposition
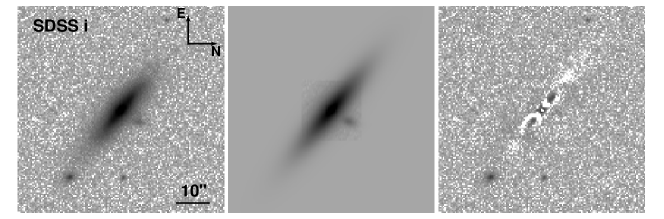
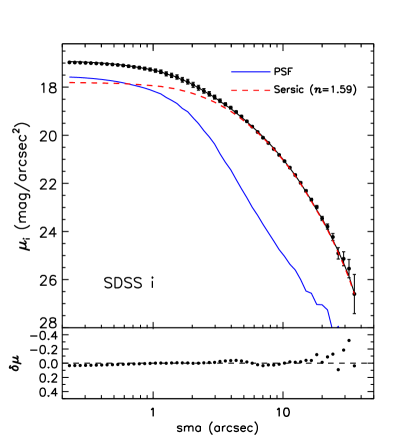
Due to the complex galaxy morphology observed with HST, our GALFIT decompositions may introduce potential systematic errors. We have looked at images and identified the possible bar structures, which can be seen in Figure 1. In fact, our fittings with PSF+sersic models are quiet good, except for the large residuals at large radius ( arcsec). The disk component is always fitted by an exponential profile, as in nearby inactive galaxies and galaxies with IMBHs, although disk profiles do vary at large radii (Jiang et al., 2011b). Therefore, we investigated the effect of possible systematic biases due to the variations of outer disk profile. For simplicity, we choose to work on the HST F814W image. We first allowed the Sérsic index for the outer disk component to vary in our fits, but found similar results. This is perhaps because HST is not able to detect extended, lower surface brightness emission component of the galaxy when the exposure is not deep (e.g., van Dokkum et al., 2015). We then turned to the SDSS I-band image which has a larger field of view with very good measurements of the sky background (Gunn et al., 1998). This is important in studying the extended galaxy morphology, particularly the low-surface-brightness structure like galactic disk (e.g., Pohlen & Trujillo, 2006; Erwin et al., 2008; Jiang et al., 2013). We found the disk can be modeled with a Sérsic component but with a slightly higher index of . There are no systematic residuls left as can be see from the one-dimensional surface brightness distribution (Figure A1). We then fixed the Sérsic index at and refitted the model to the HST F814W image. We found most parameters remain unchanged in our fits, except for the magnitudes. Though the residuals at large radii disappear (Figure A2, right panel), the fit becomes worse in the inner region where the PSF and central bulge dominate. A comparison of results by fixing (exponential profile) and can be found in Figure A2 and Table A1. Since the difference between magnitudes of the AGN and galaxy component is less than 0.3 mag, we conclude that our fits are not introducing major systematic errors.
| Filter | Component | (″/pc) | |||||
|---|---|---|---|---|---|---|---|
| (1) | (2) | (3) | (4) | (5) | (6) | (7) | (8) |
| F814W (old) | PSF | 18.12 | |||||
| Sérsic | 16.39 | 1.45 | 0.41/193 | 0.54 | 2.63 | ||
| Exp Disk | 14.50 | [1.0] | 2.86/1332 | 0.24 | |||
| F814W (new) | PSF | 17.98 | |||||
| Sérsic | 16.73 | [1.45] | [0.41/193] | 0.61 | 5.00 | ||
| Sérsic | 14.33 | [1.59] | 4.97/2338 | 0.25 |
Note– Col. (2): Components used in the fitting schemes. Col. (3): The integrated magnitudes on the Vega system, not corrected for Galactic extinction. Col. (4): The absolute Johnson and magnitude after Galactic extinction correction. We assume a power-law continuum ( for the central AGN, an Sb galaxy for the Sérsic component, and an galaxy for the disk, using templates from Kinney et al (1996). Col. (5): The Sérsic index. Col. (6): The effective radius of the Sérsic component or scale length of exponential disk, in units of arcsec and pc, respectively. Col. (7): Axis ratio. Col. (8): Diskiness (negative)/boxiness (positive) parameter, defined in Eqn. (3) of Peng et al. (2002). The brackets mean that they are fixed. The formal errors given by GALFIT are all tiny: for magnitude and Sérsic index, for .
Appendix B Test on the AGN-to-galaxy decomposition in the UV
Having established the central point source and pseudobulge detections in the HST optical, we try to perform similar image decomposition of the AGN and host galaxy of J1302 in the UV using GALFIT. Although the UV images have a low spatial resolution (″) compared with the HST optical, they are still very useful for us to understand its host galaxy and put further constraint on the SED of the AGN (Section 3.1). We chose to first work with the XMM-Newton OM UVW1 image (Å), which is closest to the HST F450W filter and has a better resolution than the GALEX. The UVW1 PSF is constructed from the field of 3C273 by stacking 5 bright, isolated point sources from the catalog of Page et al. (2012). As for the HST, the host galaxy is represented by a Sérsic profile and we performed the fittings with PSF+Sérsic allowing all parameters to vary. The image decomposition is shown in Figure 11. The fit is good with a reduced , and the best-fit parameters for the galaxy, i.e., Sérsic index, axis ratio, and position angle, are all close to that obtained from the HST. Note that fitting with a single Sérsic profile leaves acceptably residuals, but the fit statistics is worse (the difference of is 13, Table A1). In addition, the Sérsic index () is much larger than that obtained from the HST optical (), suggesting that a more concentrated light distribution is required which may be due to the presence of unresolved AGN emission.
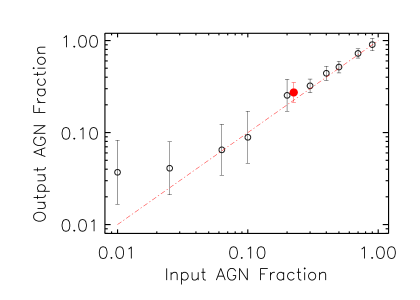
Since the XMM-Newton/OM spatial resolution is much worse than the HST, we sought to test the robustness of our AGN+galaxy image decomposition. To do so, we used GALFIT to simulate a point source along with a Sérsic profile host galaxy, with total flux adding up to the measured flux in the OM/UVW1. We create a large set of simulated galaxies with profiles assumed to be the best fit Sérsic model obtained above, varying the total integrated flux of the central point source from =24.7 to 19.7 mag. The magnitude range represents point sources with fluxes from 0.9 to 1/100 of the host galaxy flux. We then place these models randomly on empty regions of the real UVW1 image, trying to measure their properties in the presence of photometric noise. Note that when the AGN emission exceeds the 70% of the host galaxy, the fitting yields an unphysical high value of Sérsic index (10). In this case, we set constraints on the Sérsic index to values within 0.7 to 6 to avoid catastrophic fitting results. Figure 12 summarizes the results of these simulations, plotting the input AGN fraction against the measured fraction from the simulated images. We find that the decomposition method is able to recover the AGN flux with a 80% accuracy at , corresponding to the ten percent of the galaxy flux. Below , the fittings tend to overestimate the AGN flux. For instance, the measured AGN fraction is a factor of four higher than the input value at . We also performed the AGN and galaxy decomposition for the XMM-Newton/OM UVW2 image (Å), which is shown in Figure 13. Since the galaxy is marginally resolved in the UVW2, we fit its profile with the same Sérsic model as that of UVW1 image, but with all parameters held fixed except its magnitude. The results of the decomposition are shown in Table A1. Note that the total flux (AGN+Sérsic) from our GALFIT decomposition in the both filters is in good agreement with the aperture photometry from the XMM-Newton/OM UV catalog (Page et al. 2012).
| Filter | Component | Magnitude | (″/kpc) | b/a | PA | |||
|---|---|---|---|---|---|---|---|---|
| (1) | (2) | (3) | (4) | (5) | (6) | (7) | (8) | (9) |
| UVW1 2910Å | PSF | 21.29 | 1.45 | … | … | … | … | … |
| Sérsic | 19.670.06 | 6.45 | 2.060.37 | 3.570.16/(1.68) | 0.30.01 | 57.30.8 | 1861/1670 | |
| Single Sérsic | 19.370.03 | 8.50 | 4.280.4 | 2.75/(1.29) | 0.30.01 | 57.30.8 | 1874.1/1673 | |
| UVW2 2120Å | PSF | 23.04 | 3.47 | … | … | … | … | … |
| Sérsic† | 23.42 | 2.45 | [2.06] | [3.75] | [0.3] | [57.3] | 1792/1674 |
Note– Col. (1): XMM-Newton OM filter. Col. (2): Components used in the fitting schemes. Col. (3): The magnitudes measured from the UV counts assumed that the photometric zero point is , not corrected for Galactic extinction. Col. (4): Flux density in units of . Col. (5): The Sérsic index. Col. (6): The effective radius of the Sérsic component, in units of arcsec and kpc, respectively. Col. (7): Axis ratio. Col. (8): Position angle (degree). Col. (9): The fit statistics. †The brackets mean that they are fixed.