PHOTOSPHERIC VELOCITY STRUCTURES DURING THE EMERGENCE OF SMALL ACTIVE REGIONS ON THE SUN
Abstract
We study the plasma flows in the solar photosphere during the emergence of two small active regions, NOAA 9021 and 10768. Using Solar and Heliospheric Observatory/Michelson Doppler Imager data, we find that the strong plasma upflows appear at the initial stage of active region formation, with maximum upflow velocities of 1650 m s-1 and 1320 m s-1. The structures with enhanced upflows have size 8 Mm in diameter, and they exist for 1 – 2 hr. The parameters of the enhanced upflows are consistent with those of the large active region NOAA 10488, which may suggest the possibility that the elementary emerging magnetic loops that appear at the earliest phase of active region formation have similar properties, irrespective of scales of active regions. Comparison between the observations and a numerical simulation of magnetic flux emergence shows a striking consistency. We find that the driving force of the plasma upflow is at first the gas pressure gradient and later the magnetic pressure gradient.
1 Introduction
Magnetic fields on the Sun are thought to be generated in the convective zone. They emerge to the surface as -loops under the action of magnetic buoyancy and convective upflows, eventually forming active regions at the solar surface (Parker 1955; see reviews by Fan 2009 and Cheung & Isobe 2014). Active regions are different in magnetic flux content (Garcia de La Rosa, 1984; Zwaan, 1987). In small active regions, magnetic flux in each polarity is Mx –- 0.5 Mx; in white light, they contain only pores. In large active regions, the magnetic flux of each polarity exceeds 0.5 Mx; in white light, pores and sunspots are observed where the magnetic field is concentrated.
From the viewpoint of the active region development, the photospheric plasma flow at the initial stage of magnetic flux emergence is one of the most fascinating topics. The continuous full-disk observations of the Sun by Solar and Heliospheric Observatory (SOHO)/Michelson Doppler Imager (MDI) and Solar Dynamics Observatory (SDO)/Helioseismic and Magnetic Imager (HMI) have allowed us to realize this task. For example, Grigor’ev et al. (2007) found enhanced plasma upflow in the photosphere, with velocity up to 1.7 km s-1 at the beginning of emergence of the large active region NOAA 10488. Later, Grigor’ev et al. (2009) studied the initial stage of NOAA 10488 formation in detail. On the basis of a statistical analysis, Khlystova (2011) obtained a center-to-limb dependence of the negative Doppler velocities, which shows that at the initial stage of active region formation in the photosphere, the horizontal outflow plasma velocities are higher than the vertical upflows ones. Toriumi et al. (2012, 2014) detected a strong horizontal divergent flow that starts about 1 hr before the beginning of the magnetic flux emergence in the photosphere. Khlystova (2013a) found the strong horizontal divergent flows of photospheric plasma during the first hours of active region formation with high magnetic flux growth rate. Khlystova (2013b) carried out the statistical analysis on the relation of the Doppler velocities of vertical and horizontal plasma flows, with some parameters of the magnetic fields at the initial stage of active region formation.
Subsurface plasma flows in the emerging flux regions have been intensively investigated using local helioseismology. Subphotospheric signatures of the magnetic flux emergence before the active region appearance on the solar surface are surveyed using helioseismic holography (Braun, 1995; Hartlep et al., 2011; Birch et al., 2013; Barnes et al., 2014), ring-diagram analysis (Komm et al., 2008), and time-distance helioseismology (Ilonidis et al., 2011; Kholikov, 2013; Ilonidis et al., 2013; Kosovichev et al., 2016; Singh et al., 2016). In some studies, subphotospheric velocities of the magnetic flux emergence in large active regions were estimated. Kosovichev et al. (2000) have determined that the emerging magnetic flux of the active region NOAA 8131 crosses the top 10 Mm of the convective zone at about 1.3 km s-1. By tracking the sound-speed perturbations, Zharkov & Thompson (2008) estimated the velocity of magnetic flux emergence through the top 21.7 Mm of the convective zone in the active region NOAA 10790 to be 1 km s-1. Ilonidis et al. (2011) obtained the 0.3 – 0.6 km s-1 average velocity of the magnetic flux emergence in four large active regions from the 60 Mm depth to the surface. Analysis by Toriumi et al. (2013) suggested a gradual deceleration of the magnetic flux in the subphotospheric layers of NOAA 10488. According to their calculations, the velocity of the magnetic flux emergence is several km s-1 at the depth of 10 – 15 Mm, 1.5 km s-1 at 5 – 10 Mm, and 0.5 km s-1 at 2 – 5 Mm. Ilonidis et al. (2013) estimated the rise velocity of the magnetic flux in NOAA 10488 at 42 – 75 Mm depth to be 1 km s-1. Kosovichev et al. (2016) investigated the subsurface dynamics of the emerging active region NOAA 11726, the largest region during the first 5 year observations of the SDO/HMI. They found that the magnetic flux in deep (42 – 75 Mm) and subphotospheric (5 – 20 Mm) layers emerges at the same velocity of 1.4 km s-1. On the contrary, Birch et al. (2016) obtained a low upper limit of the subsurface velocity of the magnetic flux rise. In their research, the rising velocity of the magnetic fields at the 20 Mm depth does not exceed 150 m s-1.
Another possibility for probing the emerging magnetic flux in the subsurface region is to directly compare the observation of the flux emergence with simulations. Since the initial appearance of magnetic flux and the accompanying flow may be largely affected by the rising flux in the interior, a comparative study of observation and simulation may provide clues for understanding the physical state of the subsurface magnetic flux.
In this paper, we focus on flow structures in the photosphere during the initial appearance of small active regions. Section 2 describes the data that we use and their processing. Section 3 presents the analysis results of the flow structures in the emerging active regions. We compare the observational results with a numerical simulation in Section 4. Discussion and conclusions are shown in Sections 5 and 6, respectively.
2 Observations and data processing
We studied plasma flows in the photosphere during the emergence of two small active regions NOAA 9021 and 10768. The observed flows were compared with that of the large active region NOAA 10488 (Grigor’ev et al., 2007). Table 1 shows the time of emergence and position on the solar disk of the three active regions. These active regions are sub-equatorial and are located at an approximately equal heliocentric distance from the solar center, which allows us to compare them without taking into account the projection effect.
| Active Region | Time of Emergence | Coordinates | |
|---|---|---|---|
| 9021 | 2000.05.27 16:24 UT | N03 E35 B1.1 | 36∘ |
| 10768 | 2005.05.25 – 17:42 UT | S08 W32 B1.3 | 33∘ |
| 10488 | 2003.10.26 – 09:07 UT | N08 E30 B4.9 | 30∘ |
We analyzed observational data obtained by the MDI onboard the SOHO (Scherrer et al., 1995). Between 1996 and 2011, SOHO/MDI recorded the line of sight magnetic field strength, Doppler velocity, and continuum intensity of the full solar disk in the photospheric line Ni i 6768 Å. The temporal resolution of the magnetogram and Dopplergram is 1 minute; continuum image, 96 minutes. Due to the high temporal resolution of the magnetogram and Dopplergram, it is possible to track changes in the magnetic fields and plasma flows in great detail from the earliest phase of active region formation. The spatial resolution of the data is 4′′, with a 2′′ pixel size. Due to the low spatial resolution, the data do not contain a contribution of high velocities of granular convection.
We made cutout data of the emerging magnetic flux regions with a size of 160140′′ (or 8070 pixels) from the time series of full solar disk images, while taking into account solar rotation. The displacement of the region under investigation was calculated based on the differential rotation law for photospheric magnetic fields (Snodgrass, 1983) and cross-correlation analysis between magnetograms. To obtain better coalignments between the data, we picked up identical fragments from the magnetogram, Dopplergram, and continuum images, and superposed them against each other.
The Dopplergram contains velocity components of various effects that are not uniformly distributed over the solar disk (Howe et al., 2011). We removed these effects by applying the method proposed by Grigor’ev et al. (2007). Then, we applied a moving average of five images to reduce photospheric oscillations. In the Dopplergrams, the negative (positive) velocity corresponds to the blue (red) shift, or plasma motion toward (away from) the observer.
For each active region, we measured the following parameters: the total area of pores and sunspots , which is defined as the area inside the isoline of 85% of the average quiet-Sun intensity, taking into account the projection effect; the total unsigned magnetic flux , measured within the isoline of 60 G, taking into account the projection effect and subtracting the background magnetic flux that is present before the active region appearance; the growth rate of the total unsigned magnetic flux and the maximum magnetic field strength during the first 12 hr of the flux emergence; the absolute maximum values of negative and positive Doppler velocities and , and also the mean negative Doppler velocity , during the first 4 hr of the active region development; and the maximum area of velocity structure inside the 500 m s-1 isoline . The calculation region of these parameters was limited to the region of the magnetic flux emergence. To trace velocity structures, we used the 500 m s-1 isoline, because photospheric plasma flows, which are not associated with the emerging magnetic flux, are generally below this level.
In this paper, we consider small active regions that are taken from our earlier statistical study (Khlystova, 2013b), in which we used SOHO/MDI data to study photospheric plasma flows accompanying the magnetic flux emergence. As a future work, we plan to use SDO/HMI data, which have better temporal and spatial resolutions, for further investigations.
3 Long-term Evolution of Small Active Regions and Their Initial Magnetic Flux Emergence
3.1 NOAA 9021
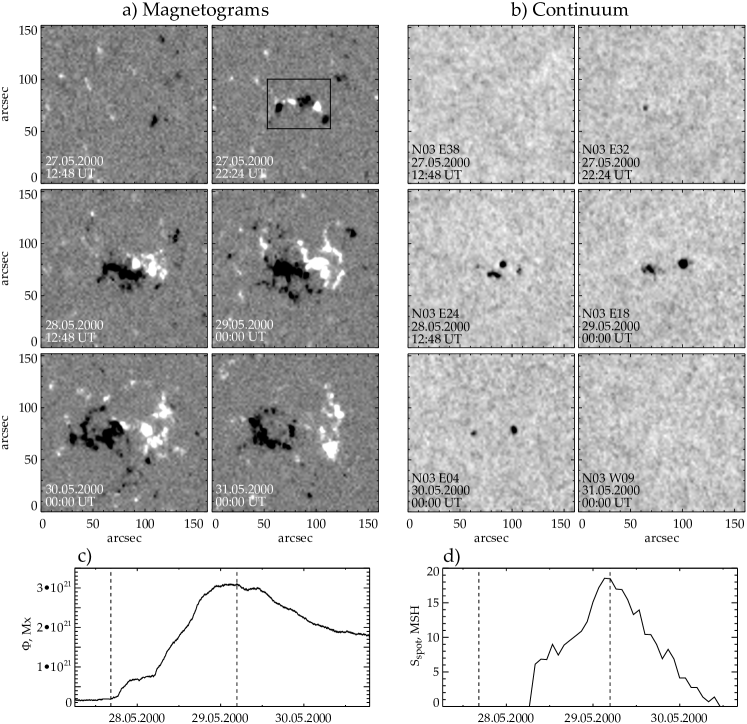
Long-term evolution. Active region NOAA 9021 begins to form on 2000 May 27, during the data gap between 13:58 and 16:24 UT at N03 E35 (see Table 1). This active region appears almost in the same area of the solar disk as NOAA 10488.
NOAA 9021 appears as two emerging bipoles, which later merge together and form a single bipolar region (Figure 1 a). The magnetic axis connecting opposite magnetic polarities becomes oriented along the equator 12 hr after the beginning of the active region emergence. The average magnetic flux growth rate during the first 12 hr of the active region development is 0.5 Mx hr-1, which is about 1/8 of that in NOAA 10488. NOAA 9021 reaches its maximal development in approximately 1.5 days with total unsigned magnetic flux 2.9 Mx (Figure 1 c). Soon after that, the active region decays quickly.
It is seen from the continuum images that only pores without penumbrae are formed in this active region (Figure 1 b). Two pores with approximately equal sizes are observed in leading and following polarities in the maximum of the active region development. Their total area reaches 19 MSH (Figure 1 d).
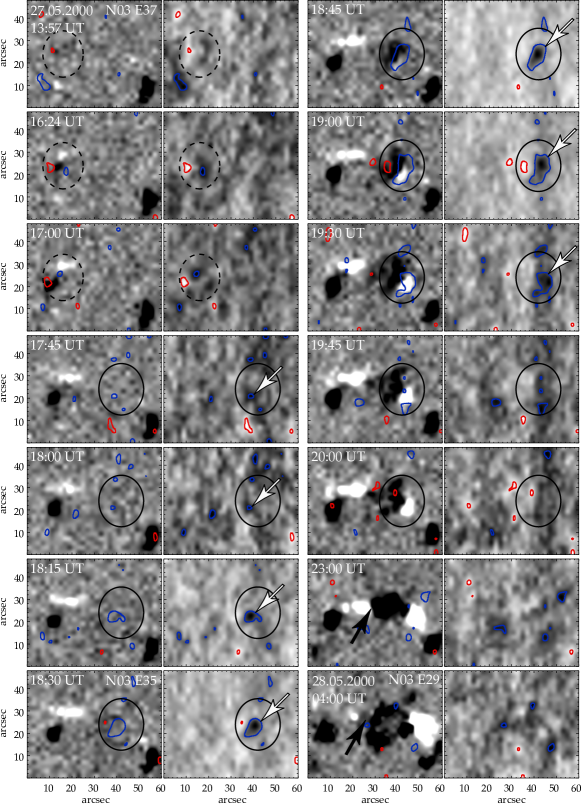
Initial stage of magnetic flux emergence. In NOAA 9021, the first bipole starts emergence in the data gap between 13:58 and 16:24 UT, May 27 (Figure 2, marked by dotted ellipse). Just after the data gap, the appeared magnetic polarities have small sizes, and their maximum magnetic field strength does not exceed 150 G. During this magnetic flux emergence, the largest negative and positive Doppler velocities do not exceed 700 m s-1 and 800 m s-1, respectively.
Approximately 2 hr after the beginning of first magnetic flux emergence, the second (main) bipole emerges to the west of the first pair (Figure 2, marked by solid ellipse). The negative polarity inside the 60 G isoline appears at 18:31 UT, while the positive polarity begins to form from 18:48 UT. The lag between the appearance times of both polarities may be due to the predominance of horizontal magnetic fields in the earliest phase of the magnetic flux emergence. In the later phase, the first and second (i.e., main) emerging bipoles show magnetic flux cancellation (Figure 2, marked by black arrows), which can be explained as magnetic reconnection between the two -shaped loops.
The plasma upflow region, which is delineated by the 500 m s-1 isoline (blue), appears at the location of the second bipole at 17:44 UT (Figure 2, marked by white arrows). However, the velocity values here do not exceed 650 m s-1. Enhancement of the negative Doppler velocity begins at 18:04 UT, i.e., 27 minutes before the magnetic flux emergence. As the photospheric magnetic flux develops, the 500 m s-1 isoline covers a considerable fraction of the magnetic elements. The region of enhanced negative Doppler velocity starts to split at 19:32 UT and disappears before 19:50 UT. Also, a small region of the positive Doppler velocity, characterized by the 500 m s-1 isoline, is observed in the following negative polarity from 18:51 UT to 19:10 UT. However, the maximum velocity does not exceed 720 m s-1.
In Figure 3, we plot the temporal evolution of the total magnetic flux, the maximum and mean values of negative and positive Doppler velocities, and the area of negative Doppler velocities inside the 500 m s-1 isoline. Whereas the magnetic flux emergence begins at 18:31 UT (Figure 3 a), the maximum negative Doppler velocity shows a rapid increase 27 minutes before, at 18:04 UT (Figure 3 b). The negative Doppler velocity reaches its peak value of 1650 m s-1 at 18:44 UT, and then begins to decrease. The mean negative Doppler velocity also greatly enhances to about twice the original value (Figure 3 c). On the other hand, the maximum positive Doppler velocity does not exceed 720 m s-1 (Figure 3 d). The area of velocity structure inside the 500 m s-1 isoline lasts for about 2 hr, with its peak value of (Figure 3 e).
3.2 NOAA 10768
Long-term evolution. NOAA 10768 begins to form on 2005 May 25, at 17:42 UT at S08 W32 (see Table 1) – that is, near the equator, approximately at the same heliocentric angle as the large active region NOAA 10488.
The magnetic flux emerges in a narrow region, where a number of small-scale magnetic elements of positive and negative polarities appear at the photosphere (Figure 4 a). Although this active region emerges near the equator, it shows a large negative tilt angle, which deviates from the Joy’s law (Hale et al., 1919). According to the DPD catalog111http://fenyi.solarobs.unideb.hu/DPD/index.html, the tilt angle in a maximum of the active region development is .
The average magnetic flux growth rate during the first 12 hr of the active region appearance is 1 Mx hr-1, which is about 1/4 of that in NOAA 10488. Time variation of the total magnetic flux shows several points of inflection (Figure 4 c), indicating that the development of this active region is caused by episodes of magnetic flux emergence. The active region reaches its maximal development in about 1.5 days, with the total unsigned magnetic flux being 2.2 Mx.
The continuum images show the appearance of pores in this active region (Figure 4 b). Similar to NOAA 9021, at its maximum of the NOAA 10768 development, there are two pores of an approximately equal size in leading and following polarities. The largest total area of the pores reaches 14 MSH (Figure 4 d). On May 29, about 3.5 days after its initial appearance, the active region rotates over the west limb. Judging from the temporal evolution (Figures 4 c and d), it is likely that this active region reaches its maximum on the near side of the solar disk. Also indicative is that NOAA 10768 completely decayed before the next solar rotation.
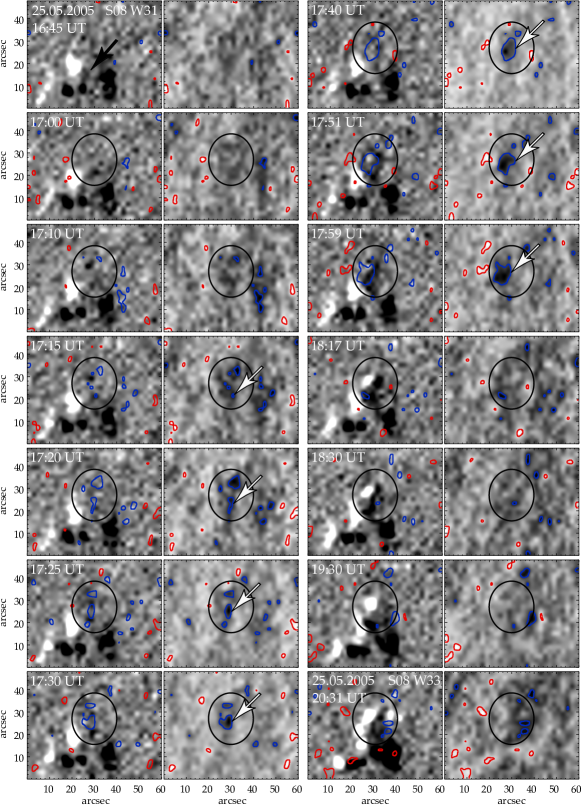
Initial stage of the magnetic flux emergence. Before the start of the magnetic flux emergence of NOAA 10768, there were several pre-existing magnetic elements of a scale of an ephemeral active region near this place, which appeared on May 25, 02:00 UT (Figure 5, marked by a black arrow on the magnetogram at 12:10 UT). NOAA 10768 begins to emerge on May 25, 17:42 UT, as a negative magnetic field (leading polarity). The shape and size of the 60 G isoline show a drastic evolution. About 16 minutes later, a positive field (following polarity) appears. The time lag in the appearance and the size asymmetry of the both polarities may attribute to the horizontal magnetic field at the apex of the emerging -loop.
It is clearly seen from Figure 5 that the negative Doppler velocity begins to enhance before the appearance of the line of sight magnetic field in the photosphere. Upflow inside the 500 m s-1 isoline arises from 17:15 UT (Figure 5, marked by white arrows). The enhanced negative Doppler velocity is localized, mainly on the polarity inversion line between the negative and positive polarities. The region of the enhanced plasma upflow disappears during the data gap from 18:03 UT to 18:17 UT, approximately 1 hr after the beginning of emergence.
Figure 6 shows the time variation for parameters of the magnetic field and plasma flows during the emergence of NOAA 10768. The growth of the total magnetic flux begins at 17:42 UT (Figure 6 a). However, the enhancement of maximum negative Doppler velocity appears 27 minutes earlier at 17:15 UT (Figure 6 b). Plasma upflow velocity reaches the peak value of 1320 m s-1 at 17:40 UT, which is 25 minutes after the velocity enhancement starts and 2 minutes before the magnetic field appears in the photosphere. After that, the maximum negative Doppler velocity reduces. The mean negative Doppler velocity increases approximately 1.5 times (Figure 6 c). The mean and maximum negative Doppler velocities reach their peak values about at the same time. The maximum positive Doppler velocity does not exceed 730 m s-1 during this period (Figure 6 d). The region with enhanced negative Doppler velocity remains for about 1 hr, with the maximum area inside the 500 m s-1 isoline reaching 4.7 km2 (Figure 6 e).
3.3 Comparison to a large active region
| Active Region | d/dt | |||
|---|---|---|---|---|
| (MSH) | (Mx) | (Mx hr-1) | (G) | |
| 9021 | 19 | 990 | ||
| 10768 | 14 | 1100 | ||
| 10488 | 1725 | 1630 |
| Active Region | ||||||
|---|---|---|---|---|---|---|
| (m s-1) | (m s-1) | (km2) | (minutes) | (minutes) | (hr) | |
| 9021 | 720 | 1650 | 27 | 40 | 2 | |
| 10768 | 730 | 1320 | 27 | 25 | 1 | |
| 10488 | 840 | 1680 | 12 | 20 | 2 |
In the previous subsections, we investigated the detailed evolution of magnetic and velocity fields in the emerging sites of the two small-scale active regions NOAA 9021 and 10768. Here we compare the observational results with those of a large active region NOAA 10488 (Grigor’ev et al., 2007).
Table 2 compares the parameters that characterize the entire active regions. The total sunspot area of NOAA 10488, 1725 MSH, is by far larger than those of the active regions NOAA 9021 and 10768, which are 19 and 14 MSH, respectively. Similarly, the total magnetic flux, magnetic flux growth rate, and maximum magnetic strength show great differences between the compared active regions. From these parameters, NOAA 10488 can be regarded as a large active region and NOAA 9021 and 10768 as small active regions (see, e.g., Zwaan 1987).
On the other hand, most of the parameters that describe velocity structures at the initial stage of the magnetic flux emergence in Table 3 do not show a clear distinction between the large and small active regions. For example, the area of the enhanced upflow is 5.4 km2, which is equivalent to a circular region with a diameter of 8 Mm for NOAA 10488 and 5.7 km2 and 4.7 km2 for the two small active regions NOAA 9021 and 10768. Other parameters are also comparable, except for the time lag between the upflow start and the initial flux appearance.
Similar parameters of enhanced upflows in the earliest phase of magnetic flux emergence in active regions of different spatial scales may point to the emergence of elementary magnetic flux with similar properties. For making firm conclusions, we may need a statistical analysis. We found the following general trends: (1) the enhanced upflow precedes the magnetic flux appearance, (2) the upflow velocity attains its peak value about the same time or after the magnetic flux emergence starts, and (3) the enhanced upflow area becomes largest after these timings (emergence start and upflow peak).
4 Physical Mechanism of the Plasma Upflow
We analyze the results of numerical simulations conducted by Toriumi et al. (2011) to investigate the driving mechanism of the photospheric plasma upflows at the initial stage of formation of the active regions that we studied in Section 3. This model is based on solving three-dimensional ideal MHD equations. The physical values are normalized by the photospheric pressure scale height =170 km, the sound speed , the sound crossing time /=25 s, and the magnetic field strength =250 G.
Calculations are performed in a rectangular domain that has the size (120,120,20)(,,)(120,120,150) or 40.8 Mm40.8 Mm28.9 Mm with the grid number of 256256256. The stratification of simulation box includes three regions: an adiabatically stratified convective zone (0), a low temperature isothermal photosphere/chromosphere (010), and a high temperature isothermal corona (20). The horizontal magnetic flux tube is initially located in the convection zone at = Mm. It has the radius =2.5=425 km, the axial magnetic field strength =15=3750 G, and the twist parameter =0.2/=1.1 km-1. The total magnetic flux of flux tube is equal to =2.1 Mx. In this section, we compare the simulation results with the elementary emerging loops in the active regions we analyzed in Section 3, not with the active regions themselves.
In Figure 7, we plot the time variation of the total magnetic flux, the maximum velocity of the plasma upflow, and the upflow area inside the /=0.05 isoline on the solar surface at =0. In the simulation a positive vertical velocity (0) corresponds to the upward plasma flow, which is shown as a negative Doppler velocity in the observations. The magnetic flux emergence on the surface begins at 36 (Figure 7 a). However, the strong upflow characterized by the /=0.05 isoline appears earlier at 25 (Figure 7 b). The upflow velocity reaches its maximal value of km s-1 at 40 and then slowly decreases. The area of the upflow reaches its peak value of km2 at 68 (i.e., after the upflow velocity attains its maximum), and then vanishes rapidly (Figure 7 c). The time evolution of velocity and area of plasma upflow on the solar surface obtained here agrees quite well with the observational results summarized in Section 3.3 (also compare Figure 7 with Figures 3 and 6). The striking consistency between the observation and the simulation suggests a common physical background for the enhanced plasma upflow.
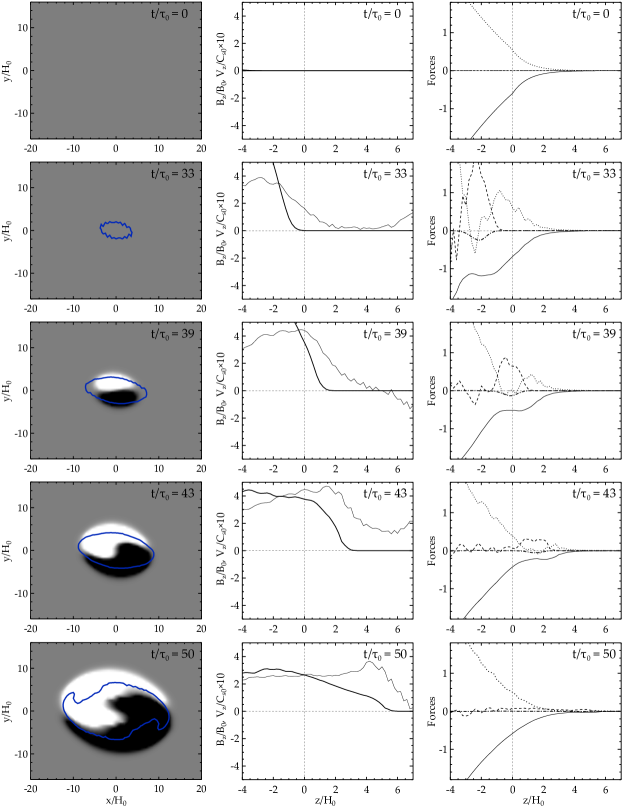
To understand the mechanism of the upflow during the magnetic flux emergence, we measure the forces that act on the plasma and investigate the dynamics. Figure 8 shows the surface magnetogram with the /=0.1 isoline of plasma upflow velocity (left column), the distributions of the magnetic field strength and the vertical velocity along the -axis at ==0 (middle column), and the distributions of the vertical component of the forces along the same axis (right column) for different instants. The left and middle columns at =33 show that the increase in the upflow velocity on the surface arises before the emerging magnetic flux appears. The right column demonstrates that this occurs due to an increase in the gas pressure gradient. Earlier, Cheung et al. (2010) and Toriumi & Yokoyama (2013) found that the increase in the gas pressure gradient at the apex of the emerging magnetic flux drives the plasma outflows at the solar surface. The increase in the gas pressure gradient happens due to the compression of the plasma by the emerging flux (Toriumi & Yokoyama, 2013). However, when the magnetic flux reaches the surface (=0), the gas pressure gradient is suppressed and the magnetic pressure gradient becomes dominant (right column at =39). Therefore, at this stage, the primary force that drives the upflow is the magnetic pressure gradient instead of the gas pressure gradient. In the later stage, the upflow velocity decreases because the emerging magnetic flux expands into the solar atmosphere and the magnetic pressure gradient becomes less pronounced (=43 and 50).
Therefore, we can conclude that there exists two distinct driving forces for the plasma upflows, depending on the evolution stage. Until just before the magnetic flux reaches the photosphere, the upflow is caused by the gas pressure gradient, while after the magnetic flux appears in the photosphere, the magnetic pressure gradient plays a key role.
5 Discussion
In this study, we analyzed the plasma flow structures that accompany the magnetic flux emergence events in the photosphere, especially of small active regions with the total unsigned magnetic flux of Mx. The detected enhanced upflow region that appears before the magnetic flux emergence has a negative Doppler velocity of up to 1600 m s-1, an area of 5 km2 (or 8 Mm in diameter), and continues for 1 – 2 hr. Such a flow structure is easily distinguished from the regular granules and supergranules in the quiet Sun. For example, the observed upflow velocity (1600 m s-1) is much faster than the typical upflow velocity of supergranules (300 m s-1), while the size scale of the enhanced upflow (8 Mm) is much larger than that of the granules (0.5 – 2 Mm): parameters of granules and supergranules are taken from Rieutord & Rincon (2010). Also, the lifetime of the velocity structure with enhanced upflows (1 – 2 hr) is not relevant to those of the regular quiet-Sun granules (10 minutes) and supergranules (1 – 2 days). Moreover, the observed upflows may not be the large granular convection cells, expanded due to the emerging magnetic flux, since such cells may appear over the whole period of the magnetic flux emergence, while the presented upflows are seen only at the initial stage of active region development.
One of the most interesting results from the observation is that active regions of different sizes (more than one order of the magnetic flux magnitude) show similar parameters for the enhanced upflow such as maximum velocity, area, and lifetime (see Section 3.3). This may point to the possibility that although the large-scale structures of the active regions are different, the elementary magnetic flux tubes that comprise the entire emerging flux have similar physical parameters for various events (tube size, magnetic field strength, rise velocity, etc.). Perhaps the branching of the original subsurface flux system into elementary tubes is due to local convection, and thus the elementary tubes have similar properties regardless of the size of active regions.
It has been widely considered that magnetic buoyancy is the probable driver of the rising magnetic flux in the solar interior (Parker 1955 and others). Recently Khlystova (2013b) found from the statistical analysis that the magnetic flux growth rate is proportional to the square of the magnetic field strength on the initial stage of the active region appearance. Since the magnetic buoyancy has a quadratic dependence on the magnetic field strength, this result shows that the magnetic buoyancy has an important role in the magnetic flux emergence on the solar surface. Also, the numerical simulations show influence of the convective flows on the magnetic flux emergence inside the convective zone (Fan et al., 2003; Weber et al., 2011, 2013; Jouve et al., 2013) and near the solar surface (Cheung et al., 2007, 2008; Martínez-Sykora et al., 2008; Yelles Chaouche et al., 2009; Tortosa-Andreu & Moreno-Insertis, 2009; Fang et al., 2010; Stein et al., 2011; Bushby & Archontis, 2012). Radiative MHD simulations of the formation of active regions by Cheung et al. (2010) and Rempel & Cheung (2014) demonstrate the formation of undulated structure of field lines through the interaction of the emerging magnetic flux with the small-scale granular convection. Simulations by Fang et al. (2012) and Stein & Nordlund (2012) show that the large-scale convective motions concentrate magnetic fields and play an essential role in the formation of pores and sunspots. Therefore, it is possible that the enhanced upflow structures in emerging magnetic flux regions detected in this paper are coupled with large-scale convective motions. Still, the upflow patterns seen at the photosphere are to a large extent different from those of regular granules and supergranules.
6 Conclusions
We found a strong plasma upflow during the emergence of two small active regions NOAA 9021 and NOAA 10768 in the solar photosphere. The values of maximum negative Doppler velocity reach 1650 m s-1 and 1320 m s-1, respectively. The enhanced upflow regions have sizes of 5.7 km2 and 4.7 km2, which correspond to 8 Mm in diameter. The increase of the plasma upflow velocity begins 27 minutes before the appearance of the magnetic flux in the photosphere. The lifetime of enhanced upflow is 2 and 1 hr. The observed flows are similar to that which appeared during the emergence of the large active region NOAA 10488 (Grigor’ev et al., 2007).
We used numerical simulations by Toriumi et al. (2011) to investigate the causes of the observed plasma flows. The change of plasma upflow velocity during the magnetic flux emergence at the solar surface can be explain by the action of two forces – namely, the gas pressure gradient and the magnetic pressure gradient. The increase in the plasma upflow velocity before the emerging magnetic flux occurs due to an increase of the gas pressure gradient. When the magnetic flux penetrates into the solar photosphere, the plasma upflow velocity continues to enhance due to an increase of the magnetic pressure gradient. After the decrease in the magnetic pressure gradient due to the expansion of the emerging magnetic flux into the solar atmosphere, the upflow velocity on the surface began to decrease.
The similar parameters of enhanced upflows at the appearance of small and large active regions may point to the possibility that the elementary magnetic flux tubes at the very beginning of emergence have similar initial properties, irrespective of scales of active regions. It is possible that there is an additional contribution of the convective upflows to rising of the magnetic fluxes to the solar surface.
References
- Barnes et al. (2014) Barnes, G., Birch, A. C., Leka, K. D., & Braun, D. C. 2014, ApJ, 786, 19
- Birch et al. (2013) Birch, A. C., Braun, D. C., Leka, K. D., Barnes, G., & Javornik, B. 2013, ApJ, 762, 131
- Birch et al. (2016) Birch, A. C., Schunker, H., Braun, D. C., et al. 2016, Science Advances, 2, e1600557
- Braun (1995) Braun, D. C. 1995, in Astronomical Society of the Pacific Conference Series, Vol. 76, GONG 1994. Helio- and Astro-Seismology from the Earth and Space, ed. R. K. Ulrich, E. J. Rhodes, Jr., & W. Dappen, 250
- Bushby & Archontis (2012) Bushby, P. J., & Archontis, V. 2012, A&A, 545, A107
- Cheung & Isobe (2014) Cheung, M. C. M., & Isobe, H. 2014, Living Reviews in Solar Physics, 11, 3
- Cheung et al. (2010) Cheung, M. C. M., Rempel, M., Title, A. M., & Schüssler, M. 2010, ApJ, 720, 233
- Cheung et al. (2007) Cheung, M. C. M., Schüssler, M., & Moreno-Insertis, F. 2007, A&A, 467, 703
- Cheung et al. (2008) Cheung, M. C. M., Schüssler, M., Tarbell, T. D., & Title, A. M. 2008, ApJ, 687, 1373
- Fan (2009) Fan, Y. 2009, Living Reviews in Solar Physics, 6, 4
- Fan et al. (2003) Fan, Y., Abbett, W. P., & Fisher, G. H. 2003, ApJ, 582, 1206
- Fang et al. (2010) Fang, F., Manchester, W., Abbett, W. P., & van der Holst, B. 2010, ApJ, 714, 1649
- Fang et al. (2012) Fang, F., Manchester, IV, W., Abbett, W. P., & van der Holst, B. 2012, ApJ, 745, 37
- Garcia de La Rosa (1984) Garcia de La Rosa, J. I. 1984, Sol. Phys., 92, 161
- Grigor’ev et al. (2007) Grigor’ev, V. M., Ermakova, L. V., & Khlystova, A. I. 2007, Astronomy Letters, 33, 766
- Grigor’ev et al. (2009) —. 2009, Astronomy Reports, 53, 869
- Hale et al. (1919) Hale, G. E., Ellerman, F., Nicholson, S. B., & Joy, A. H. 1919, ApJ, 49, 153
- Hartlep et al. (2011) Hartlep, T., Kosovichev, A. G., Zhao, J., & Mansour, N. N. 2011, Sol. Phys., 268, 321
- Howe et al. (2011) Howe, R., Jain, K., Hill, F., et al. 2011, Journal of Physics Conference Series, 271, 012060
- Ilonidis et al. (2013) Ilonidis, S., Zhao, J., & Hartlep, T. 2013, ApJ, 777, 138
- Ilonidis et al. (2011) Ilonidis, S., Zhao, J., & Kosovichev, A. 2011, Science, 333, 993
- Jouve et al. (2013) Jouve, L., Brun, A. S., & Aulanier, G. 2013, ApJ, 762, 4
- Khlystova (2011) Khlystova, A. 2011, A&A, 528, A7
- Khlystova (2013a) —. 2013a, Sol. Phys., 284, 343
- Khlystova (2013b) —. 2013b, Sol. Phys., 284, 329
- Kholikov (2013) Kholikov, S. 2013, Sol. Phys., 287, 229
- Komm et al. (2008) Komm, R., Morita, S., Howe, R., & Hill, F. 2008, ApJ, 672, 1254
- Kosovichev et al. (2000) Kosovichev, A. G., Duvall, Jr., T. L., & Scherrer, P. H. 2000, Sol. Phys., 192, 159
- Kosovichev et al. (2016) Kosovichev, A. G., Zhao, J., & Ilonidis, S. 2016, ArXiv e-prints, arXiv:1607.04987
- Martínez-Sykora et al. (2008) Martínez-Sykora, J., Hansteen, V., & Carlsson, M. 2008, ApJ, 679, 871
- Parker (1955) Parker, E. N. 1955, ApJ, 121, 491
- Rempel & Cheung (2014) Rempel, M., & Cheung, M. C. M. 2014, ApJ, 785, 90
- Rieutord & Rincon (2010) Rieutord, M., & Rincon, F. 2010, Living Reviews in Solar Physics, 7, 2
- Scherrer et al. (1995) Scherrer, P. H., Bogart, R. S., Bush, R. I., et al. 1995, Sol. Phys., 162, 129
- Singh et al. (2016) Singh, N. K., Raichur, H., & Brandenburg, A. 2016, ApJ, 832, 120
- Snodgrass (1983) Snodgrass, H. B. 1983, ApJ, 270, 288
- Stein et al. (2011) Stein, R. F., Lagerfjärd, A., Nordlund, Å., & Georgobiani, D. 2011, Sol. Phys., 268, 271
- Stein & Nordlund (2012) Stein, R. F., & Nordlund, Å. 2012, ApJ, 753, L13
- Toriumi et al. (2012) Toriumi, S., Hayashi, K., & Yokoyama, T. 2012, ApJ, 751, 154
- Toriumi et al. (2014) —. 2014, ApJ, 794, 19
- Toriumi et al. (2013) Toriumi, S., Ilonidis, S., Sekii, T., & Yokoyama, T. 2013, ApJ, 770, L11
- Toriumi et al. (2011) Toriumi, S., Miyagoshi, T., Yokoyama, T., Isobe, H., & Shibata, K. 2011, PASJ, 63, 407
- Toriumi & Yokoyama (2013) Toriumi, S., & Yokoyama, T. 2013, A&A, 553, A55
- Tortosa-Andreu & Moreno-Insertis (2009) Tortosa-Andreu, A., & Moreno-Insertis, F. 2009, A&A, 507, 949
- Weber et al. (2011) Weber, M. A., Fan, Y., & Miesch, M. S. 2011, ApJ, 741, 11
- Weber et al. (2013) —. 2013, Sol. Phys., 287, 239
- Yelles Chaouche et al. (2009) Yelles Chaouche, L., Cheung, M. C. M., Solanki, S. K., Schüssler, M., & Lagg, A. 2009, A&A, 507, L53
- Zharkov & Thompson (2008) Zharkov, S., & Thompson, M. J. 2008, Sol. Phys., 251, 369
- Zwaan (1987) Zwaan, C. 1987, Annual review of astronomy and astrophysics, 25, 83