SPIDERS: Selection of spectroscopic targets using AGN candidates detected in all-sky X-ray surveys
Abstract
SPIDERS (SPectroscopic IDentification of eROSITA Sources) is an SDSS-IV survey running in parallel to the eBOSS cosmology project. SPIDERS will obtain optical spectroscopy for large numbers of X-ray-selected AGN and galaxy cluster members detected in wide area eROSITA, XMM-Newton and ROSAT surveys. We describe the methods used to choose spectroscopic targets for two sub-programmes of SPIDERS targets: X-ray selected AGN candidates detected in the ROSAT All Sky and the XMM-Newton Slew surveys. We have exploited a Bayesian cross-matching algorithm, guided by priors based on mid-IR colour-magnitude information from the WISE survey, to select the most probable optical counterpart to each X-ray detection. We empirically demonstrate the high fidelity of our counterpart selection method using a reference sample of bright well-localised X-ray sources collated from XMM-Newton, Chandra and Swift-XRT serendipitous catalogues, and also by examining blank-sky locations. We describe the down-selection steps which resulted in the final set of SPIDERS-AGN targets put forward for spectroscopy within the eBOSS/TDSS/SPIDERS survey, and present catalogues of these targets. We also present catalogues of 12 000 ROSAT and 1500 XMM-Newton Slew survey sources which have existing optical spectroscopy from SDSS-DR12, including the results of our visual inspections. On completion of the SPIDERS program, we expect to have collected homogeneous spectroscopic redshift information over a footprint of 7500 deg2 for 85 percent of the ROSAT and XMM-Newton Slew survey sources having optical counterparts in the magnitude range 1722.5, producing a large and highly complete sample of bright X-ray-selected AGN suitable for statistical studies of AGN evolution and clustering.
keywords:
surveys – galaxies: active – galaxies: Seyfert – quasars: general – cosmology: observations – X-rays: galaxies1 Introduction
X-ray emission is a signpost of accretion of matter onto the super-massive black holes that seed the whole population of massive galaxies and may strongly influence their formation and subsequent evolution. X-ray selected samples of active galactic nuclei (AGN) are particularly powerful because, compared to UV/optical/mid-IR selection methods, X-ray selection is much less susceptible to (but not completely immune from) the deleterious effects of obscuration by intervening material and the dilution of AGN light by the host galaxy (e.g. see the recent review by Brandt & Hasinger, 2005, and references therein).
Samples of X-ray selected AGN have been relatively small compared to the purely optically selected AGN available from large area optical surveys such as the Sloan Digital Sky Survey (SDSS; York et al., 2000). Although there are many X-ray survey fields currently under active study, the spectroscopic completeness is typically low, or the survey extents are typically small (Brandt & Hasinger, 2005). As a result, even amongst the most intensively studied fields, the number of X-ray AGN with spectroscopic identifications does not exceed a few thousand sources per field, as for example, in the XBoötes/AGES survey (Kochanek et al., 2012), and in the Baryon Oscillation Spectroscopic Survey (BOSS) ancillary project within the Northern XMM-XXL field (Menzel et al., 2016). It is therefore not surprising that our understanding of black hole growth across cosmic time lags significantly behind investigations of galaxy evolution. Indeed, the physical conditions under which AGN are fuelled likely depend on a number of parameters, such as host galaxy stellar mass or position within the cosmic web. Disentangling the relative significance of those factors requires large samples to account for the potentially large intrinsic scatter of relations and co-variances between parameters of interest.
Efforts to obtain complete redshift information for all-sky X-ray samples, the exemplar being the Röntgen Satellite All-Sky Survey, (RASS; Voges et al., 1999, 2000; Boller et al., 2016), have been hampered by the typically rather poor positional accuracy of the X-ray detections. For example, the mean and 95th percentile of the 1 error radii are 20 arcsec and 35 arcsec respectively for sources in the RASS catalogue. Historically, this has made selection of the correct optical counterparts difficult because, even at the relatively shallow depths of currently available wide area imaging (e.g. the 22.5 mag limit reached by SDSS imaging; Aihara et al. 2011), there are already many possible optical counterparts found within the error circle of each all-sky X-ray source. Despite these difficulties, several groups have reported the results of cross-matching the RASS catalogues to counterparts found in wide-area optical and near-IR surveys (e.g. Véron-Cetty et al., 2004; Mickaelian et al., 2006; Parejko et al., 2008; Haakonsen & Rutledge, 2009; Greiner & Richter, 2015). However, these studies have often relied on some degree of human interaction in the cross-matching process, or have been limited to only the bright end of the population, both of which are undesirable features when compiling well-understood and complete samples.
Even where the cross-matching hurdle has been overcome, the follow up of tens of thousands of X-ray sources with single object spectrographs requires a prohibitively large telescope time allocation. The largest RASS follow-up programs to date have, by necessity, focused on the optically bright part of the X-ray source population, and have been carried out as a small component of of large scale galaxy redshift surveys exploiting wide-field highly-multiplexed fiber-fed spectrographs. For example, Anderson et al. (2007, hereafter A07) report spectroscopically identified counterparts for 7000 RASS sources covering 5740 deg2 (i.e. the spectroscopic footprint of the SDSS 7th Data Release, DR7, Abazajian et al. 2009). Their sample comprises 6224 broad line AGN (BLAGN), 515 emission line galaxies (ELGs) and 266 BL Lacs, based on visual inspection of the spectra. Another large sample was presented by Mahony et al. (2010), who report reliable spectroscopic identifications for 1715 RASS bright catalogue sources covering 17 046 deg2 obtained as part of the 6-degree-Field Galaxy Survey (6dFGS; Jones et al., 2004, 2009). The RASS-6dFGS sample has a 90 percent redshift success rate at bj=17.5 (Vega) but has a rapidly declining success rate towards fainter fluxes, and so is dominated by optically bright objects. Unfortunately, these existing large spectroscopic samples are still incomplete, since a large fraction of the X-ray detections still lack a spectroscopically measured counterpart, and inhomogeneous, since a variety of criteria or supporting data have been used to select the counterparts to X-ray sources and to determine which of those counterparts receive spectroscopic follow up.
SPIDERS (SPectroscopic IDentification of eROSITA Sources) is an observational programme within the SDSS-IV project (Blanton et al., 2017) which seeks to improve upon the aforementioned situation. SPIDERS will run for up to 6 years (2014–2020) alongside the Extended Baryon Oscillation Spectroscopic Survey (eBOSS; Dawson et al., 2016) and Time Domain Spectroscopic Survey (TDSS; Morganson et al., 2015) projects. The primary goal of SPIDERS is to obtain extensive, homogeneous and complete spectroscopic follow-up of extragalactic X-ray sources, both point-like and extended, using data from X-ray satellites and over the SDSS extragalactic imaging footprint. SPIDERS naturally splits into two main components; an AGN programme and a galaxy clusters programme (the latter is described by Clerc et al., 2016). The SPIDERS-AGN programme has been designed to collect 40 000 spectra of X-ray AGN, and to bring population studies of accreting super-massive black holes to a new level of accuracy. First demonstrations of the SPIDERS science applications, based on the BOSS follow-up of X-ray selected AGN in the Northern XMM-XXL field, were presented by Menzel et al. (2016); Liu et al. (2016). SPIDERS will target X-ray sources detected by the forthcoming all-sky X-ray survey to be carried out by eROSITA (extended ROentgen Survey with an Imaging Telescope Array; Merloni et al. 2012; Predehl et al. 2016). However, we have started the SPIDERS project in advance of the eROSITA launch (scheduled for 2018). We present in this paper the first phase of the SPIDERS-AGN programme (a.k.a. ‘Tier-0’) which exploits existing (pre-eROSITA) all-sky X-ray source catalogues to explore the bright end of the X-ray AGN population.
An initial goal of the SPIDERS project is to obtain highly complete and reliable identifications for the optical counterparts to all RASS sources (from both the bright and faint catalogues; Voges et al., 1999, 2000), that fall within the eBOSS survey footprint and that have possible counterparts with magnitudes within the accessible range (). In addition, SPIDERS will obtain redshifts for sources detected in the XMM-Newton Slew Survey (XMMSL; Saxton et al., 2008), which covers a very wide sky area (around 2/3 of the full sky). The XMMSL is a factor of a few shallower than the RASS but has the advantage of being sensitive over a broader and harder energy range (0.2–12 versus 0.1–2.4 keV).
As we discuss in detail later, the mid-IR, specifically the all-sky survey performed by the Wide-field Infrared Survey Explorer (WISE; Wright et al., 2010), is the vital stepping-stone that allows us to correctly select optical counterparts to the bright X-ray selected AGN in the RASS and XMMSL surveys. Studies made using the Infrared Astronomical Satellite (IRAS; Neugebauer et al., 1984), Spitzer (Werner et al., 2004) and WISE observatories have shown that AGN activity is almost always associated with mid-IR emission (e.g. Elvis et al., 1994; Stern et al., 2005, 2012; Assef et al., 2013). Indeed, the spectral energy distribution of X-ray selected AGN is characterised by a tight correlation between near-IR and X-ray flux, (e.g. Mainieri et al., 2002; Brusa et al., 2005; Civano et al., 2012; Marchesi et al., 2016), particularly when high-spatial resolution mid-IR and hard-X-ray measurements are available (Gandhi et al., 2009; Asmus et al., 2014). The tendency of luminous AGN to stand out from other astronomical populations in the mid-IR has been extensively exploited to separate them from the field galaxy population (e.g. Lacy et al., 2004; Stern et al., 2005; Hickox et al., 2007; Donley et al., 2012; Assef et al., 2013; Mateos et al., 2013). In this work we show how the combination of WISE imaging data and a Bayesian cross-matching algorithm (full details of which will be presented by Salvato et al., in prep.), can be used effectively to overcome most of the issues listed above, which have so far hampered the realization of highly complete follow-up programs for the RASS and XMMSL surveys.
The paper is laid out as follows. In section 2 we describe the data sets used in this study. In section 3 we describe the details of the cross-matching process, the selection of targets for spectroscopy within SPIDERS, and the process by which we have visually inspected SDSS-DR12 spectra associated with our X-ray samples. In section 4 we present several independent tests of the fidelity of our cross-matching and target selection schemes. In section 5, we discuss the properties of the 13 000 RASS and XMMSL sources with existing SDSS-DR12 spectral identifications. In section 6 we compare our sample to that of A07 and describe our expectations for the completed SPIDERS-AGN program.
Throughout this paper we express magnitudes in their native systems: AB magnitudes for SDSS (Fukugita et al., 1996), and Vega magnitudes for WISE (Assef et al., 2013). In order to allow direct comparison with existing works from the X-ray survey literature, we adopt a flat CDM cosmology with /[100 km s-1 Mpc-1]=0.7; =0.3; =0.7, broadly consistent with the most recent Wilkinson Microwave Anisotropy Probe and Planck determinations (e.g. Hinshaw et al., 2013; Planck Collaboration et al., 2016). The data products released in this work can be obtained from the MPE X-ray surveys website (http://www.mpe.mpg.de/XraySurveys).
2 Preparation of input data sets
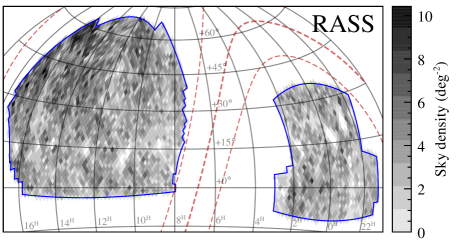
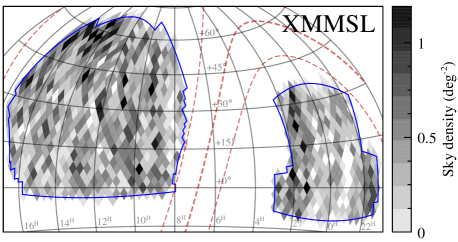
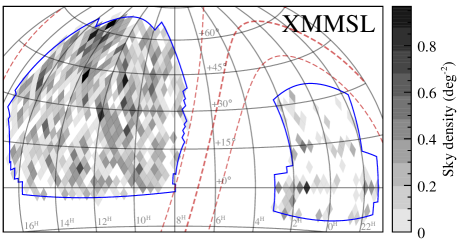
In this section we detail the steps taken to collate and prepare the input data sets that have been used to produce the final lists of SPIDERS targets. In all cases we have only considered targets that lie within the area defined by the 10 778 deg2 of the SDSS-BOSS imaging footprint111http://www.sdss3.org/dr9/algorithms/boss_tiling.php. This footprint is a superset of the area that will be considered for the eBOSS observations. The BOSS imaging footprint consists of two large contiguous regions; 70 percent of the total area is in the North Galactic Cap (NGC), and the remainder is in the South Galactic Cap (SGC), see e.g. Fig. 1. It is expected that, after six years of operations, eBOSS will have observed approximately 7500 deg2 within this footprint. The spatial filtering was carried out using the polyid tool from the mangle222http://space.mit.edu/~molly/mangle/ software suite (Hamilton, 1993; Hamilton & Tegmark, 2004; Swanson et al., 2008).
2.1 ROSAT All Sky Survey catalogue (RASS)
The Röntgen Satellite (ROSAT; Trümper, 1982) was used to carry out a 6-month-long scanning sky survey (RASS) in 1990–91, covering around 99.7 percent of the entire sky. Despite the many advanced X-ray observatories that have been launched since ROSAT, none has had a larger survey ‘grasp’ (used here to mean the product of telescope collecting area and field-of-view) in the soft X-rays, and so the RASS remains the most sensitive all-sky survey in the soft X-ray band (0.1–2.4 keV).
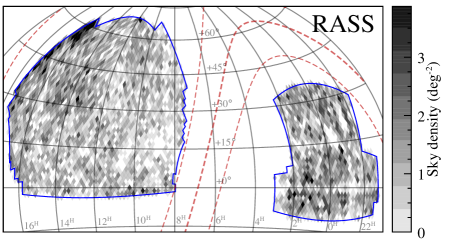
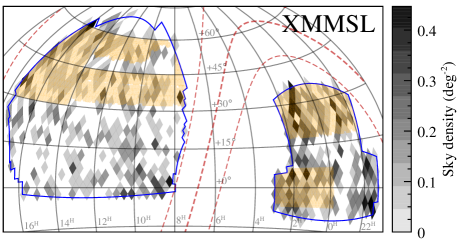
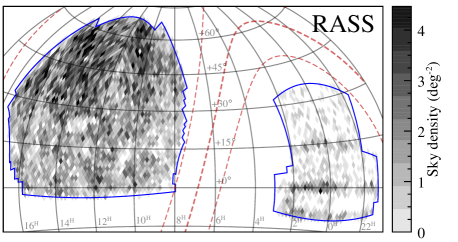
Two first-generation RASS source catalogues were produced, the Bright Source Catalogue (BSC; Voges et al., 1999), containing 18 806 X-ray sources (detected with ct s-1, at least 15 X-ray counts and a minimum detection likelihood of 15), and the Faint Source Catalogue (FSC; Voges et al., 2000) which contains 105 924 sources (detected with at least 6 X-ray counts and a minimum detection likelihood of 6.5). We constructed a parent sample of 32 408 X-ray sources from the concatenation of all RASS-BSC and RASS-FSC sources located within the BOSS imaging footprint. A small number (17) of RASS detections with undefined positional errors (likely to be detection algorithm artefacts) were then removed, leaving 32 391 sources. The median positional uncertainty (1 radius, including a 6 arcsec systematic error) of the remaining RASS sources is 17 arcsec, and 95 percent have uncertainties smaller than 34 arcsec. No attempt was made at this stage to filter the RASS catalogue any further, for example, by detection likelihood. We discuss the frequency and impact of spurious X-ray detections later in section 4.3. The sky distribution of the RASS sample is shown in Fig. 1. The mean sky density of sources is 3.0 deg-2, but their distribution is far from uniform, due primarily to the uneven sensitivity limit of the ROSAT all-sky survey.
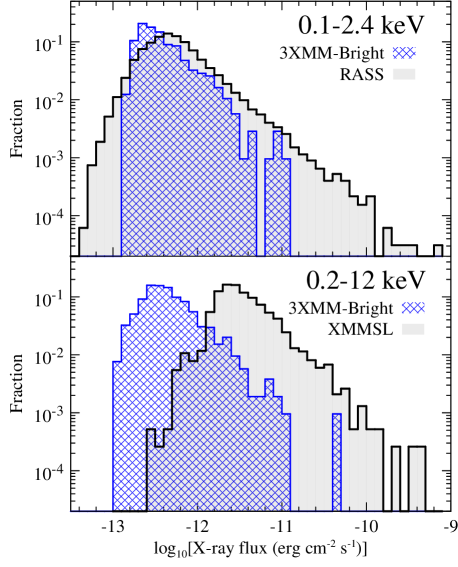
We describe in Appendix A.1 our method to estimate unabsorbed X-ray fluxes from the RASS count rates (i.e. correcting for the photoelectric absorption due to the Galactic column density in the direction of the source). The unabsorbed 0.1–2.4 keV flux distribution of the RASS sources is presented in Fig. 2. The distribution is strongly peaked with a median of erg cm-2 s-1, and with 86 percent of the sources lying within 0.5 dex of this value.
We note that Boller et al. (2016) have recently presented the second revision of the ROSAT X-ray Survey catalogue (2RXS), using additional ROSAT survey data, improved source detection algorithms, and improved source characterisations. Unfortunately the 2RXS catalogue was released after SPIDERS-AGN targets had been submitted for observation, and so we do not consider it further here. An associated work by several of us (Salvato et al., in prep.) will present WISE associations for 2RXS and XMMSL sources covering the entire extragalactic sky, using similar cross-matching techniques to those presented here.
2.2 XMM-Newton Slew survey catalogue (XMMSL)
As part of the normal operations of XMM-Newton, data are accumulated by the European Photon Imaging Camera pn detector during slews between pointed observations (Saxton et al., 2008). As of early 2014, the XMM-Newton slew observations have covered 65 percent of the sky at least once333http://www.cosmos.esa.int/web/xmm-newton/xsa#download. The XMMSL catalogue is built from sources detected in at least one of the following energy bands: soft (0.2–2 keV), hard (2–12 keV) and full (0.2–12 keV).
Our starting point is the ‘Clean’ version of the XMMSL catalogue release 1.6 (2014 Feb. 26)444http://nxsa.esac.esa.int/catalogues/xmmsl1D_clean.fits.gz, from which we select the 4325 X-ray detections which fall inside the BOSS imaging footprint. However, some of the catalogue entries are multiple detections of the same X-ray source, whereas we require a list of unique sources. Therefore, where groups of XMMSL detections have the same UNIQUE_SRCNAME we choose only the best spatially constrained (i.e. having the smallest value of RADEC_ERR). Additionally, we choose only the best spatially constrained detection from any pairs of sources that lie within a 30 arcsec radius circle. These filtering steps leave a catalogue of 3843 unique XMMSL sources555We note here that an earlier version of our sample selection algorithm accidentally excluded all XMMSL sources with multiple X-ray detections. This affects 10 percent of the XMMSL sources lying in the first 4010 deg2 of eBOSS plates (i.e. the tiling ‘chunks’ named eboss1, 2, 3, 4, 5, 9 and 16). We corrected the target selection error before submitting SPIDERS targets for the remainder of the eBOSS sky. In the following sections, unless otherwise noted, all quoted statistics refer to the correctly filtered XMMSL catalogue. We indicate in the supplied catalogues (see Appendix E) which XMMSL sources were affected by this error.. The sky distribution of the XMMSL sample is shown in Fig. 1. The rate of spurious X-ray detections in the ‘Clean’ version of the XMMSL catalogue is estimated to be 4 percent in the full energy band666http://www.cosmos.esa.int/web/xmm-newton/xmmsl1d-ug. The median statistical positional uncertainty (1 radius, excluding systematic errors) of the unique XMMSL sources is 4.0 arcsec, and 95 percent have statistical uncertainties smaller than 15.4 arcsec.
The XMMSL catalogue includes flux estimates for each source, calculated from the observed count rates using a simple linear energy conversion factor which assumes a powerlaw spectrum absorbed by a fixed Galactic column density of cm-2. The ratio of unabsorbed to absorbed flux over the 0.2–12 keV band for this particular spectral model is 1.10 (calculated using WebPIMMS777http://heasarc.gsfc.nasa.gov/cgi-bin/Tools/w3pimms/w3pimms.pl), and we have therefore multiplied the catalogue fluxes by this factor to correct for Galactic absorption. Given the large statistical uncertainties on the fluxes of the XMMSL sources, and the relatively weak sensitivity of the XMM-Newton bandpass to moderate levels of Galactic absorption, we have applied a global correction to the XMMSL catalogue fluxes rather than attempting to correct for the Galactic column density local to each source. The unabsorbed 0.2–12 keV flux distribution of the XMMSL sources is presented in Fig. 2. The distribution is strongly peaked with a median of erg cm-2 s-1, and with 89 percent of the sources lying within 0.5 dex of this value.
We note that 1934/3843 (50 percent) of the XMMSL sources have at least one RASS detection within 60 arcsec, and so the two X-ray samples used in our work are far from independent. However, since the XMMSL and RASS samples have very different characteristics and were selected in very different ways (telescopes, energy ranges, detection routines etc.) it is most convenient to treat these two samples separately.
2.3 AllWISE candidate counterpart catalogue
The WISE mission (Wright et al., 2010) carried out an all-sky survey in the 3.4, 4.6, 12 and 22 m bands (we denote magnitudes measured in these bands as , , and respectively). The ‘AllWISE’ catalogue was released in late 2013 (Cutri, 2013), and incorporates all data obtained by WISE in its original mission phase, including a second season of observations in the two shorter wavelength bands. The survey scan pattern results in inhomogeneous coverage, (deeper at the Ecliptic poles than at the Ecliptic Equator). Throughout this work we only use the w[1234]mpro magnitude estimates from the AllWISE catalogue, which are appropriate for point-like sources. For 95 percent of the extragalactic sky ( deg), the 5 point-source magnitude limits in the , , and bands are at least as deep as 17.6, 16.1, 11.5 and 7.9 mag (Vega) respectively. We note that, for every source detected above 5 in at least one band, the AllWISE catalogue contains a measurement of brightness in all four WISE photometric bands, even where such measurements fall well below the nominal detection limits. At the faint limit of the AllWISE catalogue, the vast majority of sources have their highest SNR detection in the shortest wavelength WISE band.
We have restricted our search for AllWISE counterparts to within a 60 arcsec radius of the X-ray position of each member of the RASS sample described in section 2.1. No down-selection is carried out on this AllWISE sample apart from removing the few duplicate entries which fall inside the search radii around two or more adjacent RASS sources. This procedure results in a catalogue of 450 409 unique potential AllWISE counterparts (a mean of 13.9 potential counterparts per RASS source).
An identical procedure was carried out to build a list of potential AllWISE counterparts to the XMMSL sample described in section 2.2, resulting in a catalogue of 46 389 unique potential AllWISE counterparts (a mean of 13.4 potential counterparts per XMMSL source). Note that although the positions of XMMSL catalogue sources are typically much better determined than those of the RASS sources, a small fraction do have large (30 arcsec) positional uncertainties. We have therefore used a relatively large search radius of 60 arcsec when compiling this initial list of potential AllWISE counterparts.
2.4 SDSS photometric counterpart catalogue
As part of the first three phases of the Sloan Digital Sky Survey (SDSS), a wide-area multi-band () imaging survey was carried out using the 2.5-metre telescope at the Apache Point Observatory, New Mexico (Gunn et al., 2006; Aihara et al., 2011). The most recent photometric catalogue derived from these imaging data was released as part of SDSS-DR13 (SDSS Collaboration et al., 2016). The nominal 95 percent completeness limits of the SDSS imaging are 22.0, 22.2, 22.2, 21.3 and 20.5 mag in the bands, respectively888http://www.sdss.org/dr13/scope. Starting with the SDSS-DR13 catalogue (specifically we considered primary objects from the ‘Datasweep’ files999http://www.sdss.org/dr13/imaging/catalogs/), we down-selected a sample of potential optical counterparts to X-ray sources by searching within 65 arcsec of the X-ray positions of all members of the RASS and XMMSL samples described in sections 2.1 and 2.2. The mean sky density of SDSS photometric objects lying near the X-ray sources in our sample is deg-2. Note that we adopt a slightly larger search radius here compared to that used to select potential AllWISE counterparts. This is in order to prevent the effects of astrometric uncertainties scattering potential SDSS counterparts to AllWISE sources outside our considered search area.
2.5 SDSS spectroscopic counterpart catalogue
Since its first light in 1998, and up to its 12th data release (DR12), the SDSS project has obtained over five million astronomical spectra, with various spectrographs and within a number of different survey programs (Alam et al., 2015).
For practical reasons we have used two versions of the spectroscopic catalogues associated with SDSS-DR12: i) an early prototype version of the DR12 spectroscopic catalogue, and ii) the full official DR12 spectroscopic catalogue. At the time when we created the SPIDERS target catalogues (March–April 2014), the final version of the BOSS spectroscopic catalogue was not yet completely finalised (and did not include the spectra collected as part of SEQUELS, a few BOSS main-survey plates, and several plates associated with ancillary programmes). However, the combination of a pre-release version of the BOSS spectroscopic catalogue, joined with the official SDSS-DR8 spectroscopic catalogue included more than 95% of the spectra that would go on to form the final official DR12 spectroscopic catalogue. To form a ‘proto-DR12’ catalogue, we first filtered the DR8 and pre-release BOSS catalogues to include only spectra with SPECPRIMARY=1 (i.e. for each object with multiple spectroscopic observations we only considered the best quality one, see Alam et al. 2015 for a description of how this choice is made), and have ZWARNING=0 (i.e. we discarded spectra for which the BOSS analysis pipeline identified potential issues, including those spectra for which the fitting routine could not determine a reliable redshift). The combination of the filtered DR8 and pre-release BOSS catalogues (containing 1 674 844 and 1 857 100 sources respectively) were considered when we decided which potential SPIDERS targets already had good-quality SDSS spectra available (and hence should be excluded from the list of potential targets in SDSS-IV). Use of this incomplete reference catalogue for target selection is acceptable, as its only impact is a slight decrease in observing efficiency, due to a small fraction (estimated to be less than 1 percent) of SPIDERS AGN targets with existing BOSS spectra being re-observed during the eBOSS/TDSS/SPIDERS project.
However, as part of this paper we also release samples of RASS and XMMSL sources with existing SDSS spectra. Therefore, for the sake of clarity and repeatability, and to allow reference to fully documented data products, we prefer in these cases to base our samples on the officially released SDSS-DR12 spectroscopic sample, which contains all spectra collected by the SDSS and BOSS optical spectrographs (Smee et al., 2013) in the MJD range [51578:56837]101010http://data.sdss3.org/sas/dr12/sdss/spectro/redux/specObj-dr12.fits. In cases where multiple SDSS-DR12 spectra are available for a photometric object, we consider only the ‘best’ spectrum (i.e. the one flagged with SPECPRIMARY=1). Since we visually inspect all spectra matched to our X-ray source samples (see section 3.5), we have not filtered the DR12 spectra on the basis of pipeline redshift warning flags.
2.6 3XMM-Bright reference catalogue
Within the Bayesian cross-matching framework (described in section 3), the complex task of identifying reliable counterparts of RASS (and, to a lesser extent, XMMSL) sources benefits dramatically from the availability of a sub-sample of well-characterized X-ray sources at similar flux levels, with good enough positional accuracy to make the cross-matching exercise non-problematic. To this end, we have exploited the 3XMM serendipitous source catalogue (DR4)111111http://nxsa.esac.esa.int/catalogues/3XMM_DR4cat_slim_v1.0.fits.gz, which is derived from over 7427 XMM-Newton pointings performed up to December 2012, covers a total of 794 deg2, and contains 372 728 unique detections (for a description of the 3XMM program, and a more recent revision of the catalogue, see Rosen et al. 2016). The median flux of 3XMM sources in the soft (0.2–2 keV) energy band is erg cm-2 s-1, around two orders of magnitude fainter than the flux limit of the RASS. However, the 3XMM catalogue does include a significant tail of bright sources, which overlaps with the flux ranges spanned by the RASS and XMMSL samples. Therefore, we have exploited the X-ray bright end of the 3XMM catalogue to provide a reference catalogue of well understood X-ray bright sources over the BOSS imaging footprint. This (near) ‘truth’ sample is used to derive the priors that inform the Bayesian cross-matching process (section 3).
From the 3XMM parent sample we select sources which meet all of the following criteria: i) lie inside the BOSS imaging footprint, ii) have X-ray fluxes erg cm-2 s-1 in the 0.2–2 keV energy band (where is calculated as the unweighted sum over the individual flux measurements in the standard 3XMM energy bands: 0.2–0.5, 0.5–1 and 1–2 keV), iii) have a very high detection likelihood (SC_DET_ML50), iv) have low likelihood of being extended in the X-ray (SC_EXT_ML8), v) have no warning flags set (SC_SUM_FLAG=0), vi) are not associated with observations of Solar System objects, and vii) are not in XMM-Newton observations associated with poor astrometry (this final cut was applied retrospectively)121212Our first version of the 3XMM-Bright catalogue included an additional eight sources, all of which had no AllWISE counterparts within 3 arcsec. These eight sources were located close to each other within the ‘XMM-XXL North’ field and were detected within two consecutive XMM-Newton mosaic-mode observations (targets ‘XXLn074’ and ‘XXLn094’). We have visually inspected independently processed images derived from these XMM-Newton data-sets, and find no bright X-ray sources at the catalogued positions of the eight 3XMM sources (N. Clerc, private communication). Furthermore, the 3XMM POSCOROK flag was set to FALSE for 7/8 of these detections, indicating that the pipeline had been unable to correct the X-ray astrometry against external optical/IR catalogues. Therefore we removed these objects from the 3XMM-Bright sample..
These cuts result in a high quality reference sample of 1049 bright, well measured, point-like X-ray sources (which we will hereafter call the 3XMM-Bright sample). The mean and 95th percentile of the 1 error radii for the 3XMM-Bright sources are 0.6 arcsec and 1.4 arcsec respectively, making unambiguous cross-correlation with multi-wavelength catalogues relatively simple (see section 3.2 below). Fig. 2 demonstrates that the 3XMM-Bright sources have a similar range of X-ray fluxes to sources in the RASS sample, but are approximately ten times fainter than sources in the XMMSL sample131313See Appendix A.2 for details of the method used to estimate the unabsorbed fluxes of the 3XMM-Bright sample in the RASS and XMMSL energy bands (0.1–2.4 and 0.2–12 keV, respectively)..
| Catalogue name | Waveband | Number of | Mean density | Notes | Section |
| objects | (deg-2) | ||||
| RASS | 0.1–2.4 keV | 32 408 | 3.0 | ‘1RXS’. Combined BSC+FSC. | 2.1 |
| XMMSL | 0.2–12 keV | 3843 | 0.36 | Release 1.6, 2014 February 26. Unique sources. | 2.2 |
| AllWISE | 3.4–22 m | 450 600 | 60 arcsec from RASS sources | 2.3 | |
| 51 725 | 60 arcsec from XMMSL sources | ||||
| SDSS photometry | 1 081 654 | 65 arcsec from RASS sources | 2.4 | ||
| (DR13) | 126 606 | 65 arcsec from XMMSL sources | |||
| SDSS spectroscopy | 380–920 nm (SDSS) | 3 316 373 | 310 | All SDSS-I,II, most SDSS-III | 2.5 |
| (proto-DR12) | 365–1040 nm (BOSS) | SPECPRIMARY=1, ZWARNING=0 | |||
| SDSS spectroscopy | 380–920 nm (SDSS) | 3 658 581 | 340 | All SDSS-I,II,III in BOSS footprint | 2.5 |
| (official-DR12) | 365–1040 nm (BOSS) | SPECPRIMARY=1 |
3 Selecting counterparts to X-ray sources
We summarise in this section the Bayesian cross-matching method used to associate RASS and XMMSL sources with optical/IR counterparts. This method expands upon the techniques introduced by Budavári & Szalay (2008); Rots & Budavári (2011). We refer the reader to (Salvato et al., in prep.) for a full and generalised description of the Bayesian cross-matching method, a description of ‘Nway’, the Python implementation of the algorithm that we have used within this work, and a comparison to the likelihood ratio technique (Sutherland & Saunders, 1992). Given that the RASS and XMMSL surveys are far from the confusion limit, we make the simplifying assumption that each X-ray detection is dominated by a single X-ray source having up to one counterpart at longer wavelengths. We briefly reiterate below (section 3.1) those formulae that are pertinent to the case considered here, that is, where we just wish to find the best counterpart to each of a sample of X-ray sources from a catalogue of potential counterparts.
3.1 Bayesian posterior probability of associations
The posterior probability for a cross-match between an X-ray source, , and a potential counterpart , is given by,
| (1) |
where is a prior (or ‘bias’) term dependent on the location of counterpart in some parameter space (see below), is the Bayes factor for the geometric association, given by,
| (2) |
where is the angular separation (in radians), and , are the respective positional uncertainties for sources and . is a normalising factor which takes account of the mean sky density of potential counterparts (, units deg-2), and the expected fraction of X-ray sources that have a true counterpart, ,
| (3) |
The value of the prior, , at some location in N-dimensional measurement space, , is given by the ratio , where is the probability density function of true counterparts to X-ray sources, (normalised such that over the parameter range of interest), and is the probability density function of all potential counterparts, similarly normalised. In general, can be used to encode some or all of our prior knowledge of the distribution of the measurable properties of true counterparts to X-ray sources (e.g. magnitudes, colours). Setting reduces Eqn. 1 to the standard unweighted form (e.g. Rots & Budavári, 2011).
In practice we won’t know exactly (as to do so would require that we had already measured the multi-wavelength properties of the X-ray sample), but we can estimate it, , using a training sample of well measured X-ray sources which we expect to be representative of objects in our main X-ray sample. In section 3.2 we describe how we have computed the used to select counterparts to RASS and XMMSL sources.
We note that the statistic measures the probability of association of individual pairs of sources independently of the presence of other possible pairings. So, for example, although cannot tell us the probability that at least one of the possible counterparts to an X-ray source is the correct one, it can be used to choose the most probably of these counterparts. A more complete treatment of such cases is implemented within the soon to be released version of the Nway code (Salvato et al., in prep.). See also the treatment of multiple potential counterparts by Pineau et al. (2011).
3.2 Bayesian priors derived from a bright X-ray reference sample
We investigated the properties of the 3XMM-Bright sample searching for simple combinations of parameters in which the X-ray sources stand out clearly from the general field population. This is complicated by the heterogeneous nature of the bright X-ray source population. For example, Zickgraf et al. (2003) found that the optically bright end of the RASS-BSC catalogue is associated with a mix of AGN, galaxies, galaxy clusters, M stars, white dwarfs, K stars, F-G stars, and cataclysmic variables.
High luminosity AGN (i.e. QSOs) typically outshine their host galaxies in the optical–mid-IR bands, but for lower luminosity AGN (Seyferts), the host-galaxy emission may match or exceed the AGN emission. In addition, extinction along the line of sight could also mask any AGN signature in the UV/optical bands, and even into the near-IR bands as the extinction increases. However, mid-IR colours of bright AGN are less susceptible to these effects, and promise to provide a more universal tool for AGN identification.
The release of the AllWISE catalogue in November 2013 (Cutri, 2013) spurred us to examine whether mid-IR imaging information could assist in optical counterpart selection for the RASS and XMMSL sources. The vast majority of the X-ray bright AGN detected in RASS and XMMSL are expected to be bright and red in the two shortest wavelength WISE channels (i.e. 3.4 and 4.6 m). Therefore, RASS-selected AGN should stand out from field stars and galaxies in the mid-IR. In addition, counterparts to the non-AGN ‘contaminants’ in the X-ray sample (i.e. Galactic stars, and bright nearby galaxies) are also expected to stand out (they are likely to be significantly brighter in the and bands than the bulk of the AllWISE field population). Furthermore, the sky density of field sources in the AllWISE catalogue is less than half that in the SDSS imaging catalogue (see Table 1), which dramatically reduces the rate of false identification w.r.t. a purely optical-based counterpart selection scheme. The useful dynamic range of the AllWISE catalogue is somewhat larger than that of the SDSS catalogue (as expected, given that WISE was designed as a true-all sky surveyor, whereas the SDSS imager was primarily designed to target faint galaxies and QSOs). In particular, the treatment for X-ray sources associated with very bright stars is simpler with AllWISE; point sources start to saturate at mag in WISE (Cutri, 2013), but saturate at mag in SDSS imaging (Gunn et al., 1998).
We start with the 3XMM-Bright catalogue described in Section 2.6, and search for counterparts in the AllWISE catalogue, using a simple cone search. We find that 1000/1049 (95.2%) of the 3XMM-Bright sources had exactly one AllWISE counterpart within 3 arcsec of the X-ray position. We denote these 1000 matches as the ‘3XMM-Bright+AllWISE’ sample. The mean sky density of AllWISE field sources local to the 3XMM-Bright+AllWISE sources is 15 300 objects deg-2 (estimated by measuring the density of AllWISE sources within 1 arcmin radius control regions placed at a distance 6 arcmin from each X-ray source). Therefore we would naïvely expect 0.033 field sources to fall within the 3 arcsec radius circle we searched within for each 3XMM-Bright source. However, the typical AllWISE counterparts to the 3XMM-Bright sources are much brighter than typical field sources (the median magnitude of the 3XMM-Bright+AllWISE matches is 13.2 mag compared to 16.6 mag for the AllWISE field population), and so an average AllWISE field source would be overwhelmed by the average AllWISE counterpart to a 3XMM-Bright source (see also section 5 of Broos et al. 2011). We have empirically estimated the rate at which random associations are both close enough and bright enough to contaminate the 3XMM-Bright+AllWISE sample: for each 3XMM-Bright+AllWISE source we measured the probability of a field AllWISE source brighter (in ) than the true AllWISE counterpart to lie within any randomly placed 3 arcsec circle. We tested 100 randomized locations per 3XMM-Bright+AllWISE source for a total of 105 samples, and find an almost negligible overall contamination rate of just 0.12 percent. We note that using a matching radius larger than 3 arcsec would result in a higher completeness (fraction of X-ray sources with AllWISE counterparts), but would lead to more contamination from chance aligned field sources, and would also increase the number of cases where there is more than one potential AllWISE counterpart per 3XMM-Bright source (making unambiguous associations difficult). In Appendix B we discuss in more detail the nature of the 49/1049 3XMM-Bright sources which do not have AllWISE counterparts within 3 arcsec, and conclude that only 3/49 are likely to be associated with genuinely mid-IR faint sources, the remaining cases are the result of various problems with either XMM-Newton or AllWISE photometry, e.g. blending/confusion, presence of saturated bright stars, and poor astrometry at the edge of the XMM-Newton field of view. Therefore, we are confident that our reference sample is not artificially excluding a significant part of the bright X-ray population.
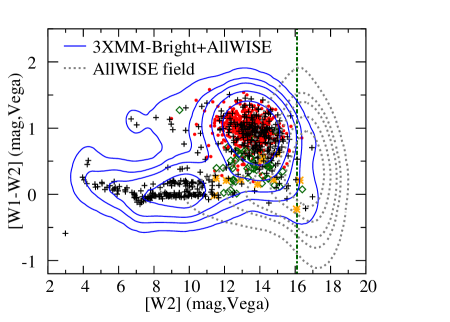
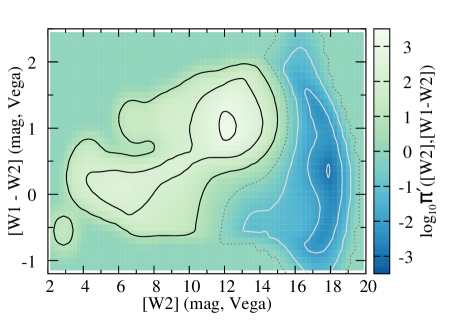
We have used the following recipe to compute a pixelized map of the prior, , in the ,- colour-magnitude space, using as input the training sample (3XMM-Bright+AllWISE sources) and a ‘field’ sample (consisting of AllWISE objects lying within 1 arcmin radius control regions placed at a distance of 6 arcmin from each of the sources in the 3XMM-Bright+AllWISE sample): i) compute 2D histograms from each of the training and field samples, covering the parameter interval 025, -5-5, with pixel steps of 0.25 mag in and 0.1 mag in -, ii) smooth each 2D histogram with a 2D Gaussian kernel having =0.5 and =0.2, iii) normalise each 2D histogram such that the sum of the pixel values over the considered range (025, -5-5) equals unity, iv) threshold each 2D histogram such that no pixel has a value smaller than one over the total number of objects in the field sample. The chosen smoothing kernel is a fair compromise between the desire to reduce the shot noise of the training sample (pushing to larger kernels), versus the desire to retain the separation between the distributions of the X-ray reference sample and of field sources (pushing to smaller kernels). The parameter interval over which we have defined the prior contains more than of the smoothed PDF for the 3XMM-Bright+AllWISE sample. The distribution of the 3XMM-Bright+AllWISE sample in AllWISE colour-magnitude space is presented in the upper panel of Fig. 3, illustrating clearly how these bright X-ray selected sources stand out from the field population in this measurement space. The ratio of the density distribution of our training (the 3XMM-Bright+AllWISE sources) and field samples constitutes our Bayesian prior -, which is also shown in the bottom panel of Fig. 3, illustrating which parts of colour-magnitude space are up- and down-weighted by the cross-matching routine.
In order to get a sense of the mix of sources that make up the 3XMM-Bright+AllWISE sample, we have cross-matched to the SDSS DR12 spectroscopic catalogue, searching within a 2 arcsec radius from the AllWISE position. Of the 557 3XMM-Bright+AllWISE sources with SDSS spectra and reliable BOSS pipeline automated classifications, 490 are classified as QSO, 56 as GALAXY (13 of which have a sub-class indicating AGN activity) and 11 as STAR. The selection function for the sub-sample of 3XMM-Bright+AllWISE sources with spectra is difficult to determine, but is certainly highly incomplete at the bright and faint ends. Therefore, we should not make quantitative predictions from these fractions. However, we can at least say with some confidence that for the range of X-ray fluxes probed by the RASS and XMMSL samples, the spectroscopic samples collected by SPIDERS will be dominated by QSOs, but with significant minorities of both normal galaxies and Galactic stars. Note that of the 3XMM-Bright+AllWISE sources with no spectral classification in SDSS DR12, many lie in the part of colour-magnitude space expected to be occupied by Galactic stars and very bright nearby galaxies (, -, see upper panel of Fig. 3).
3.3 Selection of SPIDERS_RASS_AGN targets
Armed with the priors described in the previous section, we can now proceed to the identification of the RASS sources. We start with the AllWISE catalogue described in section 2.3. All except 11/32 391 (0.03 percent) of the RASS sources in our sample have at least one potential AllWISE counterpart lying within 1 arcmin. For each RASS source, we used Nway (version 1.0) to calculate the posterior probability of it being associated with each of the possible AllWISE counterparts within 1 arcmin, taking account of the X-ray position and its uncertainty, the AllWISE position, the number density of the sources, the magnitude and the - colour. At the time of generation of the SPIDERS_RASS_AGN target catalogue we made a decision to adopt a fixed radial positional uncertainty of 0.3 arcsec (1) for all AllWISE sources. In retrospect this was an unnecessary and sub-optimal choice, and it would have been much more correct to use the positional uncertainties tabulated in the AllWISE catalogue. However, we do not expect that this has had a significant effect on our target selection given that the X-ray positional uncertainties are almost always much larger than those of AllWISE sources, and so dominate the denominators of Eqn. 2.
In an ideal world we would obtain spectra for all potential counterparts for each X-ray source above some minimum Ppost. However, the combination of the BOSS spectrograph plug-plate fiber-collision constraint (minimum fibre separation 62 arcsec), the single-pass survey strategy over the main eBOSS/TDSS/SPIDERS footprint (Dawson et al., 2016), and the limited fibre-budget allocated to the SPIDERS-AGN program, mean that we only attempt to target a single potential counterpart per RASS source. Therefore, for each RASS source, only the ‘best’ AllWISE counterpart (i.e. the one having the highest posterior probability) was considered in the following steps.
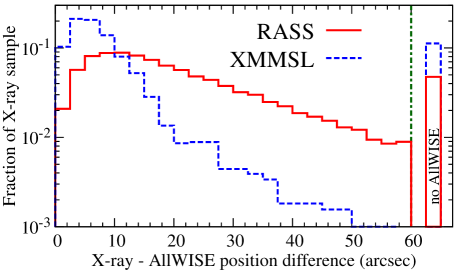
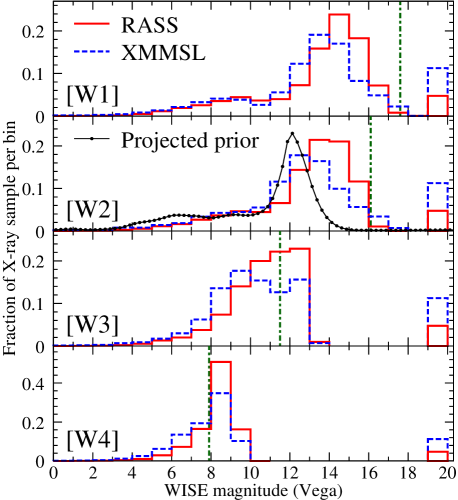
We find that for 30 855/32 391 (95.3 percent) of RASS sources we have a best matching AllWISE counterpart with posterior probability Ppost0.01 (see section 4.2 for a discussion of the Ppost threshold below which the sample becomes significantly contaminated by interlopers). RASS sources with best AllWISE counterparts having Ppost0.01 were not considered further. The best matching AllWISE counterparts have a median Ppost of 0.86 compared to 0.025 for the second best counterparts. In 82 percent of cases, the Ppost for the best match is more than twice that for the second best match indicating a very secure choice. In a small fraction of cases (4 percent), the second best match has a Ppost within 10 percent of the best match, and for such cases we cannot differentiate significantly between the best and second best AllWISE counterparts. See section 4.3 for a discussion of how the fraction of RASS sources lacking any Ppost0.01 AllWISE counterparts depends on X-ray detection likelihood. The distribution of position differences between the RASS sources and their best matching AllWISE counterparts is shown in Fig. 4. The magnitude distributions of the best matching AllWISE counterparts are shown in Fig. 5.
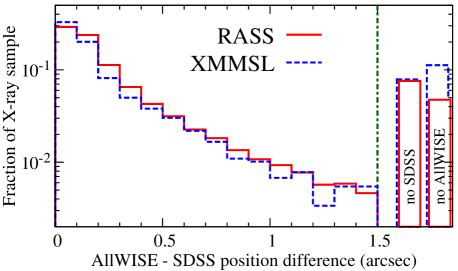
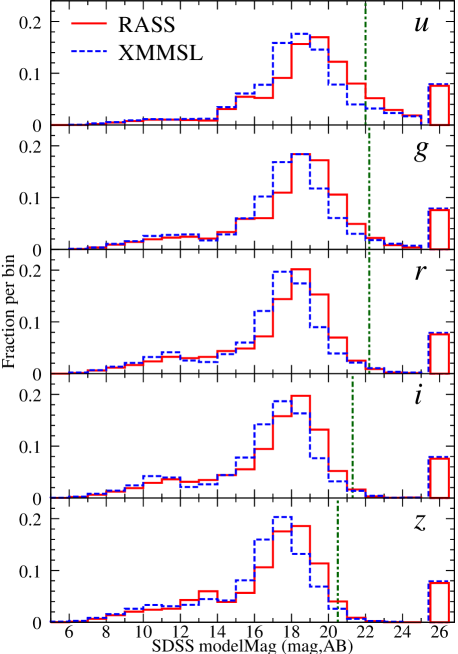
The best AllWISE counterpart for each RASS source was then matched to an optical counterpart from the SDSS-DR13 photometric catalogue. The brightest (as measured by modelMag) object within 1.5 arcsec of the AllWISE position is chosen as the most probable optical association. At the time of generating the SPIDERS targeting catalogues (early 2014), this choice seemed appropriate. However, later analysis suggests that better choices could have been made. In section 4.4 we discuss how our simplistic approach to associating AllWISE sources with optical counterparts has impacted the target selection. We will make improvements to this step in future SPIDERS-AGN studies, taking into account the positional uncertainties and sky densities of the mid-IR and optical populations. We find that 28 515/30 855 (92.4 percent) of the RASS+AllWISE sources have at least one SDSS-DR13 photometric optical counterpart within 1.5 arcsec of the AllWISE position. The distribution of AllWISE–SDSS positional offsets is shown in Fig. 6, and the magnitude distribution is shown in Fig. 7.
We then further down-select the 28 515 remaining potential RASS+AllWISE+SDSS targets to get to our final list of SPIDERS objects to be forwarded to the eBOSS tiling team. Firstly, we removed previously spectroscopically identified sources by matching against a list of good-quality primary SDSS-proto-DR12 spectra (see section 2.5). There are 11 643 RASS+AllWISE+SDSS sources with at least one reliable SDSS-proto-DR12 spectrum (within 1 arcsec of the optical photometric catalogue position), and thus, which are not considered for targeting. The majority of these (77 percent) have a pipeline classification of CLASS=QSO. The properties of the spectroscopically identified sources are discussed in more detail in section 5.1.
We then remove RASS+AllWISE+SDSS objects brighter than the nominal magnitude limit of eBOSS (i.e. fiber2Mag_i17.0, where fiber2Mag_i is a measure of the expected flux from the object that would be enclosed within a 2 arcsec diameter fiber under average seeing conditions). This bright source cut removes 7092 objects. To improve our robustness against imperfect modelling of very bright (and possibly saturated) objects, we also remove a small number (319) of objects which escape the fiber2Mag_i cut but which have modelMag_i16.0. These bright limits are motivated by the desire to avoid the on-chip spectra of very bright stars overwhelming the spectra of their neighbours, which can be many magnitudes fainter. We also remove the 283 very faint targets (fiber2Mag_i22.5, for which we do not expect to be able to obtain useful spectra with a 2.5 m-class telescope), and the 150 targets which fall within the BOSS-DR10 bright star mask141414http://data.sdss3.org/sas/dr10/boss/lss/reject_mask/bright_star_mask_pix.ply. The final SPIDERS_RASS_AGN target list contains 9028 candidate targets over the full BOSS targeting footprint (area 10 778 deg2), a density of 0.84 targets deg-2.
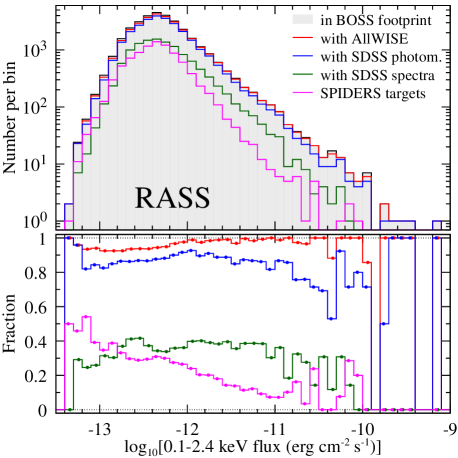
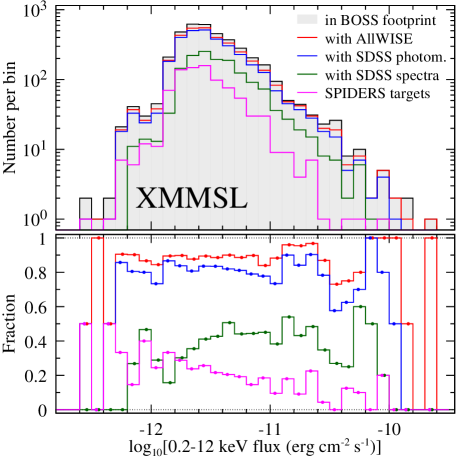
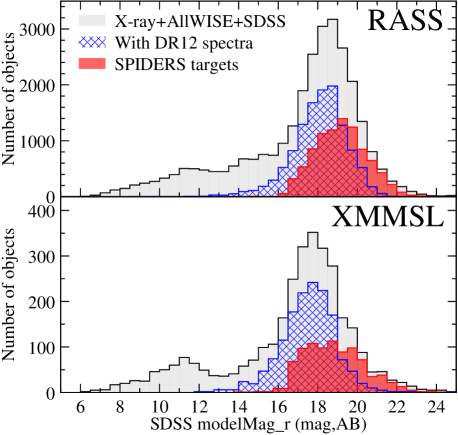
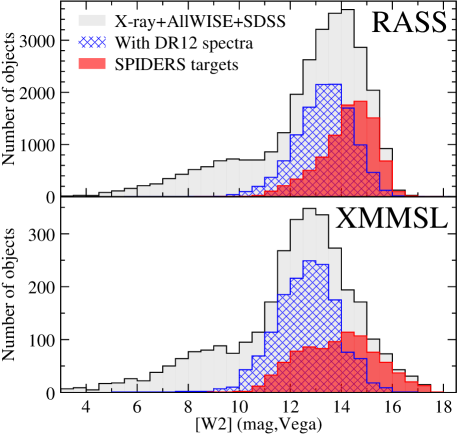
The matching and filtering steps described above are summarised in a flow diagram, see Fig. 8. The format of the catalogue of SPIDERS_RASS_AGN targets is described in Appendix E.3. In Fig. 9 we show the sky distribution of SPIDERS_RASS_AGN targets over the sky. Note that the SGC contains a higher density of targets than the NGC because only a small part of this footprint was targeted during SDSS-I/II, and so a smaller fraction of the RASS sources have existing identifications. In Figs. 10, 11 and 12 we show the distributions of the RASS sample in X-ray flux, -band model magnitude and magnitude at various stages during the cross-matching and down-selection steps described above.
3.4 Selection of SPIDERS_XMMSL_AGN targets
The process of selecting counterparts to the unique XMMSL sources in the BOSS footprint followed closely that carried out for RASS sources (see section 3.3). For each XMMSL source (all 3843 of which have at least one potential AllWISE counterpart lying within 1 arcmin), we used Nway to calculate the posterior probability of it being associated with each of the AllWISE counterparts lying within 1 arcmin. We adopted the same priors on the ,- plane that were used for the RASS sample. In doing this we have ignored the significant differences between the X-ray flux distribution of the XMMSL sources and the fluxes of the 3XMM-Bright reference sample (see Fig. 2). Using a prior derived from a better matched training sample would have been preferable, but we chose not to do so because of the very small number of 3XMM-Bright+AllWISE sources above the bright X-ray fluxes probed by the XMMSL survey. We find that for 3411/3843 (88.8 percent) of XMMSL sources we have a best matching AllWISE counterpart with posterior probability Ppost0.01. The 431 XMMSL sources without at least one AllWISE counterpart above this threshold were not considered further. The 3XMM-Bright+AllWISE reference sample suggests that at the flux limit of the XMMSL survey, virtually all persistent X-ray sources should be detected in the AllWISE survey. However, the fraction of XMMSL sources lacking AllWISE counterparts (11 percent) is nearly three times larger than the 4 percent of full-band X-ray detections in the ‘Clean’ XMMSL catalogue that are expected to be entirely spurious (see section 2.2). This disparity implies that there is either a residual incompleteness in our crossmatching routine, and/or that the XMMSL catalogue contains a small but significant fraction of transient X-ray sources, which may not have persistent mid-IR counterparts above the AllWISE detection limits. We note that if we use a set of control X-ray positions (placed 6 arcmin away from each true X-ray position), and rerun the cross-matching algorithm, the fraction of sources without any valid AllWISE counterpart increases to 24 percent of cases. The distribution of position differences between the XMMSL sources and their best matching AllWISE counterparts is shown in Fig. 4. The magnitude distributions of the best matching AllWISE counterparts are shown in Fig. 5. The ‘best’ AllWISE’ counterpart was then matched to the SDSS-DR13 photometric catalogue, and 3142/3411 (92.1 percent) of the XMMSL+AllWISE sources have at least one optical counterpart within 1.5 arcsec of the AllWISE position (see Figs. 6 and 7). We then further down-selected from this list of 3142 optical counterparts to reach our final list of SPIDERS_XMMSL_AGN targets for observation within SDSS-IV. Matching against the SDSS-proto-DR12 spectral catalogue removes 1411 previously spectroscopically identified X-ray sources. The properties of the spectroscopically identified XMMSL sources are discussed in more detail in section 5.1. For the same reasons described in section 3.3 we have removed from consideration all optical counterparts brighter than the nominal magnitude limit of eBOSS (i.e. fiber2Mag_i17.0, 746 sources), very bright objects (modelMag_i16.0, 59 sources); very faint targets ( fiber2Mag_i22.5, 32 sources), and targets which fall within the BOSS bright star mask (21 targets). The final SPIDERS_XMMSL_AGN target list contains 873 candidate targets over the full BOSS targeting footprint (0.081 targets deg-2).
The matching and filtering steps described above are summarised in a flow diagram, see Fig. 13. The format of the catalogue of SPIDERS_XMMSL_AGN targets is described in Appendix E.4. In Fig. 9 we show the sky distribution of SPIDERS_XMMSL_AGN targets over the sky. In Figs. 10, 11 and 12 we show the distributions of the XMMSL sample in X-ray flux, -band magnitude and magnitude at various stages during the cross-matching and down-selection steps described above.
3.5 X-ray sources with SDSS-DR12 spectra and visual inspections
As noted in sections 3.3 and 3.4, our selection of targets for SPIDERS used a prototype version of the SDSS-DR12 spectroscopic sample to remove from consideration any objects having existing spectroscopy. In order to form a clean sample, we have repeated the cross-matching process of X-ray+AllWISE+SDSS objects to the official SDSS-DR12 catalogue. Using a simple 1 arcsec radial search around the SDSS-DR13 photometric position, we find that SDSS-DR12 contains spectra for 11 913 RASS, and 1482 XMMSL sources. Fig. 14 shows the sky distribution of the X-ray sources with spectroscopic identifications in SDSS-DR12. Note the banded structure in the SGC region, which is imprinted by the narrow sky coverage of SDSS observations prior to the start of the BOSS project.
Although the BOSS redshift fitting algorithm (Bolton et al., 2012) has been shown to be accurate and robust for the galaxies and QSOs that have been targeted in previous iterations of the SDSS project, the routine has not yet been validated for X-ray selected AGN which dominate the SPIDERS AGN samples. Therefore we have carried out a programme of visual inspections (VI) in order to check the accuracy of the pipeline redshifts and spectral classes for SPIDERS targets.
We first collated the existing visual inspection information from several prior works, namely the DR12Q quasar catalogue (Pâris et al. 2017; we consider all inspections from the super-set and supplementary catalogues having Z_PERSON_CONF=3), the DR7Q quasar catalogue (Schneider et al., 2010), the visual inspections (of BLAGN, NLAGN and BL Lac counterparts to RASS sources) from A07, and the visually inspected Blazar/BL Lac catalogue of Plotkin et al. (2010). Of the 11913 RASS sources with SDSS-DR12 spectra, secure visually inspected redshifts were already available for 8848 sources: 1875 from DR12Q, 161 from Plotkin et al. (2010), 6196 from A07, and 4981 from DR7Q. Likewise, for the 1482 XMMSL sources with SDSS-DR12 spectra, VI information was already available for 1046 sources: 214 from DR12Q, 53 from Plotkin et al. (2010), 546 from A07, and 596 from DR7Q. We have visually inspected all of the remaining spectra (3325 unique spectra, associated with 3065 RASS and 436 XMMSL sources). Following our experience with the BOSS/XMM-XXL sample (Menzel et al., 2016), we divided the spectra into higher- and lower-risk categories. Higher-risk spectra were those which met any of the following criteria: a pipeline redshift outside the range , pipeline redshift uncertainty greater than 0.01, any redshift fitting warning flag (ZWARNING), an -band model magnitude fainter than 20.0, or median per-pixel SNR outside the interval [2:50]. Please see Bolton et al. (2012) for a definition of the ZWARNING flag. There were 569 spectra within the higher-risk category, which were examined on average by three visual inspectors. The remaining 2756 lower-risk spectra were each examined by at least one visual inspector.
3.5.1 Visual inspection tools and consolidation
Visual inspection was performed using the web-browser-based speccy151515https://gitlab.rzg.mpg.de/tdwelly/speccy tool, developed (by us) to enable rapid inspection of large numbers of SPIDERS spectra. The speccy tool presents users with a plot of flux versus wavelength for a single observed SDSS spectrum, together with a number of functions to aid the determination of these parameters, including zooming/panning to regions of interest, and box-car smoothing of the observed spectrum. The user may overlay the observed spectrum with: the observer-frame wavelengths of common emission/absorption lines, a template spectrum (by default the best-fitting template found by the eBOSS pipeline is shown), a scaled version of the sky background spectrum, the statistical error spectrum, or the residual (data–model) spectrum. The user can adjust the displayed redshift of the template and emission/absorption lines. The user submits the following information per spectrum: (i) a ‘visual’ redshift measurement; (ii) a redshift confidence flag (3=highly secure, 2=uncertain, 1=poor/unusable, 0=insufficient data), (iii) a classification (we used only six classes: QSO (including BLAGN), Broad Absorption Line (BAL) QSO, Galaxy (including NLAGN), Blazar, Star, None), and (iv) freehand comments for problematic/unusual spectra.
We collected more than 5000 visual inspections from a cadre of twelve inspectors (assembled from within the coauthor list of this paper), and we then consolidated cases where we had multiple inspections per spectrum. We defined a standard decision tree based on the relative agreement of the multiple inspectors in three categories: redshift, redshift confidence and classification. In nearly all cases inspections from multiple inspectors are consistent, and re-inspection/manual-reconciliation (carried out by A. Merloni) was deemed necessary in only a small fraction of cases, mostly due to discrepant redshift assignments. We give a single ‘best’ redshift and spectral classification, plus a merged confidence flag for each inspected spectrum. Where visual inspection information was available from multiple works, we have used the following order of precedence i) our own visual inspections, ii) DR12Q, iii) Plotkin et al. (2010), iv) A07, and finally v) DR7Q.
In a small number of cases (93) the SDSS-DR12 pipeline redshift estimates disagree by more than 1 percent () from those determined through visual inspection. These pipeline failures tend to be ‘catastrophic’, and in 70 percent of cases they over-estimate the true redshifts. As might be expected, a large fraction (45/93, 48 percent) of the pipeline redshift failures are related to sources visually classified as Blazar/BL Lac, i.e. having a strong and relatively featureless continuum. Despite having higher than average SNR spectra, the visual inspection process determined high confidence redshifts only for 13/45 (29 percent) of the Blazar/BL Lacs. Another important failure mode, accounting for 18 percent of redshift failures, occurs when the pipeline misidentifies the Mg II emission line as Ly . For most of the redshift failures (57/93, 61 percent) the pipeline ZWARNING flag is set to a non-zero value, indicating that the algorithm itself has identified a problem with the spectrum and/or the redshift fitting process.
4 Assessing the fidelity of our target selection method
We have undertaken a number of independent tests designed to assess the fidelity of the steps which we have used to select SPIDERS-AGN targets for observation in SDSS-IV. These tests include i) checking the X-rayAllWISE association step for a sub-sample of RASS and XMMSL sources which appear in the XMM-Newton, Chandra and Swift-XRT serendipitous catalogues, ii) using blank field populations to estimate the rate of spurious X-rayAllWISE associations over the whole RASS and XMMSL samples, iii) evaluating the fraction of spurious X-ray detections in the RASS sample, and iv) quantifying the success rate of the association of AllWISE with SDSS-DR13 photometric sources.
4.1 Verification of our X-ray–AllWISE association method using a bright X-ray reference sample
In order to estimate the reliability of our X-ray–mid-IR–optical cross-matching technique we require an independent catalogue of bright X-ray sources that have well determined positions, and that have similar X-ray fluxes to the RASS and XMMSL samples. We have formed a reference sample by selecting a set of well measured bright X-ray sources from the 3XMM catalogue (Rosen et al., 2016), the Chandra Source Catalogue (CSC; Evans et al., 2010) and the Swift X-ray Telescope Point Source catalogue (1SXPS; Evans et al., 2014). In the following we describe how we built this reference catalogue, (selected with a particular emphasis on astrometric accuracy, which in practice requires high signal to noise detections), and how we have used it to measure the reliability of the cross-matching process.
CSC sources: Starting from the full CSC (v1.1) catalogue161616http://cxc.cfa.harvard.edu/csc/ we selected the sub-sample of 1818 sources that are bright (0.2–2 keV flux erg cm-2 s-1), high-quality (detection significance ; error ellipse major axis arcsec), point-like, unconfused, unsaturated, and that lie within the BOSS imaging footprint.
3XMM sources: We re-used the catalogue of 1049 bright high quality point-like 3XMM-DR4 sources previously described in section 2.6.
1SXPS sources: Starting from the full 1SXPS catalogue171717http://www.swift.ac.uk/1SXPS/docs.php we selected the sub-sample of 2142 non-GRB sources that are bright (0.3–2 keV flux erg cm-2 s-1), high-quality (40 net counts; 90 percent error radius arcsec; detection flags ), and that lie within the BOSS imaging footprint.
The bright sub-samples of the CSC, 3XMM and 1SXPS reference samples were merged to form a single catalogue of bright astrometric reference sources. Where multiple detections of single X-ray sources were found in more than one catalogue (within a matching radius of 10 arcsec) we adopted a simple hierarchical approach, prioritizing Chandra detections over XMM-Newton detections, and XMM-Newton over Swift (even if in some cases this leads to a small loss of positional information). We have manually tidied the catalogue to deal with a handful of degenerate cases (two lensed QSOs, a non-nuclear source in NGC 4051, and a case where two detections of a source made in overlapping observations have not been correctly associated with each other). The merged (and tidied) reference catalogue contains 4752 unique X-ray sources (1813 with best detection in CSC, 962 from 3XMM, and 1977 from 1SXPS), and is presented in Appendix E.6.
We matched the X-ray sources to the nearest counterpart in the AllWISE catalogue (Cutri, 2013), limiting our search to within a 5 arcsec radius of the X-ray position for CSC and 3XMM sources, and within 10 arcsec for 1SXPS sources. We found 4524/4752 of the merged X-ray reference sample had a matching AllWISE counterpart. In only 2.7 percent of these cases was there more than one potential AllWISE counterpart within the search radius (mostly 1SXPS sources). The median position difference between X-ray and nearest AllWISE positions is 0.9 arcsec, and 90 percent are separated by less than 3 arcsec. For the X-ray sources having detections in more than one of the CSC, 3XMM and 1SXPS reference samples, we have verified that these simple criteria consistently select the same ‘best’ AllWISE counterpart for each independent X-ray detection. We therefore make the assumption, given the high quality of the X-ray positional information for this reference sample, that these X-rayAllWISE associations are secure.
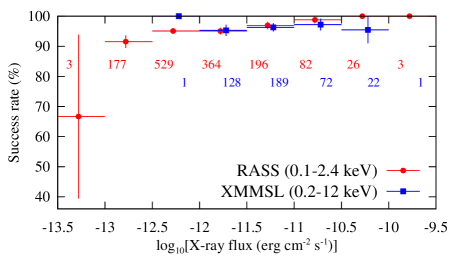
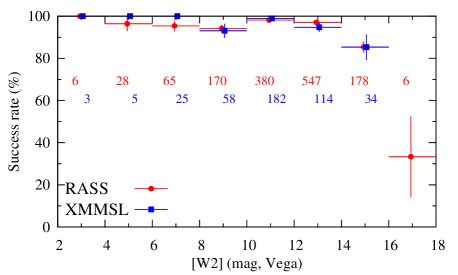
Finally we have matched the merged X-ray reference catalogue to the RASS and XMMSL samples described in sections 3.3 and 3.4 respectively. Using a search radius of 60 arcsec (and using X-ray positional information only), we find 1381 and 421 counterparts to the reference catalogue in the RASS and XMMSL samples respectively. We calculate the fraction of cases in which, starting with the RASS or XMMSL positional information, we have chosen exactly the same AllWISE counterpart that was chosen for the X-ray reference source. The success rates for RASS and XMMSL sources are comparable, with 1314/1381 = percent of RASS sources successfully matched and 404/421 = percent of XMMSL sources (naïve 1 binomial confidence interval). When only considering RASS sources matched to astrometric reference sources from the CSC, the success rate is slightly lower ( percent), which is possibly due to the lower median X-ray flux of the CSC sources. There is a slight trend of decreasing success rate toward fainter X-ray fluxes, see Fig. 15. Except for the very faintest X-ray flux bin (containing only three RASS sources), the success rate is always percent. As might be expected, there is a stronger trend of decreasing success rate toward fainter magnitudes. The success rate in the 1416 mag range is 85 percent for both RASS and XMMSL sources. Approximately 10 percent of the X-ray samples have counterparts in this magnitude range.
4.2 Assessment of the rate of incorrect X-ray–IR associations using blank field samples
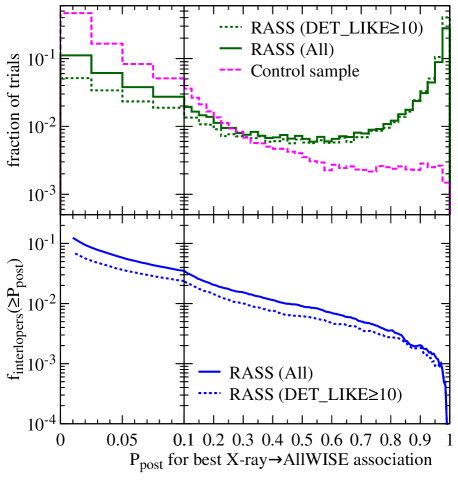
The Bayesian cross-matching algorithm implemented in Nway reports the posterior probability (Ppost) of any two objects being associated, and hence for each X-ray source gives a ranked list of potential counterparts. However, the Bayesian matching algorithm does not tell us about the rate of false positives, so we carry out an empirical check to determine the rate of spurious interlopers as a function of posterior probability (Ppost). We have retrieved a ‘control’ catalogue of AllWISE sources within 1 arcmin radius of the positions of the RASS sources after the X-ray positions have been offset by +0.1 deg in Declination (using locations near the real RASS positions is preferred over randomly distributed positions in order to ensure that the offset catalogue samples approximately the same distribution of Galactic latitudes and AllWISE exposure depth as the RASS sources). For each offset position we follow the method described in section 3.1 to select the AllWISE source having the largest posterior probability of being associated with the offset RASS position. The distribution of Ppost for the RASS and offset samples are shown in Fig. 16 (upper panel). We count up the cases where the Ppost for the best association at the offset position is greater than the Ppost for the best association at the actual RASS position. The lower panel of Fig. 16 shows the rate of such cases, and allows us to make an estimate of the fraction of the RASS+AllWISE associations that are spurious181818 We did not exclude the 0.4 percent of control positions which happen to lie close to neighbouring RASS sources, and so slightly overestimate the spurious fraction.. For the purposes of choosing SPIDERS targets for spectroscopic follow up in SDSS-IV we have made a cut on the posterior probability at the nominally rather low level of Ppost0.01. However, the cumulative curve in the lower panel of Fig. 16 demonstrates that adopting even this low probability threshold, the total fraction of spurious associations within the RASS+AllWISE sample is at a reasonably low level (12.4 percent of the total, equivalent to 3800 spurious associations within the RASS+AllWISE sample). We repeated this exercise for the subset of RASS sources with higher X-ray detection likelihood (DET_LIKE10), i.e. a sub-sample that should be only slightly contaminated with spurious X-ray detections. For this sub-sample, there is a smaller fraction of associations having low Ppost, and hence a lower overall rate of spurious associations (7 percent for Ppost0.01). This suggests that at least part of the lowest probability RASS+AllWISE associations are due to spurious X-ray detections, as we discuss in more detail below. If a very pure sample is a priority, then filtering the RASS+AllWISE sample on the basis of a minimum value of Ppost is possible. For example, in order to achieve a spurious association fraction 3 percent, then one should apply a cut of Ppost0.123 to the full RASS+AllWISE sample (Ppost0.071 for the subset of RASS sources with DET_LIKE10).
4.3 An evaluation of spurious X-ray detections within the RASS sample
Another source of uncertainty in our targeting procedure is the incidence of spurious detections in the RASS catalogue. As mentioned above, the RASS-FSC contains sources detected down to a relatively low confidence level (detection likelihood, DET_LIKE6.5). Boller et al. (2016) carried out simulations of the detection procedure used to produce the 2RXS catalogue. They found that the fraction of spurious detections, averaged over the whole sky and above a detection likelihood (named EXI_LIKE in the 2RXS catalogue) threshold of 6.5, could be as high as 30 percent. The spurious fraction is strongly dependent on the detection likelihood threshold adopted, and drops to 2 percent at DET_LIKE10. Unfortunately, equivalent simulations are not available for 1RXS, so we are unable to make a direct estimate of the spurious fraction in the 1RXS catalogue. However, since both 1RXS and 2RXS are based on almost the same X-ray data-sets, and share many of the same source detection procedures, we assume that the spurious fraction in our 1RXS sample is comparable to that in the 2RXS catalogue.
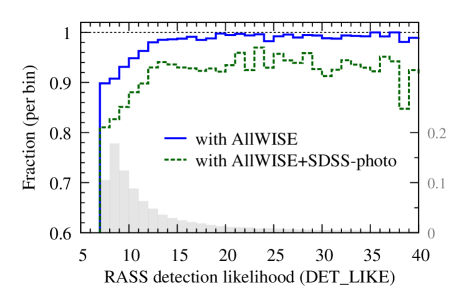
We investigate the rate of contamination by spurious sources further by examining the properties of the RASS sample as a function of DET_LIKE. Fig. 17 shows the distribution in X-ray detection likelihood for the RASS sample, and the sub-samples with AllWISE and SDSS-DR13 photometric counterparts. Clearly, the vast majority of RASS sources not matched to any AllWISE counterpart have low detection likelihoods, and we should expect about half of them to be spurious detections in the RASS catalogue. The fraction of RASS+AllWISE sources lacking optical photometric counterparts appears to be relatively independent of the X-ray detection likelihood.
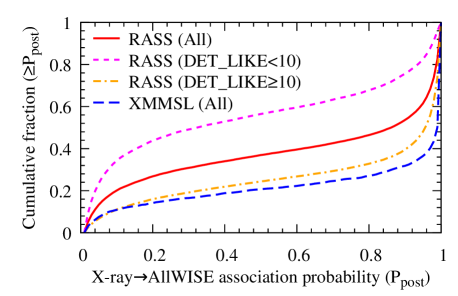
We can also verify the reliability of the source identifications, by looking at the posterior probability Ppost distribution of those RASS sources which are matched to AllWISE counterparts. Fig. 18 shows the cumulative (normalized) posterior probability distribution for RASS+AllWISE sources, and the breakup of the same distribution as a function of X-ray detection likelihood. Clearly, the population of sources with lower X-ray detection likelihoods have a much lower average posterior probability of being associated to their WISE counterparts. It can also be seen that that for high detection likelihood RASS sources (DET_LIKE10) the cumulative distribution of Ppost is very similar to that for XMMSL sources, which are expected to have only a percent contamination by spurious X-ray detections (Saxton et al., 2008, see also the online documentation191919http://www.cosmos.esa.int/web/xmm-newton/xmmsl1d-ug).
4.4 An evaluation of the method used to associate AllWISE sources with optical counterparts
The Nway tool (Salvato et al., in prep.) can compute association probabilities for sets of targets located in two or more catalogues (e.g. X-ray, IR and optical), with any number of priors defined for each possible combination of wave-bands (also see the recent work by Pineau et al. 2017). However, in order to avoid imprinting complex biases into our target selection for SPIDERS-AGN, we decided to instead use the rather simple method of choosing the brightest -band counterpart in the SDSS-DR13 photometric database lying within 1.5 arcsec of the AllWISE position. For a non-negligible fraction (8 percent) of the X-ray+AllWISE sources, no optical counterpart is found within this small search radius. Fig. 17 demonstrates that the fraction of X-ray+AllWISE sources lacking optical counterparts does not strongly depend on X-ray detection likelihood (which roughly scales with X-ray brightness).
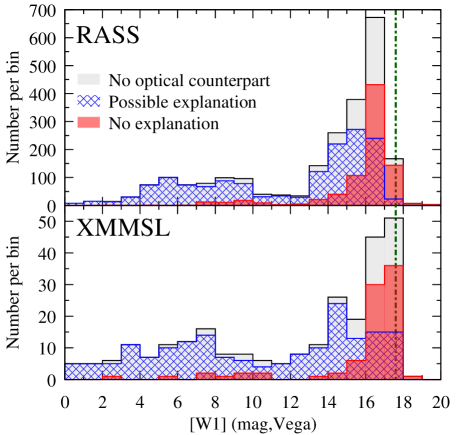
In Fig. 19 we show the magnitude distribution of X-ray-AllWISE sources lacking optical counterparts. We use the band here because at the faint end of the distribution (15 mag), more than 90 percent of objects have their highest SNR detection in this band. Some of the cases at the bright end of the distribution can be attributed to very bright stars, for which the imaging was heavily saturated, leading to catalogue incompleteness and/or degraded IR/optical positions. Indeed, 453 of the RASS and 67 of the XMMSL sources that lack optical counterparts lie within the BOSS-DR10 bright star rejection mask. For 64 RASS and 12 XMMSL sources, the AllWISE positions fall within the optical extent of bright galaxies (de Vaucouleurs et al., 1992). In these cases we might reasonably expect the AllWISE and SDSS positions to differ. A few additional cases (32 RASS and 6 XMMSL sources) fall within SDSS fields having bad photometry202020http://data.sdss3.org/sas/dr10/boss/lss/reject_mask/badfield_mask_postprocess_pixs8.ply. For 17 percent of the RASS sources lacking optical counterparts (23 percent for XMMSL), the AllWISE cc_flags column is non-zero in either the or bands (indicating potential contaminated or spurious detections; Cutri, 2013), much higher than the rate of flagged detections (6 percent) in the X-ray+AllWISE samples for which we do find SDSS counterparts.
After filtering out all these cases we are still left with 1689 RASS and 173 XMMSL sources lacking optical counterparts. The most obvious remaining explanation is that our adopted search radius was too small. Indeed, if we expand the search radius to 5 arcsec around the AllWISE position then we find counterparts to a further 833 RASS and 81 XMMSL sources. This leaves 856 RASS and 92 XMMSL sources (3 percent of the X-ray+AllWISE parent samples) where we cannot immediately explain the lack of an optical counterpart. Apart from a few very bright objects (likely to be high proper motion stars or stars which saturate the SDSS imaging), nearly all of the unexplained cases lie at the faint end of the AllWISE magnitude distribution (see Fig. 19). It is possible that some fraction of these faint objects could have such red optical–IR colours that they are undetected in the SDSS imaging. We will carry out a more thorough analysis of such objects in a future SPIDERS-AGN data release, including an inspection of deeper imaging.
5 Results
The main goal of this work is to provide a complete account of the process by which we chose candidate X-ray AGN targets for observation in the shallower tiers of the SDSS-IV/SPIDERS spectroscopic survey. This serves the dual purpose of enabling further scientific investigation by documenting exactly the selection process, as well as providing large and homogeneous catalogues of bright X-ray sources with reliable multi-wavelength identification (in a well defined statistical sense) and spectroscopic information. In this section, we outline the salient features of these catalogues, and we provide a outlook of possible applications of the SPIDERS-AGN samples.
We describe the catalogue format for spectroscopically identified RASS and XMMSL sources in Appendices E.1 and E.2.
5.1 Properties of X-ray sources with existing spectra in SDSS-DR12
Of the X-ray sources with SDSS-DR12 spectra, there are 11788/11913 RASS and 1469/1482 XMMSL sources having counterparts with visual inspection confidence levels of 3 or equivalent (i.e. secure redshifts), and pipeline redshifts that agree well with the VI redshifts (i.e. ), or that are identified as Blazar/BL Lac by visual inspection, and have a visual inspection confidence level of 2 or greater.
5.1.1 X-ray luminosity distribution
For each of the RASS and XMMSL sources with secure redshifts we calculate the rest-frame X-ray luminosities as follows. We use a K-correction term that is appropriate for the same simple power-law spectral models that were assumed when converting from observed count rate to flux. Specifically, we compute,
| (4) |
where is the luminosity in the rest-frame energy interval, is the luminosity distance based on the visually inspected spectroscopic redshift (see section 3.5), and is the Galactic absorption corrected flux in the observed energy band. The K-correction term, including bandpass conversion, is given by
| (5) |
where is the assumed spectral index ( for RASS sources, and for XMMSL sources).
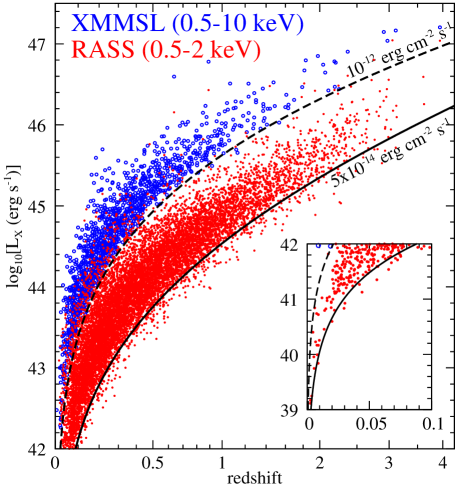
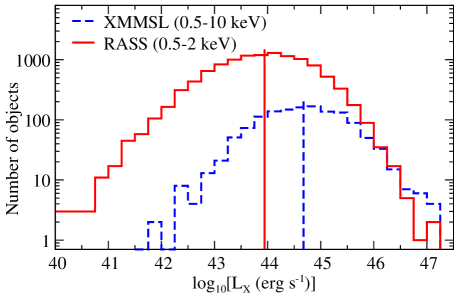
For RASS sources we calculate the 0.5–2 keV luminosity from the Galactic absorption corrected 0.1–2.4 keV flux, assuming . Similarly, for the XMMSL sources we assume to calculate the 0.5–10 keV luminosity from the Galactic absorption corrected 0.2–12 keV flux. The distribution of the spectroscopically identified RASS and XMMSL sources in the redshift–X-ray luminosity plane is shown in Fig. 20. The median X-ray luminosities of the spectroscopically identified RASS and XMMSL samples are and erg s-1 respectively. Both samples contain significant numbers of sources (1177 for RASS and 473 for XMMSL) at extremely high X-ray luminosities ( erg s-1).
In Figs. 21 and 22, we illustrate the partition of the X-ray samples by spectral class as a function of X-ray luminosity and redshift respectively.
5.1.2 Spectral classifications
| CLASS | SUBCLASS | NRASS | NXMMSL |
|---|---|---|---|
| Blazar/BL Lac | 259 | 70 | |
| GALAXY | No subclass | 1639 | 123 |
| AGN | 190 | 31 | |
| AGN BROADLINE | 50 | 8 | |
| BROADLINE | 98 | 10 | |
| STARBURST | 77 | 5 | |
| STARBURST BROADLINE | 8 | 4 | |
| STARFORMING | 297 | 25 | |
| STARFORMING BROADLINE | 18 | 4 | |
| Sub-total | 2518 | 258 | |
| QSO | No subclass | 246 | 8 |
| AGN | 18 | 1 | |
| AGN BROADLINE | 104 | 27 | |
| BROADLINE | 6305 | 731 | |
| STARBURST | 19 | 1 | |
| STARBURST BROADLINE | 2133 | 391 | |
| STARFORMING | 7 | 0 | |
| STARFORMING BROADLINE | 93 | 13 | |
| Sub-total | 9012 | 1189 | |
| STAR | CV | 27 | 11 |
| F5 | 10 | 0 | |
| F9 | 22 | 1 | |
| K1 | 12 | 0 | |
| K3 | 10 | 0 | |
| K7 | 13 | 1 | |
| M2 | 11 | 0 | |
| M3 | 12 | 0 | |
| M4 | 33 | 0 | |
| Other subclass | 77 | 4 | |
| Sub-total | 258 | 22 | |
| Total | 11788 | 1469 |
In Table 2 we give a breakdown of the BOSS pipeline spectral classifications (or visual inspection classification for Blazar/BL Lac) for the counterparts to the X-ray sources with confident spectral classifications. As expected, the vast majority (79 percent for RASS, and 84 percent for XMMSL) of these objects have optical spectra classified as QSO, or as GALAXY but with some signature of AGN emission (i.e. SUBCLASS =AGN, AGN BROADLINE, BROADLINE, STARBURST BROADLINE, or STARFORMING BROADLINE). Blazar/BL Lacs identified through visual inspections constitute 2 and 5 percent of the RASS and XMMSL samples respectively. Another 2–3 percent of the spectra are classified as GALAXY with signs of ongoing star-formation activity (SUBCLASS =STARBURST and STARFORMING). It is feasible that AGN emission features in these star-forming galaxies (SFG) could be overwhelmed by the emission lines powered by star formation. Alternatively some or all of the X-ray emission could be powered by star-formation activity. Only a small fraction (1–2 percent) of the X-ray sources are classified as STAR. However, virtually all of the X-ray sources having optically bright but unobserved counterparts (unobserved because they are brighter than the SDSS spectroscopic limit), are also likely to be Galactic stars.
A significant minority of the X-ray sources (14 percent for RASS, and 8 percent for XMMSL) have spectra classified by the BOSS pipeline as GALAXY, with no subclass, i.e. optically quiescent galaxies (commonly referred to as ‘X-ray bright, optically normal galaxies’, XBONGs Comastri et al., 2002). Many examples of XBONGs have been identified in previous X-ray surveys (e.g. Barger et al., 2001; Georgantopoulos & Georgakakis, 2005; Page et al., 2006; Civano et al., 2007; Trump et al., 2009; Menzel et al., 2016, and references within) with the optical dullness of such galaxies most often attributed to either dilution of a ‘normal’ AGN signature by the host galaxy light, or to objects with intrinsically weak AGN emission signatures (Trump et al., 2009). Alternatively, when the X-ray and optical measurements are well-separated in time, then strong luminosity variations could potentially be another reason for the lack of a clearly observed optical AGN signature. It is also possible for weak AGN signatures to remain hidden within the noise of low SNR and/or low resolution spectra; as typically obtained by spectroscopic follow-up programs where the primary goal is just to obtain redshift measurements for as many X-ray sources as possible.
In previous studies, XBONGs have typically been found in much smaller quantities than seen in our two X-ray samples (c.f. rates of 2.5 percent in the XMM-COSMOS sample; Cappelluti et al. 2009; Trump et al. 2009, and 4 percent in the XMM-XXL survey; Menzel et al. 2016). We would also not expect XBONGs to appear in the high X-ray luminosity part of our samples (see Fig. 21), where the mismatch between X-ray and optical properties is most marked. In order to explain these apparent discrepancies we have investigated the SPIDERS XBONG sample in more detail.
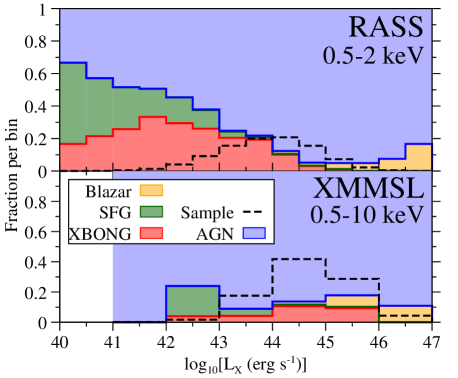
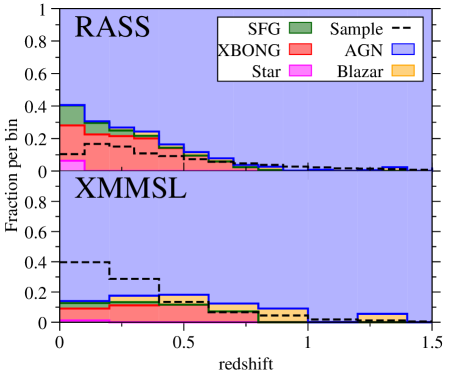
One potential explanation for the lack of clear spectroscopic signatures of AGN activity appearing in the spectra of these objects is that such features (e.g. broad H , H ; strong [O III]) are redshifted out of the observed wavelength range. However we can see from Fig. 22 that the SPIDERS XBONGs all lie at low redshifts. Indeed, most (75 percent) of the apparent XBONGs lie at , where the H line is still within the red limits of the SDSS and BOSS spectrographs (920 and 1040 nm respectively; Smee et al., 2013); all of the apparent XBONGS lie at redshifts where the H and [O III] lines are comfortably within the wavelength range of the observed spectra.
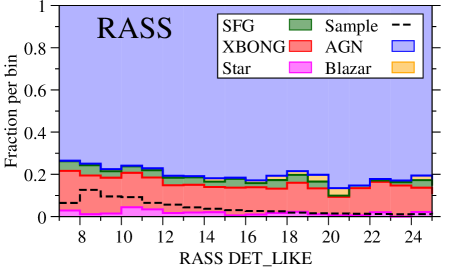
Fig. 23 shows that there is no obvious trend for the fraction of quiescent galaxies to increase at low X-ray detection likelihoods, so we cannot immediately attribute the apparent excess of quiescent galaxies to spurious X-ray detections. However, Fig. 24 illustrates that these quiescent galaxies form a significant fraction of the X-rayAllWISE associations with small values of Ppost, and so could potentially be contaminated by a higher than average rate of incorrect associations. Note that the BOSS pipeline can assign an empty subclass to galaxies having only weak emission lines, including objects with weak evidence of AGN emission (such features were not uniformly searched for as part of the visual inspection process). Therefore, not all of the SPIDERS-AGN sources associated with quiescent galaxies will be completely passive.
In order to keep our input X-ray samples as complete as possible we have not filtered the RASS and XMMSL catalogues to exclude objects with significantly extended X-ray emission; in any case the significant detection of source extent for marginally resolved objects close to the detection limit is extremely difficult. Therefore, it is possible, in some fraction of cases, that we have falsely attributed X-ray emission to AGN activity, whereas it is actually emission from the intra-cluster medium of a galaxy cluster. In order to test this hypothesis we examined the rate at which the RASS and XMMSL sources that are associated with spectroscopically quiescent galaxies also appear within the optically-selected ‘red-sequence Matched-filter Probabilistic Percolation’ (redMaPPer) catalogue of candidate cluster member galaxies presented by Rykoff et al. (2014). We cross-matched the redMaPPer catalogue to the optical counterparts of RASS and XMMSL sources having SDSS-DR12 spectra, using the optical positions and a matching radius of 1 arcsec. We only consider redMaPPer galaxies that have cluster membership probabilities of at least 50 percent (and which lie in clusters of ‘richness’ 20). We find that a significant fraction (35 percent) of the XBONGs are matched to redMaPPer cluster member galaxies (623/1639 and 38/123 of the XBONG counterparts to RASS and XMMSL sources, respectively). As a comparison, the frequency with which redMaPPer galaxies are matched to the non-XBONG counterparts to RASS and XMMSL sources is much lower, of order 1 percent. It is therefore likely that some, but not all of the apparent XBONGs in our spectroscopic samples are actually due to X-ray detections of galaxy clusters. We note that only 2 percent of the SPIDERS-AGN targets put forward for observation within eBOSS/TDSS/SPIDERS are also selected as galaxy cluster targets by Clerc et al. (2016). In Appendix C we present a full breakdown of the overlap of SPIDERS-AGN targets with other eBOSS/TDSS/SPIDERS target classes.
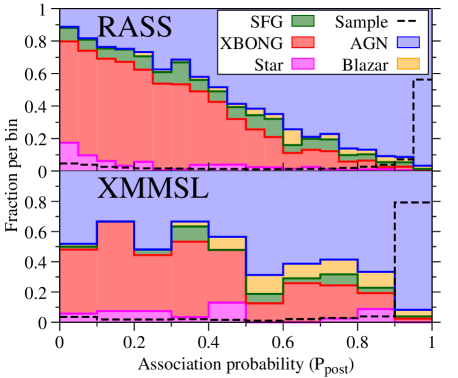
6 Discussion
6.1 Comparison with Anderson et al. (2007)
Our spectroscopically identified sample of RASS sources described in section 5.1 is 70 percent larger that that presented by A07. This is due both to the smaller spectroscopic survey footprint that was available to A07 (5740 deg2 versus the 10 788 deg2 considered here), and also due to the increased sky density of spectroscopic identifications in our sample. In the common area, our catalogue contains 32 percent more RASS sources with spectra than the catalogue of A07.
We find that 6444 of the RASS sources with unambiguous spectroscopic counterparts presented by A07 also appear in our catalogue of RASS sources with AllWISE+SDSS-DR13 photometric counterparts. For 95.6 percent of these X-ray sources we choose exactly the same optical counterpart (within 0.5 arcsec) as chosen by A07. For most (207/281) of the disagreements, we choose a counterpart that is closer to the RASS position than that chosen by A07. This is not unexpected since A07 have considered all potential spectroscopic counterparts lying anywhere within a 1 arcmin radius circle centred on the X-ray position (essentially a flat prior), whereas the Bayesian cross-matching algorithm smoothly down-weights potential counterparts lying far from the nominal X-ray position. The two samples have similar bulk properties, e.g. the median -band magnitude is 18.2 for our spectroscopically identified RASS sample compared to 18.3 for the subset which also appear in A07. Similarly, for extragalactic sources, the median X-ray luminosities are and erg s-1 (0.5–2 keV), and the median redshifts are 0.36 and 0.41 for our spectroscopically identified RASS sample and the A07 subset respectively.
6.2 Predictions for the SPIDERS-AGN Tier-0 program
The combination of existing (SDSS-DR12) redshift measurements and the forthcoming SDSS-IV/SPIDERS data-set will allow us to build a highly complete sample of X-ray selected AGN. We can make a confident prediction for the characteristics of the RASS and XMMSL samples at the end of the SPIDERS program.
Scaling down from the full BOSS footprint (10 778 deg2), we expect 22500 RASS sources and 2670 XMMSL sources to lie within the 7500 deg2 predicted to be covered by the final eBOSS survey footprint. Including both the existing SDSS-DR12 spectra and spectra expected to be collected during SDSS-IV, we estimate that 63 percent of RASS and XMMSL sources in the eBOSS footprint will have spectroscopic redshift information available at the completion of the SPIDERS observations. This does not take into account the large fraction (around 25 percent) of RASS and XMMSL sources which are associated with optical counterparts (mostly stars) brighter than the bright limit of the BOSS spectrograph (fiber2Mag_i17). Discounting these optically very bright sources, the spectroscopic coverage rises to 88 percent. The success rate for reliably measuring redshifts/classifications from SDSS spectra of counterparts to RASS and XMMSL sources is very high, even for the faint end of the population (97 percent), Therefore we estimate that, at least for fiber2Mag_i17, the fraction of the RASS and XMMSL samples with reliable spectroscopic redshift measurements will be 85 percent by the end of the survey.
In summary, the combination of our novel source identification method, and systematic spectroscopic follow-up with SDSS will result, after completion of the SPIDERS-AGN Tier-0 program, in highly complete samples of X-ray selected AGN, probing in a unique way, the portion of the luminosity-redshift plane populated by the most luminous accreting black holes.
7 Conclusions
We have presented here identification of RASS and XMMSL point-like sources with longer wavelength counterparts in SDSS and WISE catalogues with a novel Bayesian cross-matching algorithm that allows priors from multiple catalogues to be considered. In particular, we have shown how the location of sources in the WISE ,- colour-magnitude diagram provides a very efficient way to identify correctly (with 88 percent purity overall, and 93 percent for the subset having high confidence X-ray detections) the mid-IR counterparts to the bright X-ray sources detected in the RASS and XMMSL surveys.
We have then used our new identifications to inform the targeting for the ongoing SPIDERS survey, a sub-programme of the SDSS-IV project, and we present the list of SPIDERS-AGN targets submitted over the entire BOSS imaging footprint. In addition, we present samples of 11 913 RASS+AllWISE and 1482 XMMSL sources that we have associated with spectra published in the SDSS-DR12 catalogue, already one of the largest uniformly selected spectroscopic samples of X-ray AGN ever compiled.
Based on such samples, and on the progress of the ongoing eBOSS/TDSS/SPIDERS survey, we estimate that, at the end of the SDSS-IV program, combining spectra from all generations of SDSS surveys, we will compile a highly complete (85 percent) sample of good-quality optical spectra for more than 15 000 bright X-ray AGN selected both in the soft (ROSAT) and broad (XMM-Newton) X-ray bands, over an area of 7500 deg2.
Acknowledgements
We are very grateful to the referee, F. Carrera, for his detailed comments and suggestions which have substantially improved this work.
Funding for SDSS-III has been provided by the Alfred P. Sloan Foundation, the Participating Institutions, the National Science Foundation, and the U.S. Department of Energy Office of Science. The SDSS-III web site is www.sdss3.org. SDSS-III is managed by the Astrophysical Research Consortium for the Participating Institutions of the SDSS-III Collaboration including the University of Arizona, the Brazilian Participation Group, Brookhaven National Laboratory, Carnegie Mellon University, University of Florida, the French Participation Group, the German Participation Group, Harvard University, the Instituto de Astrofisica de Canarias, the Michigan State/Notre Dame/JINA Participation Group, Johns Hopkins University, Lawrence Berkeley National Laboratory, Max Planck Institute for Astrophysics, Max Planck Institute for Extraterrestrial Physics, New Mexico State University, New York University, Ohio State University, Pennsylvania State University, University of Portsmouth, Princeton University, the Spanish Participation Group, University of Tokyo, University of Utah, Vanderbilt University, University of Virginia, University of Washington, and Yale University.
Funding for the Sloan Digital Sky Survey IV has been provided by the Alfred P. Sloan Foundation, the U.S. Department of Energy Office of Science, and the Participating Institutions. SDSS-IV acknowledges support and resources from the Center for High-Performance Computing at the University of Utah. The SDSS web site is www.sdss.org. SDSS is managed by the Astrophysical Research Consortium for the Participating Institutions of the SDSS Collaboration including the Brazilian Participation Group, the Carnegie Institution for Science, Carnegie Mellon University, the Chilean Participation Group, the French Participation Group, Harvard-Smithsonian Center for Astrophysics, Instituto de Astrofísica de Canarias, The Johns Hopkins University, Kavli Institute for the Physics and Mathematics of the Universe (IPMU)/University of Tokyo, Lawrence Berkeley National Laboratory, Leibniz Institut für Astrophysik Potsdam (AIP), Max-Planck-Institut für Astronomie (MPIA Heidelberg), Max-Planck-Institut für Astrophysik (MPA Garching), Max-Planck-Institut für extraterrestrische Physik (MPE), National Astronomical Observatories of China, New Mexico State University, New York University, University of Notre Dame, Observatório Nacional/MCTI, The Ohio State University, Pennsylvania State University, Shanghai Astronomical Observatory, United Kingdom Participation Group, Universidad Nacional Autónoma de México, University of Arizona, University of Colorado Boulder, University of Oxford, University of Portsmouth, University of Utah, University of Virginia, University of Washington, University of Wisconsin, Vanderbilt University, and Yale University.
This publication makes use of data products from the Wide-field Infrared Survey Explorer, which is a joint project of the University of California, Los Angeles, and the Jet Propulsion Laboratory/California Institute of Technology, and NEOWISE, which is a project of the Jet Propulsion Laboratory/California Institute of Technology. WISE and NEOWISE are funded by the National Aeronautics and Space Administration. This research has made use of the NASA/IPAC Infrared Science Archive, which is operated by the Jet Propulsion Laboratory, California Institute of Technology, under contract with the National Aeronautics and Space Administration. This research has made use of ‘Aladin sky atlas’ developed at CDS, Strasbourg Observatory, France (Bonnarel et al., 2000; Boch & Fernique, 2014). This research has made use of data obtained from the Chandra Source Catalog, provided by the Chandra X-ray Center (CXC) as part of the Chandra Data Archive. This research has made extensive use of the stilts toolset (Taylor, 2006). MB acknowledges support from the FP7 Career Integration Grant ‘eEASy: supermasssive black holes through cosmic time: from current surveys to eROSITA-Euclid Synergies’ (CIG 321913).
References
- Abazajian et al. (2009) Abazajian K. N., et al., 2009, ApJS, 182, 543
- Aihara et al. (2011) Aihara H., et al., 2011, ApJS, 193, 29
- Alam et al. (2015) Alam S., et al., 2015, ApJS, 219, 12
- Anderson et al. (2007) Anderson S. F., et al., 2007, AJ, 133, 313
- Asmus et al. (2014) Asmus D., Hönig S. F., Gandhi P., Smette A., Duschl W. J., 2014, MNRAS, 439, 1648
- Assef et al. (2013) Assef R. J., et al., 2013, ApJ, 772, 26
- Barger et al. (2001) Barger A. J., Cowie L. L., Mushotzky R. F., Richards E. A., 2001, AJ, 121, 662
- Blanton et al. (2017) Blanton M. R., et al., 2017, preprint, (arXiv:1703.00052)
- Boch & Fernique (2014) Boch T., Fernique P., 2014, in Manset N., Forshay P., eds, Astronomical Society of the Pacific Conference Series Vol. 485, Astronomical Data Analysis Software and Systems XXIII. p. 277
- Bogdanov & Grindlay (2009) Bogdanov S., Grindlay J. E., 2009, ApJ, 703, 1557
- Boller et al. (2016) Boller T., Freyberg M. J., Trümper J., Haberl F., Voges W., Nandra K., 2016, A&A, 588, A103
- Bolton et al. (2012) Bolton A. S., et al., 2012, AJ, 144, 144
- Bonnarel et al. (2000) Bonnarel F., et al., 2000, A&AS, 143, 33
- Brandt & Hasinger (2005) Brandt W. N., Hasinger G., 2005, ARA&A, 43, 827
- Broos et al. (2011) Broos P. S., et al., 2011, ApJS, 194, 2
- Brusa et al. (2005) Brusa M., et al., 2005, A&A, 432, 69
- Budavári & Szalay (2008) Budavári T., Szalay A. S., 2008, ApJ, 679, 301
- Cappelluti et al. (2009) Cappelluti N., et al., 2009, A&A, 497, 635
- Civano et al. (2007) Civano F., et al., 2007, A&A, 476, 1223
- Civano et al. (2012) Civano F., et al., 2012, ApJS, 201, 30
- Clerc et al. (2016) Clerc N., et al., 2016, MNRAS,
- Comastri et al. (2002) Comastri A., et al., 2002, ApJ, 571, 771
- Cutri (2013) Cutri R. M. e., 2013, VizieR Online Data Catalog, 2328, 0
- Dawson et al. (2016) Dawson K. S., et al., 2016, AJ, 151, 44
- Donley et al. (2012) Donley J. L., et al., 2012, ApJ, 748, 142
- Elvis et al. (1994) Elvis M., et al., 1994, ApJS, 95, 1
- Evans et al. (2010) Evans I. N., et al., 2010, ApJS, 189, 37
- Evans et al. (2014) Evans P. A., et al., 2014, ApJS, 210, 8
- Fukugita et al. (1996) Fukugita M., Ichikawa T., Gunn J. E., Doi M., Shimasaku K., Schneider D. P., 1996, AJ, 111, 1748
- Gandhi et al. (2009) Gandhi P., Horst H., Smette A., Hönig S., Comastri A., Gilli R., Vignali C., Duschl W., 2009, A&A, 502, 457
- Georgakakis & Nandra (2011) Georgakakis A., Nandra K., 2011, MNRAS, 414, 992
- Georgantopoulos & Georgakakis (2005) Georgantopoulos I., Georgakakis A., 2005, MNRAS, 358, 131
- Greiner & Richter (2015) Greiner J., Richter G. A., 2015, A&A, 575, A42
- Gunn et al. (1998) Gunn J. E., et al., 1998, AJ, 116, 3040
- Gunn et al. (2006) Gunn J. E., et al., 2006, AJ, 131, 2332
- Haakonsen & Rutledge (2009) Haakonsen C. B., Rutledge R. E., 2009, ApJS, 184, 138
- Hamilton (1993) Hamilton A. J. S., 1993, ApJ, 417, 19
- Hamilton & Tegmark (2004) Hamilton A. J. S., Tegmark M., 2004, MNRAS, 349, 115
- Hartmann & Burton (1997) Hartmann D., Burton W. B., 1997, Atlas of Galactic Neutral Hydrogen. Cambridge University Press
- Hickox et al. (2007) Hickox R. C., et al., 2007, ApJ, 671, 1365
- Hinshaw et al. (2013) Hinshaw G., et al., 2013, ApJS, 208, 19
- Høg et al. (2000) Høg E., et al., 2000, A&A, 355, L27
- Hudelot et al. (2012) Hudelot P., et al., 2012, VizieR Online Data Catalog, 2317, 0
- Jones et al. (2004) Jones D. H., et al., 2004, MNRAS, 355, 747
- Jones et al. (2009) Jones D. H., et al., 2009, MNRAS, 399, 683
- Kochanek et al. (2012) Kochanek C. S., et al., 2012, ApJS, 200, 8
- Lacy et al. (2004) Lacy M., et al., 2004, ApJS, 154, 166
- Liu et al. (2016) Liu Z., et al., 2016, MNRAS, 459, 1602
- Mahony et al. (2010) Mahony E. K., Croom S. M., Boyle B. J., Edge A. C., Mauch T., Sadler E. M., 2010, MNRAS, 401, 1151
- Mainieri et al. (2002) Mainieri V., Bergeron J., Hasinger G., Lehmann I., Rosati P., Schmidt M., Szokoly G., Della Ceca R., 2002, A&A, 393, 425
- Marchesi et al. (2016) Marchesi S., et al., 2016, ApJ, 817, 34
- Mateos et al. (2009) Mateos S., Saxton R. D., Read A. M., Sembay S., 2009, A&A, 496, 879
- Mateos et al. (2013) Mateos S., Alonso-Herrero A., Carrera F. J., Blain A., Severgnini P., Caccianiga A., Ruiz A., 2013, MNRAS, 434, 941
- Menzel et al. (2016) Menzel M.-L., et al., 2016, MNRAS, 457, 110
- Merloni et al. (2012) Merloni A., et al., 2012, preprint, (arXiv:1209.3114)
- Mickaelian et al. (2006) Mickaelian A. M., Hovhannisyan L. R., Engels D., Hagen H.-J., Voges W., 2006, A&A, 449, 425
- Morganson et al. (2015) Morganson E., et al., 2015, ApJ, 806, 244
- Myers et al. (2015) Myers A. D., et al., 2015, ApJS, 221, 27
- Neugebauer et al. (1984) Neugebauer G., et al., 1984, ApJ, 278, L1
- Page et al. (2006) Page M. J., et al., 2006, MNRAS, 369, 156
- Parejko et al. (2008) Parejko J. K., Constantin A., Vogeley M. S., Hoyle F., 2008, AJ, 135, 10
- Pâris et al. (2017) Pâris I., et al., 2017, A&A, 597, A79
- Pence et al. (2010) Pence W. D., Chiappetti L., Page C. G., Shaw R. A., Stobie E., 2010, A&A, 524, A42
- Pineau et al. (2011) Pineau F.-X., Motch C., Carrera F., Della Ceca R., Derrière S., Michel L., Schwope A., Watson M. G., 2011, A&A, 527, A126
- Pineau et al. (2017) Pineau F.-X., et al., 2017, A&A, 597, A89
- Planck Collaboration et al. (2016) Planck Collaboration et al., 2016, A&A, 594, A13
- Plotkin et al. (2010) Plotkin R. M., et al., 2010, AJ, 139, 390
- Predehl et al. (2016) Predehl P., et al., 2016, in Society of Photo-Optical Instrumentation Engineers (SPIE) Conference Series. p. 99051K, doi:10.1117/12.2235092
- Rosen et al. (2016) Rosen S. R., et al., 2016, A&A, 590, A1
- Rots & Budavári (2011) Rots A. H., Budavári T., 2011, ApJS, 192, 8
- Rykoff et al. (2014) Rykoff E. S., et al., 2014, ApJ, 785, 104
- SDSS Collaboration et al. (2016) SDSS Collaboration et al., 2016, preprint, (arXiv:1608.02013)
- Saxton et al. (2008) Saxton R. D., Read A. M., Esquej P., Freyberg M. J., Altieri B., Bermejo D., 2008, A&A, 480, 611
- Schneider et al. (2010) Schneider D. P., et al., 2010, AJ, 139, 2360
- Smee et al. (2013) Smee S. A., et al., 2013, AJ, 146, 32
- Stern et al. (2005) Stern D., et al., 2005, ApJ, 631, 163
- Stern et al. (2012) Stern D., et al., 2012, ApJ, 753, 30
- Sutherland & Saunders (1992) Sutherland W., Saunders W., 1992, MNRAS, 259, 413
- Swanson et al. (2008) Swanson M. E. C., Tegmark M., Hamilton A. J. S., Hill J. C., 2008, MNRAS, 387, 1391
- Taylor (2006) Taylor M. B., 2006, in Gabriel C., Arviset C., Ponz D., Enrique S., eds, Astronomical Society of the Pacific Conference Series Vol. 351, Astronomical Data Analysis Software and Systems XV. p. 666
- Trump et al. (2009) Trump J. R., et al., 2009, ApJ, 706, 797
- Trümper (1982) Trümper J., 1982, Advances in Space Research, 2, 241
- Véron-Cetty & Véron (2010) Véron-Cetty M.-P., Véron P., 2010, A&A, 518, A10
- Véron-Cetty et al. (2004) Véron-Cetty M.-P., et al., 2004, A&A, 414, 487
- Voges et al. (1999) Voges W., et al., 1999, A&A, 349, 389
- Voges et al. (2000) Voges W., et al., 2000, VizieR Online Data Catalog, 9029, 0
- Werner et al. (2004) Werner M. W., et al., 2004, ApJS, 154, 1
- Wright et al. (2010) Wright E. L., et al., 2010, AJ, 140, 1868
- York et al. (2000) York D. G., et al., 2000, AJ, 120, 1579
- Zickgraf et al. (2003) Zickgraf F.-J., Engels D., Hagen H.-J., Reimers D., Voges W., 2003, A&A, 406, 535
- de Vaucouleurs et al. (1992) de Vaucouleurs G., de Vaucouleurs A., Corwin Jr. H. G., Buta R. J., Paturel G., Fouque P., 1992, VizieR Online Data Catalog, 7137
Appendix A Estimating X-ray fluxes
A.1 Estimating X-ray fluxes for RASS sources
A full X-ray spectral analysis of each RASS source is not feasible. Therefore, in order to convert the observed instrumental ROSAT count rates (which are collected over the 0.1–2.4 keV range) into physical fluxes we assume a simple spectral model of a power-law absorbed by the full Galactic column of neutral material. This simplifying assumption, valid for the extragalactic AGN in which we are most interested, does however result in overestimated unabsorbed fluxes, for any Galactic sources that lie in front of a significant fraction of the total Galactic column.
We estimate the Galactic column density in the direction of each RASS source using the map of Galactic NH provided by the NASA LAMBDA team212121http://lambda.gsfc.nasa.gov/product/foreground/combnh_map.cfm, which in the region of interest (Dec-30 deg) is based on data from the Leiden/Dwingeloo HI Survey (Hartmann & Burton, 1997). The RASS sources in our sample have a range of Galactic column density in the range NH cm-2, with median NH= cm-2, see the bottom panel of Fig. 25.
To predict the instrumental count rates expected per unit flux for the above mentioned spectral model we use the xspec tool combined with the ROSAT PSPC-C (Position Sensitive Proportional Counter-C) on-axis response matrix222222ftp://legacy.gsfc.nasa.gov/caldb/data/rosat/pspc/cpf/matrices/pspcc_gain1_256.rmf, which is appropriate for RASS observations made prior to 1991 Jan 25. We calculated the count rates and model fluxes over a grid covering the range NH cm-2, and for spectral slopes in the range . From the xspec outputs we then calculate the multiplicative energy conversion factors (ECF), which convert from observed count rate to energy flux, and also the ratios of count rates expected between different detector energy ranges (i.e. hardness ratios). Voges et al. (1999, 2000) provide two hardness ratios for the RASS sources; HR1 is calculated between energy bands ‘A’ (PSPC-C channels 11–41, 0.1–0.4 keV) and ‘B’ (channels 52–201, 0.5–2 keV), and HR2 is calculated between energy bands ‘C’ (channels 52–90, 0.5–0.9 keV) and ‘D’ (channels 91–201, 0.9–2 keV). The hardness ratios are computed as , where and are the vignetting-corrected count rates in the harder and softer bands, respectively.
We compare the predicted model hardness ratios (HR1, HR2) with the observed distributions, binned in small steps of Galactic NH, see Fig. 25. The RASS sources have a wide scatter of hardness ratios, presumably the result of some intrinsic range of spectral shapes within the source population that is additionally broadened by measurement errors. The smaller scatter in HR1 and HR2 for RASS sources with SNR5 indicates that at least some of this scatter is likely to be due to measurement errors. However, a trend of increasing median (and inter-quartile range) of the hardness ratios with Galactic NH can be clearly seen for both the full source sample and for the SNR5 subset. Over the majority of the NH range the median of the HR2 distribution is well traced by a spectral model having . At Galactic columns smaller than NH cm-2 the distribution of RASS sources in HR1 appears to favour a slightly harder spectrum with , hinting at mild spectral curvature over the 0.1–2 keV energy range. Therefore, in order to convert the RASS instrumental count rates and errors to fluxes, we have adopted the intermediate spectral index of .
Note that A07 assumed a slightly softer slope of to convert from RASS count rates to fluxes. In the top panel of Fig. 25 we show the ECF derived using the A07 recipe in comparison to the ECFs derived using xspec. The A07 ECF is always equal to or larger than the ECF adopted here, with the ratio increasing from at Galactic NH= cm-2 to at NH= cm-2, and then declining at larger values of NH. At the median Galactic NH of the RASS sources ( cm-2), the ECF of A07 is 12 percent larger than that used in our work.
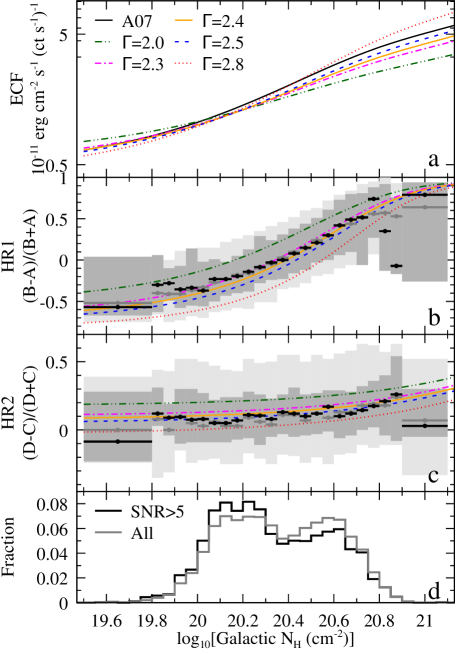
A.2 Estimating unabsorbed X-ray fluxes for 3XMM-Bright sources
The flux estimates supplied in the 3XMM catalogue were calculated assuming a simple power-law spectrum with photon-index absorbed by a fixed neutral column density of NH= cm-2 (Mateos et al., 2009). These fluxes have not been corrected for Galactic absorption.
We have adopted the following method to estimate the unabsorbed fluxes of the 3XMM sources in the 0.1–2.4 keV band to allow direct comparison with the fluxes of RASS sources. We first make the assumption that the 3XMM catalogue fluxes represent a good estimate of the absorbed energy flux in each of the relatively narrow energy bands over which they were calculated: 0.2–0.5 keV (band 1), 0.5–1 keV (band 2) and 1–2 keV (band 3). We then use a look-up table to correct the flux in each of these three energy bands by an amount appropriate for the Galactic column density local to the direction of each source (Hartmann & Burton, 1997). The look-up table was calculated using xspec and assumes an intrinsic spectral model of a power-law having photon index . The unabsorbed flux in the 0.2–0.5 keV band is then extrapolated to 0.1–0.5 keV and the 1–2 keV band is extrapolated to 1–2.4 keV using correction factors appropriate for a spectral model of a power-law having photon index . Specifically, for a power-law this bandwidth correction factor is given by , where [] and [] give the energy bounds of the new and original energy bands respectively. Finally, our estimate of the unabsorbed 0.1–2.4 keV flux is given by the unweighted sum of the unabsorbed flux estimates in the 0.1–0.5, 0.5–1 and 1–2.4 keV bands.
Appendix B Analysis of 3XMM-Bright sources without counterparts in AllWISE
In order to determine if the few 3XMM-Bright sources lacking mid-IR counterparts represent a population of X-ray bright but IR faint emitters, we have visually inspected the XMM-Newton, SDSS and AllWISE images at the X-ray locations of each of the 49/1049 3XMM-Bright sources that do not have at least one AllWISE counterpart within 3 arcsec. The reasons for this can be categorised as follows. i) In 19/49 cases, the lack of a counterpart in the AllWISE catalogue is due to pairs or groups of astrophysical objects being blended in the 6 arcsec resolution AllWISE images. In many of these cases the correct counterpart to the X-ray source (as determined from inspection of higher angular resolution SDSS optical images) is lost in the wings of the PSF of a bright star. ii) In 15/49 cases, the X-ray source lies very close to the edge of the XMM-Newton field of view, and hence the X-ray positions are less well constrained than the nominal positional errors in the catalogue would suggest. For most (10/15) of these high off-axis-angle sources, a potential AllWISE counterpart lies within 5 arcsec of the X-ray position, and for the remainder an AllWISE counterpart lies within 15 arcsec. iii) In 9/49 cases, the X-ray position lies within the optical disk of a nearby well resolved galaxy. iv) In 3/49 cases, the X-ray source can be associated with a high proper motion star, which has moved more than 3 arcsec from the X-ray position in the time that passed between the XMM-Newton observation and the AllWISE observations. v) Finally, in just 3/49 cases, the 3XMM-Bright source can be associated with a faint optical counterpart that in the mid-IR is below the detection limit of the AllWISE survey. One of these (3XMM J003027.4+045139) is the pulsar PSR J0030+0451 (Bogdanov & Grindlay, 2009), one (3XMM J133935.6-003132) is associated with a faint counterpart (=20.90.1, SDSS J133935.59-003132.7) in the SDSS imaging, and one (3XMM J220221.4+015330) has no optical counterpart visible in the SDSS imaging. Fortuitously, the latter source lies within the footprint of the CHFTLS-Wide survey, and we find that there is a single catalogued detection within 3 arcsec of the 3XMM-Bright position: an extremely faint object with =24.060.16 (CFHTLS 1411_033310; Hudelot et al., 2012). We conclude that mid-IR-faint objects do not form a large fraction of the X-ray source population at the bright X-ray fluxes probed by the 3XMM-Bright sample.
Appendix C SDSS targeting efficiency and overlap of SPIDERS-AGN targets with other eBOSS/TDSS/SPIDERS target types
Within the eBOSS/TDSS/SPIDERS project, a heterogeneous mix of targets from a variety of classes share the focal plane during each observation. Designing a near-optimal set of SDSS plug-plates based on these target lists (‘tiling’ in the SDSS parlance) is a non trivial task, described in full by Dawson et al. (2016). In summary, the method is to first assign each target category into one of several ranked collision groups. Each group is tiled in sequence, taking account of the results of previous tiling rounds. Within each collision group a priority ranking scheme is used to determine which target receives a fibre in cases of collisions. SPIDERS targets are considered within the first round of fibre assignments, and as they form the numerically smallest target type and have the highest scientific requirement for completeness, they are given the highest priorities within that round. Therefore, SPIDERS targets can potentially miss out on being assigned a fibre only if they are within 62 arcsec of another SPIDERS target (or if they are flagged as belonging to one of the eBOSS cosmology samples, see below). Within SPIDERS we adopt an internal target priority ranking, again following a scheme wherein rarer populations are tiled with higher priority. The SPIDERS targets are ranked as follows (from highest to lowest priority): i) Brightest Cluster Galaxies from the SPIDERS-Clusters survey, ii) SPIDERS_XMMSL_AGN targets, iii) SPIDERS_RASS_AGN targets, and iv) SPIDERS-Clusters member galaxies. We note that, in order to avoid imprinting a bias in the selection function of eBOSS main samples, any SPIDERS targets that are also selected by one of the eBOSS cosmology target selection algorithms (see below) are tiled with the same priority as targets from those other programs (i.e. at a lower priority than for unique SPIDERS targets).
| eBOSS Target Flag | ET1 | ET2 | NRASS | NXMMSL |
| LRG1_WISE | 1 | n/a | 9 | 1 |
| QSO1_VAR_S82 | 9 | n/a | 6 | 0 |
| QSO1_EBOSS_CORE | 10 | n/a | 705 | 47 |
| QSO1_PTF | 11 | n/a | 270 | 15 |
| QSO1_EBOSS_FIRST | 14 | n/a | 96 | 11 |
| TDSS_TARGET | 30 | any | 467 | 48 |
| TDSS_FES_DE | 30 | 21 | 15 | 6 |
| TDSS_FES_NQHISN | 30 | 23 | 3 | 0 |
| TDSS_FES_VARBAL | 30 | 25 | 1 | 0 |
| TDSS_B | 30 | 26 | 161 | 18 |
| TDSS_FES_HYPQSO | 30 | 27 | 11 | 2 |
| TDSS_FES_HYPSTAR | 30 | 28 | 5 | 1 |
| TDSS_CP | 30 | 31 | 274 | 22 |
| SPIDERS_RASS_AGN | 31 | 0 | 4057 | 120 |
| SPIDERS_XMMSL_AGN | 31 | 4 | 120 | 376 |
| SPIDERS_RASS_CLUS | 31 | 1 | 93 | 12 |
| SPIDERS_XCLASS_CLUS | 31 | 5 | 3 | 3 |
| Any non-SPIDERS target | 1030 | 82 | ||
| Unique targets | 2852 | 200 | ||
| Total | 4057 | 376 |
At the time of writing (early 2017), a substantial fraction of the tiling process for the eBOSS/TDSS/SPIDERS survey has been carried out, covering 4010 deg2 of sky (the tiling ‘chunks’ named internally as eboss1--5, eboss9, and eboss16). In this initial sky area, indicated in Fig. 9, we find that 3971/4057 of SPIDERS_RASS_AGN targets and 369/376 of SPIDERS_XMMSL_AGN targets are assigned a fibre; an impressive targeting efficiency of 98 percent.
Within eBOSS/TDSS/SPIDERS there are a number of independent routes through which an object can be selected to receive a fibre, and so some targets are included in more than one target selection scheme. In Table 3 we list the eBOSS/TDSS/SPIDERS target categories which overlap with the SPIDERS_RASS_AGN and SPIDERS_XMMSL_AGN targets in the first 4010 deg2 of tiled eBOSS sky. We find that 25 percent of SPIDERS_RASS_AGN targets and 22 percent of SPIDERS_XMMSL_AGN targets overlap with at least one other non-SPIDERS target class. We can see that for SPIDERS_RASS_AGN targets, the most frequent overlap (17 percent) is with the core eBOSS QSO target sample (QSO1_EBOSS_CORE), which is targeting optical+mid-IR selected objects in the redshift range (Myers et al., 2015). There is also some overlap with the TDSS project (12 percent of SPIDERS_RASS_AGN targets), see Morganson et al. (2015) for more details. For SPIDERS_XMMSL_AGN, the most frequent overlap, as would be expected, is with SPIDERS_RASS_AGN targets (32 percent), although there is also a significant overlap with the eBOSS QSOs and TDSS targets. Note that the entries for XMMSL targets in Table 3 should be considered indicative only, as for this sky area we used a version of the SPIDERS_XMMSL_AGN catalogue which mistakenly excluded sources having multiple X-ray detections (see section 2.2).
Appendix D SEQUELS: SPIDERS-AGN targets in the eBOSS pilot survey
The Sloan Extended QUasar, ELG and LRG Survey (SEQUELS), was a pilot programme designed to demonstrate the target selection for the main eBOSS/TDSS/SPIDERS survey (Alam et al., 2015; Dawson et al., 2016). The spectroscopic observations for SEQUELS were carried out in the MJD range [56660:57166] and include a total of 117 good quality plates, covering a sky area of 471.9 deg2 within the NGC. A summary of the target selection processes for all categories of SEQUELS target types is given in section A.3 of Alam et al. (2015), here we provide a detailed description of the process by which SPIDERS-AGN targets were selected for SEQUELS. The latter differs substantially from the two-step RASSAllWISESDSS method by which SPIDERS-AGN targets were selected for observation in the main part of SDSS-IV (as described in section 3.3). Note that the XMMSL catalogue was not considered when choosing targets for SEQUELS.
The total time available for SEQUELS observations was not well known at the time of selecting targets (2013), and so all contributing teams were asked to provide sufficient targets to cover an optimistically large footprint; defined by the 813 deg2 of the BOSS imaging footprint lying within the bounds 120R.A.210 deg and +45Dec+60 deg. There are 3049 RASS (BSC+FSC) sources lying inside this region, 3042 of which have at least one optical counterpart within 1 arcmin in the SDSS-DR8 photometric catalogue (Aihara et al., 2011). We removed from further consideration any RASS sources with X-ray positions lying within 30 arcsec radius of any bright star in the Tycho-II catalogue (Høg et al., 2000, 276 X-ray sources), or any object in the AGN catalogue of Véron-Cetty & Véron (2010, 307 X-ray sources), or any object having a pipeline classification of QSO in the SDSS-DR11 spectroscopic catalogue (Alam et al., 2015, 1174 X-ray sources). After these filtering steps we are left with 1563 X-ray sources.
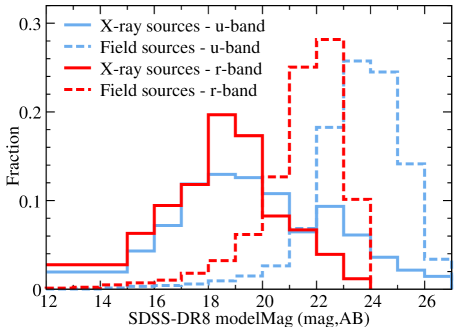
We used a prototype version of Nway (Salvato et al., in prep.) to choose the most probable optical counterpart for each remaining RASS source. We instructed Nway to take account of the X-ray positions and their uncertainties, the positions and model , magnitudes of the candidate optical counterparts, plus pre-defined priors on the expected distribution of counterparts in and . To derive the priors for the SEQUELS SPIDERS-AGN target selection, we first computed the - and -band magnitude distributions of a sample of well-understood, X-ray bright XMM-Newton-detected sources matched to the SDSS-DR7 catalogue taken from Georgakakis & Nandra (2011), and then divided these distributions by the - and -band magnitude distributions of all SDSS-DR8 photometric objects in the sky area considered232323Before reaching the decision to use - and -band magnitude priors, we first experimented with a number of alternative combinations of priors, both in magnitude and colour. However, none of the tested combinations performed as well as the - and -band magnitude priors finally adopted here.. Our adopted priors for SEQUELS are illustrated in Fig. 26. After running Nway, which produces a ranked list of potential counterparts for each remaining X-ray source, we further down-selected the sample to form a list of potential spectroscopic targets. For each RASS source we considered only the ‘best’ optical counterpart (the one having the highest posterior probability as determined by Nway). Many (408/1563) of the best optical counterparts already had spectroscopic identifications/redshifts in the SDSS-DR11 spectroscopic catalogue (Alam et al., 2015, 80 with CLASS=QSO; 77 with CLASS=STAR; 240 with CLASS=GALAXY) and so were removed from further consideration. Of the remaining 1155 X-ray sources, we retained only the 630 having counterparts inside the magnitude range accessible by 1 hour exposures with the BOSS spectrograph ( mag; 455 were too bright, and 30 were too faint). Finally, we discarded three of the remaining RASS sources which had poorly determined X-ray positions and uncertainties. The filtering steps left 627 optical counterparts to be put forward for targeting within the SEQUELS program. A catalogue of these targets is presented in Appendix E.5.
At the plate design stage (after collation of all categories of SEQUELS targets), 599/627 of our targets were allocated a fibre within at least one of the 222 plates designed for SEQUELS. There were 307 RASS-selected AGN targets of which lie within the 117 plates that were actually manufactured and observed before the conclusion of the SEQUELS programme. The SDSS spectra associated with these targets have the SPIDERS_RASS_AGN flag set within the EBOSS_TARGET0 bitmask in the SDSS-DR13 spectroscopic database (SDSS Collaboration et al., 2016).
Appendix E Detailed description of SPIDERS-AGN catalogues
In this section we describe the format and content of the catalogues released as part of this paper. All of these catalogues are supplied in the Flexible Image Transport System (FITS) file format (Pence et al., 2010) and are distributed via the MPE X-ray surveys website (http://www.mpe.mpg.de/XraySurveys/SPIDERS/SPIDERS_AGN). The SPIDERS-AGN target catalogues are also hosted (albeit, in a slightly different format to that described below) on the SDSS-DR13 website (https://data.sdss.org/sas/dr13/eboss/spiders/target), and their content is described on the corresponding ‘data model’ webpage (https://data.sdss.org/datamodel/files/SPIDERS_TARGET). For each column of each catalogue we give the column name, the FITS format code, and a description of the column’s meaning, including units where appropriate.
E.1 Catalogue of RASS sources with spectroscopy in SDSS-DR12
See section 3.5 for a description of how this catalogue was created. The RASS+SDSS-DR12 catalogue contains 11913 entries, with the following columns:
- RASS_*
- RASS_ID (16A)
-
RASS source identifier
- RASS_BF_FLAG (1A)
-
Flag indicating if this X-ray source is taken from the RASS-BSC (‘B’) or RASS-FSC (‘F’)
- RASS_RA (1D)
-
Right Ascension of X-ray source (deg, J2000)
- RASS_DEC (1D)
-
Declination of X-ray source (deg, J2000)
- RASS_RADEC_ERR (1E)
-
1 uncertainty on X-ray position (arcsec)
- RASS_SRC_RATE (1E)
-
Observed X-ray count rate in the 0.1–2.4 keV band (ct s-1)
- RASS_SRC_RATE_ERR (1E)
-
Statistical uncertainty on X-ray count rate (ct s-1)
- RASS_BACK_RATE (1E)
-
Estimated background count rate at source location (ct s-1 arcmin-2)
- RASS_TEXP (1E)
-
Effective exposure time at source location (s)
- RASS_HR1 (1E)
-
First hardness ratio measure
- RASS_HR1_ERR (1E)
-
Uncertainty on first hardness ratio measure
- RASS_HR2 (1E)
-
Second hardness ratio measure
- RASS_HR2_ERR (1E)
-
Uncertainty on second hardness ratio measure
- RASS_EXT_LIKE (1E)
-
Likelihood of X-ray source being extended
- RASS_DET_LIKE (1E)
-
Likelihood of X-ray source detection
- RASS_ECF_GAMMA2p4 (1E)
-
Multiplicative energy conversion factor used to convert from observed count rate to unabsorbed flux assuming a power-law spectrum with slope =2.4 ([erg cm-2 s-1]/[ct s-1])
- RASS_SRC_FLUX (1E)
-
Unabsorbed flux in the 0.1–2.4 keV band corrected for full Galactic column (erg cm-2 s-1)
- RASS_SRC_FLUX_ERR (1E)
-
Statistical uncertainty on unabsorbed flux (erg cm-2 s-1)
- RASS_GAL_LONG (1D)
-
Galactic longitude of X-ray source (deg)
- RASS_GAL_LAT (1D)
-
Galactic latitude of X-ray source (deg)
- RASS_LOGGALNH (1E)
-
Logarithm of Galactic column density in direction of X-ray source (log)
- RASS_ALLW_DIST (1D)
-
Distance between X-ray position and position of best AllWISE counterpart (arcsec)
- RASS_ALLW_BIAS (1D)
-
Bayesian prior (or bias) factor, , of the best AllWISE counterpart, derived from its location in -- parameter space
- RASS_ALLW_BFPOST (1D)
-
Bayesian posterior probability of the best X-rayAllWISE association, before considering bias factor
- RASS_ALLW_POST (1D)
-
Bayesian posterior probability of the best X-rayAllWISE association, including the bias factor
- ALLW_*
-
Properties of the best AllWISE counterpart to the X-ray source (all taken from Cutri, 2013)
- ALLW_ra (1D)
-
The Right Ascension of the AllWISE source (deg, J2000)
- ALLW_dec (1D)
-
The Declination of the AllWISE source (deg, J2000)
- ALLW_sigra (1E)
-
The component of the positional uncertainty of the AllWISE source parallel to Right Ascension (arcsec)
- ALLW_sigdec (1E)
-
The component of the positional uncertainty of the AllWISE source parallel to Declination (arcsec)
- ALLW_w1mpro (1E)
-
The magnitude of the AllWISE source (mag, Vega)
- ALLW_w1sigmpro (1E)
-
The magnitude uncertainty of the AllWISE source (mag, Vega)
- ALLW_w2mpro (1E)
-
The magnitude of the AllWISE source (mag, Vega)
- ALLW_w2sigmpro (1E)
-
The magnitude uncertainty of the AllWISE source (mag, Vega)
- ALLW_w3mpro (1E)
-
The magnitude of the AllWISE source (mag, Vega)
- ALLW_w3sigmpro (1E)
-
The magnitude uncertainty of the AllWISE source (mag, Vega)
- ALLW_w4mpro (1E)
-
The magnitude of the AllWISE source (mag, Vega)
- ALLW_w4sigmpro (1E)
-
The magnitude uncertainty of the AllWISE source (mag, Vega)
- ALLW_W1_W2 (1D)
-
The - colour of the AllWISE source (mag, Vega)
- ALLW_cc_flags (4A)
-
A set of ‘contamination and confusion’ quality flags for the AllWISE source
- ALLW_r_2mass (1E)
-
The distance from the AllWISE source to the nearest 2MASS counterpart (arcsec)
- ALLW_pa_2mass (1E)
-
The position angle of the nearest 2MASS counterpart from the AllWISE source (degrees)
- ALLW_n_2mass (1J)
-
The number of 2MASS counterparts within 3 arcsec of the AllWISE source
- ALLW_j_m_2mass (1E)
-
The band magnitude of the nearest 2MASS counterpart to the AllWISE source (mag, Vega)
- ALLW_j_msig_2mass (1E)
-
The band magnitude uncertainty of the nearest 2MASS counterpart (mag, Vega)
- ALLW_h_m_2mass (1E)
-
The band magnitude of the nearest 2MASS counterpart (mag, Vega)
- ALLW_h_msig_2mass (1E)
-
The band magnitude uncertainty of the nearest 2MASS counterpart (mag, Vega)
- ALLW_k_m_2mass (1E)
-
The band magnitude of the 2MASS counterpart (mag, Vega)
- ALLW_k_msig_2mass (1E)
-
The band magnitude uncertainty of the nearest 2MASS counterpart (mag, Vega)
- SDSS_*
-
Properties of the best SDSS-DR13 photometric counterpart to the AllWISE source (taken from SDSS Collaboration et al., 2016)
- SDSS_RUN (1J)
-
Element of the standard five-part SDSS photometric source identification descriptor
- SDSS_RERUN (3A)
-
see above
- SDSS_CAMCOL (1J)
-
see above
- SDSS_FIELD (1J)
-
see above
- SDSS_ID (1J)
-
see above
- SDSS_RA (1D)
-
The Right Ascension of the SDSS-DR13 photometric counterpart (deg, J2000)
- SDSS_DEC (1D)
-
The Declination of the SDSS-DR13 photometric counterpart (deg, J2000)
- SDSS_MODELMAG_u (1E)
-
The ‘model magnitude’ of the optical counterpart to the X-ray source in the band, assuming a 2 arcsec diameter fibre (mag, AB)
- SDSS_MODELMAG_g (1E)
-
as above, but for the band
- SDSS_MODELMAG_r (1E)
-
as above, but for the band
- SDSS_MODELMAG_i (1E)
-
as above, but for the band
- SDSS_MODELMAG_z (1E)
-
as above, but for the band
- SDSS_FIBER2MAG_u (1E)
-
The ‘fiber magnitude’ of the optical counterpart to the X-ray source in the band, assuming a 2 arcsec diameter fibre (mag, AB)
- SDSS_FIBER2MAG_g (1E)
-
as above, but for the band
- SDSS_FIBER2MAG_r (1E)
-
as above, but for the band
- SDSS_FIBER2MAG_i (1E)
-
as above, but for the band
- SDSS_FIBER2MAG_z (1E)
-
as above, but for the band
- DR12_*
-
Properties extracted from the SDSS-DR12 spectroscopic catalogue (Alam et al., 2015)
- DR12_SURVEY (6A)
-
The SDSS survey in which this spectrum was obtained
- DR12_PLATE (1J)
-
The SDSS spectroscopic plate index
- DR12_MJD (1J)
-
The date on which the last spectroscopic data for the plate were obtained (MJD, days)
- DR12_FIBERID (1J)
-
The index of the spectroscopic fibre through which this spectrum was obtained
- DR12_PLUG_RA (1D)
-
The Right Ascension of the spectroscopic fibre position (deg, J2000)
- DR12_PLUG_DEC (1D)
-
The Declination of the spectroscopic fibre position (deg, J2000)
- DIST_PHOT_PLUG (1E)
-
The distance between the SDSS-DR13 photometric catalogue position and the spectroscopic fibre position (arcsec)
- DR12_Z (1E)
-
The best fitting redshift solution computed by the SDSS-DR12 spectroscopic pipeline
- DR12_Z_ERR (1E)
-
Uncertainty on the best redshift solution computed by the SDSS-DR12 spectroscopic pipeline
- DR12_ZWARNING (1J)
-
Flag that is set to when the pipeline has encountered problems during the spectral reduction and redshift fitting process
- DR12_SN_MEDIAN_ALL (1E)
-
The median SNR (per pixel) of the spectrum
- DR12_RCHI2 (1E)
-
The reduced of the best redshift solution
- DR12_CLASS (6A)
-
The broad spectral classification computed by the SDSS-DR12 spectroscopic pipeline
- DR12_SUBCLASS (21A)
-
The detailed spectral classification computed by the SDSS-DR12 spectroscopic pipeline
- DR12_NSPECOBS (1J)
-
Number of SDSS-DR12 spectra that are associated with this object
- DR12_RUN2D (6A)
-
Version code for the lower level SDSS spectral reduction pipeline used to process this spectrum
- DR12_RUN1D (6A)
-
Version code for the higher SDSS spectral reduction software used to process this spectrum
- DR7Q_*
-
Visual inspection information for this spectrum extracted from the SDSS-DR7Q quasar catalogue (Schneider et al., 2010)
- DR7Q_MEMBER (1B)
-
Flag, set to 1 if a visual inspection for this spectrum was part of the SDSS-DR7Q catalogue
- DR7Q_Z_VI (1E)
-
Visual inspection redshift from SDSS-DR7Q
- DR12Q_*
-
Visual inspection information for this spectrum extracted from the SDSS-DR12Q quasar catalogue (Pâris et al., 2017)
- DR12Q_MEMBER (1B)
-
Flag, set to 1 if a visual inspection for this spectrum was part of the SDSS-DR12Q catalogue
- DR12Q_Z_VI (1E)
-
Visual inspection redshift from SDSS-DR12Q
- DR12Q_CLASS_PERSON (1J)
-
Visual inspection spectral classification from SDSS-DR12Q
- DR12Q_Z_CONF_PERSON (1J)
-
Visual inspection redshift confidence from SDSS-DR12Q
- DR12Q_ORIGIN (8A)
-
Whether this spectrum appeared in the SDSS-DR12Q main catalogue, the superset catalogue or the supplementary bad spectrum catalogue
- AO7_*
-
Visual inspection information for this spectrum extracted from Anderson et al. (2007)
- A07_MEMBER (1B)
-
Flag, set to 1 if a visual inspection for this spectrum was part of the A07 catalogue
- A07_Z (1E)
-
Visual inspection redshift from A07
- A07_CLASS (6A)
-
Visual inspection spectral classification from A07
- A07_FXcor (1E)
-
X-ray flux estimate (0.1–2.4 keV) from A07 (erg cm-2 s-1)
- A07_logLX (1E)
-
X-ray luminosity estimate (0.1–2.4 keV) from A07 (log)
- P10_*
-
Visual inspection information for this spectrum extracted from Plotkin et al. (2010)
- P10_MEMBER (1B)
-
Flag, set to 1 if a visual inspection for this spectrum was part of the Plotkin et al. (2010) catalogue
- P10_Z (1E)
-
Visual inspection redshift from Plotkin et al. (2010)
- P10_ZSP (1A)
-
Visual inspection spectral classification from Plotkin et al. (2010)
- P10_CONF (1A)
-
Original visual inspection confidence measure from Plotkin et al. (2010)
- P10_Z_CONF (1J)
-
Derived visual inspection confidence measure from Plotkin et al. (2010)
- D17_*
-
Visual inspection information for this spectrum produced by the SPIDERS team
- D17_MEMBER (1B)
-
Flag, set to 1 if at least one visual inspection was carried out by the SPIDERS team
- D17_NINSPECTORS (1J)
-
Number of SPIDERS visual inspectors who examined the spectrum
- D17_Z (1E)
-
Redshift derived from the visual inspections carried out by the SPIDERS team
- D17_Z_CONF (1J)
-
Redshift confidence derived from the visual inspections carried out by the SPIDERS team
- D17_CLASS (8A)
-
Spectral class derived from the visual inspections carried out by the SPIDERS team
- D17_RECONCILED (1J)
-
Flag, set to 1 if manual reconciliation of the SPIDERS team visual inspections was carried out
- VI_BEST (7A)
-
The origin of the ‘best’ visual inspection (one of DR7Q, DR12Q, AO7, P10, or SPIDERS)
- Z_BEST (1E)
-
The best visual inspection redshift
- Z_CONF_BEST (1J)
-
The confidence of the best visual inspection redshift
- Z_DIFF (1E)
-
The difference between the SDSS-DR12 pipeline redshift and the best visual inspection redshift
- CLASS_BEST (8A)
-
The best visual inspection spectral classification
- DL_BEST (1E)
-
The luminosity distance derived from the best visual inspection redshift (Mpc)
- RASS_LOGLX (1E)
-
Estimate of the X-ray luminosity (corrected for Galactic absorption) in the rest-frame 0.1–2.4 keV band (log)
- RASS_LOGLX_ERR (1E)
-
Statistical uncertainty on the X-ray luminosity (log)
- RASS_LOGLX_05_2 (1E)
-
Estimate of the X-ray luminosity (corrected for Galactic absorption) in the rest-frame 0.5–2 keV band (log)
E.2 Catalogue of XMMSL sources with spectroscopy in SDSS-DR12
See section 3.5 for a description of how this catalogue was created. The RASS+SDSS-DR12 catalogue contains 1482 entries, with the following columns:
- XMMSL_*
-
X-ray source properties derived from the XMMSL source catalogue (Saxton et al., 2008)
- XMMSL_UNIQUE_SRCNAME (40A)
-
XMMSL source identifier
- XMMSL_OBSID (10A)
-
XMM-Newton observation identifier of the slew in which the source was detected
- XMMSL_RA (1D)
-
Right Ascension of X-ray source (deg, J2000)
- XMMSL_DEC (1D)
-
Declination of X-ray source (deg, J2000)
- XMMSL_RADEC_ERR (1D)
-
1 uncertainty on X-ray position (arcsec)
- XMMSL_DATE_OBS (19A)
-
Date of start of XMM-Newton slew (YYYY-MM-DDThh:mm:ss)
- XMMSL_DATE_END (19A)
-
Date of end of XMM-Newton slew (YYYY-MM-DDThh:mm:ss)
- XMMSL_SCTS_FULL (1E)
-
Background-subtracted source counts in the 0.2–12 keV energy band (cts)
- XMMSL_SCTS_FULL_ERR (1E)
-
Statistical uncertainty on above (cts)
- XMMSL_SCTS_SOFT (1E)
-
Same as above but for the 0.2–2 keV band
- XMMSL_SCTS_SOFT_ERR (1E)
-
Same as above but for the 0.2–2 keV band
- XMMSL_SCTS_HARD (1E)
-
Same as above but for the 2–12 keV band
- XMMSL_SCTS_HARD_ERR (1E)
-
Same as above but for the 2–12 keV band
- XMMSL_BG_MAP_FULL (1E)
-
Estimated number of background counts within source extraction aperture in the 0.2–12 keV band (cts)
- XMMSL_BG_MAP_HARD (1E)
-
Same as above but for the 0.2–2 keV band
- XMMSL_BG_MAP_SOFT (1E)
-
Same as above but for the 2–12 keV band
- XMMSL_EXP_MAP_FULL (1E)
-
Effective exposure time in the 0.2–12 keV band (s)
- XMMSL_EXP_MAP_SOFT (1E)
-
Same as above but for the 0.2–2 keV band
- XMMSL_EXP_MAP_HARD (1E)
-
Same as above but for the 2–12 keV band
- XMMSL_RATE_FULL (1E)
-
Background-subtracted and vignetting-corrected count rate in the 0.2–12 keV energy band (ct s-1)
- XMMSL_RATE_FULL_ERR (1E)
-
Statistical uncertainty on above (ct s-1)
- XMMSL_RATE_SOFT (1E)
-
Same as above but for the 0.2–2 keV band
- XMMSL_RATE_SOFT_ERR (1E)
-
Same as above but for the 0.2–2 keV band
- XMMSL_RATE_HARD (1E)
-
Same as above but for the 2–12 keV band
- XMMSL_RATE_HARD_ERR (1E)
-
Same as above but for the 2–12 keV band
- XMMSL_FLUX_FULL (1E)
-
Estimated X-ray flux (corrected for full Galactic column) in the 0.2–12 keV energy band (erg cm-2 s-1)
- XMMSL_FLUX_FULL_ERR (1E)
-
Statistical uncertainty on above (erg cm-2 s-1)
- XMMSL_FLUX_SOFT (1E)
-
Same as above but for the 0.2–2 keV band
- XMMSL_FLUX_SOFT_ERR (1E)
-
Same as above but for the 0.2–2 keV band
- XMMSL_FLUX_HARD (1E)
-
Same as above but for the 2–12 keV band
- XMMSL_FLUX_HARD_ERR (1E)
-
Same as above but for the 2–12 keV band
- XMMSL_HR1 (1E)
-
Hardness ratio compute between the 0.2–2 keV (soft) and 2–12 keV (hard) energy bands
- XMMSL_HR1_ERR (1E)
-
Statistical uncertainty on above
- XMMSL_RASS_DIST (1E)
-
Distance to nearest RASS source (arcsec)
- XMMSL_GAL_LONG (1D)
-
Galactic longitude of X-ray source (deg)
- XMMSL_GAL_LAT (1D)
-
Galactic latitude of X-ray source (deg)
- XMMSL_LOGGALNH (1E)
-
Logarithm of Galactic column density in direction of X-ray source (log)
- XMMSL_ALLW_DIST (1D)
-
Distance between X-ray position and position of best AllWISE counterpart (arcsec)
- XMMSL_ALLW_BIAS (1D)
-
Bayesian prior (or bias) factor, , of the best AllWISE counterpart, derived from its location in -- parameter space
- XMMSL_ALLW_BFPOST (1D)
-
Bayesian posterior probability of the best X-rayAllWISE association, before considering bias factor
- XMMSL_ALLW_POST (1D)
-
Bayesian posterior probability of the best X-rayAllWISE association, including the bias factor
- ALLW_ra (1D)
-
See section E.1
- ALLW_dec (1D)
-
See section E.1
- ALLW_sigra (1E)
-
See section E.1
- ALLW_sigdec (1E)
-
See section E.1
- ALLW_w1mpro (1E)
-
See section E.1
- ALLW_w1sigmpro (1E)
-
See section E.1
- ALLW_w2mpro (1E)
-
See section E.1
- ALLW_w2sigmpro (1E)
-
See section E.1
- ALLW_w3mpro (1E)
-
See section E.1
- ALLW_w3sigmpro (1E)
-
See section E.1
- ALLW_w4mpro (1E)
-
See section E.1
- ALLW_w4sigmpro (1E)
-
See section E.1
- ALLW_W1_W2 (1D)
-
See section E.1
- ALLW_cc_flags (4A)
-
See section E.1
- ALLW_r_2mass (1E)
-
See section E.1
- ALLW_pa_2mass (1E)
-
See section E.1
- ALLW_n_2mass (1J)
-
See section E.1
- ALLW_j_m_2mass (1E)
-
See section E.1
- ALLW_j_msig_2mass (1E)
-
See section E.1
- ALLW_h_m_2mass (1E)
-
See section E.1
- ALLW_h_msig_2mass (1E)
-
See section E.1
- ALLW_k_m_2mass (1E)
-
See section E.1
- ALLW_k_msig_2mass (1E)
-
See section E.1
- SDSS_RUN (1J)
-
See section E.1
- SDSS_RERUN (3A)
-
See section E.1
- SDSS_CAMCOL (1J)
-
See section E.1
- SDSS_FIELD (1J)
-
See section E.1
- SDSS_ID (1J)
-
See section E.1
- SDSS_RA (1D)
-
See section E.1
- SDSS_DEC (1D)
-
See section E.1
- SDSS_MODELMAG_u (1E)
-
See section E.1
- SDSS_MODELMAG_g (1E)
-
See section E.1
- SDSS_MODELMAG_r (1E)
-
See section E.1
- SDSS_MODELMAG_i (1E)
-
See section E.1
- SDSS_MODELMAG_z (1E)
-
See section E.1
- SDSS_FIBER2MAG_u (1E)
-
See section E.1
- SDSS_FIBER2MAG_g (1E)
-
See section E.1
- SDSS_FIBER2MAG_r (1E)
-
See section E.1
- SDSS_FIBER2MAG_i (1E)
-
See section E.1
- SDSS_FIBER2MAG_z (1E)
-
See section E.1
- DR12_SURVEY (6A)
-
See section E.1
- DR12_PLATE (1J)
-
See section E.1
- DR12_MJD (1J)
-
See section E.1
- DR12_FIBERID (1J)
-
See section E.1
- DR12_PLUG_RA (1D)
-
See section E.1
- DR12_PLUG_DEC (1D)
-
See section E.1
- DIST_PHOT_PLUG (1E)
-
See section E.1
- DR12_Z (1E)
-
See section E.1
- DR12_Z_ERR (1E)
-
See section E.1
- DR12_ZWARNING (1J)
-
See section E.1
- DR12_SN_MEDIAN_ALL (1E)
-
See section E.1
- DR12_RCHI2 (1E)
-
See section E.1
- DR12_CLASS (6A)
-
See section E.1
- DR12_SUBCLASS (21A)
-
See section E.1
- DR12_NSPECOBS (1J)
-
See section E.1
- DR12_RUN2D (6A)
-
See section E.1
- DR12_RUN1D (6A)
-
See section E.1
- DR7Q_MEMBER (1B)
-
See section E.1
- DR7Q_Z_VI (1E)
-
See section E.1
- DR12Q_MEMBER (1B)
-
See section E.1
- DR12Q_Z_VI (1E)
-
See section E.1
- DR12Q_CLASS_PERSON (1J)
-
See section E.1
- DR12Q_Z_CONF_PERSON (1J)
-
See section E.1
- DR12Q_ORIGIN (8A)
-
See section E.1
- A07_MEMBER (1B)
-
See section E.1
- A07_Z (1E)
-
See section E.1
- A07_CLASS (6A)
-
See section E.1
- A07_FXcor (1E)
-
See section E.1
- A07_logLX (1E)
-
See section E.1
- P10_MEMBER (1B)
-
See section E.1
- P10_Z (1E)
-
See section E.1
- P10_ZSP (1A)
-
See section E.1
- P10_CONF (1A)
-
See section E.1
- P10_Z_CONF (1J)
-
See section E.1
- D17_MEMBER (1B)
-
See section E.1
- D17_NINSPECTORS (1J)
-
See section E.1
- D17_Z (1E)
-
See section E.1
- D17_Z_CONF (1J)
-
See section E.1
- D17_CLASS (8A)
-
See section E.1
- D17_RECONCILED (1J)
-
See section E.1
- VI_BEST (7A)
-
See section E.1
- Z_BEST (1E)
-
See section E.1
- Z_CONF_BEST (1J)
-
See section E.1
- Z_DIFF (1E)
-
See section E.1
- CLASS_BEST (8A)
-
See section E.1
- DL_BEST (1E)
-
See section E.1
- XMMSL_LOGLX_FULL (1E)
-
Estimate of the X-ray luminosity (corrected for Galactic absorption) in the rest-frame 0.2–12 keV band (log)
- XMMSL_LOGLX_FULL_ERR (1E)
-
Statistical uncertainty on the X-ray luminosity in the rest-frame 0.2–12 keV band (log)
- XMMSL_LOGLX_SOFT (1E)
-
As above, but for the rest-frame 0.2–2 keV band
- XMMSL_LOGLX_SOFT_ERR (1E)
-
As above, but for the rest-frame 0.2–2 keV band
- XMMSL_LOGLX_HARD (1E)
-
As above, but for the rest-frame 2–12 keV band
- XMMSL_LOGLX_HARD_ERR (1E)
-
As above, but for the rest-frame 2–12 keV band
- XMMSL_LOGLX_05_2 (1E)
-
As above, but for the rest-frame 0.5–2 keV band
- XMMSL_LOGLX_05_2_ERR (1E)
-
As above, but for the rest-frame 0.5–2 keV band
- XMMSL_LOGLX_05_10 (1E)
-
As above, but for the rest-frame 0.5–10 keV band
- XMMSL_LOGLX_05_10_ERR (1E)
-
As above, but for the rest-frame 0.5–10 keV band
E.3 Catalogue of RASS sources (SPIDERS_RASS_AGN) to be targeted in eBOSS/TDSS/SPIDERS
See section 3.3 for a description of how this catalogue was created. The SPIDERS_RASS_AGN catalogue contains 9028 entries, with the following columns:
- RA (1D)
-
The Right Ascension of the SDSS-DR13 photometric counterpart to the X-ray source (deg, J2000; SDSS Collaboration et al., 2016)
- DEC (1D)
-
The Declination of the SDSS-DR13 photometric counterpart to the X-ray source (deg, J2000; SDSS Collaboration et al., 2016)
- FIBER2MAG (5E)
-
The ‘fiber magnitude’ of the optical counterpart to the X-ray source in the bands, assuming a 2 arcsec diameter fibre (mag, AB; SDSS Collaboration et al., 2016)
- RUN (1J)
-
Element of the standard five-part SDSS-DR13 source identification descriptor for the optical counterpart to the X-ray source (SDSS Collaboration et al., 2016)
- RERUN (3A)
-
see above
- CAMCOL (1J)
-
see above
- FIELD (1J)
-
see above
- ID (1J)
-
see above
- PRIORITY (1J)
-
Priority assigned to this target for the purposes of the eBOSS/TDSS/SPIDERS tiling process (0=highest priority, 99=lowest priority)
- XRAY_SRC_NAME (16A)
- XRAY_RA (1D)
- XRAY_DEC (1D)
- XRAY_RADEC_ERR (1E)
- XRAY_FLUX (1D)
-
The X-ray flux of the source (erg cm-2 s-1), corrected for Galactic absorption, in the 0.1–2.4 keV band (see section A.1)
- XRAY_DET_ML (1D)
- BAYES_POSTERIOR_PROB (1E)
-
The Bayesian posterior probability (Ppost) of the association between the X-ray and AllWISE source.
- ALLWISE_DESIGNATION (19A)
-
The source identifier for the AllWISE counterpart to the X-ray source (Cutri, 2013)
- ALLWISE_RA (1D)
-
The Right Ascension of the AllWISE counterpart to the X-ray source (deg, J2000; Cutri, 2013)
- ALLWISE_DEC (1D)
-
The Declination of the AllWISE counterpart to the X-ray source (deg, J2000; Cutri, 2013)
- ALLWISE_W2MPRO (1E)
-
The magnitude of the AllWISE counterpart to the X-ray source (mag, Vega; Cutri, 2013)
- ALLWISE_W1_W2 (1E)
-
The - colour of the AllWISE counterpart to the X-ray source (mag, Vega)
Note that this catalogue also formed part of the SDSS-DR13 data release, and can be downloaded from https://data.sdss.org/sas/dr13/eboss/spiders/target/spiderstargetAGN-SPIDERS_RASS_AGN-v2.1.fits.
E.4 Catalogue of XMMSL sources (SPIDERS_XMMSL_AGN) to be targeted in eBOSS/TDSS/SPIDERS
See section 3.4 for a description of how this catalogue was created. The SPIDERS_XMMSL_AGN catalogue contains 873 entries, with the following columns:
- RA (1D)
-
See section E.3
- DEC (1D)
-
See section E.3
- FIBER2MAG (5E)
-
See section E.3
- RUN (1J)
-
See section E.3
- RERUN (3A)
-
See section E.3
- CAMCOL (1J)
-
See section E.3
- FIELD (1J)
-
See section E.3
- ID (1J)
-
See section E.3
- PRIORITY (1J)
-
See section E.3
- XRAY_SRC_NAME (24A)
-
Source identifier from the XMMSL catalogue (column UNIQUE_SRCNAME in official XMMSL catalogue)
- XRAY_OBSID (10A)
-
The XMM-Newton Observation Identifier of the observation in which this detection was made
- XRAY_RA (1D)
-
The Right Ascension of the X-ray source (deg, J2000)
- XRAY_DEC (1D)
-
The Declination of the X-ray source (deg, J2000)
- XRAY_RADEC_ERR (1E)
-
The positional uncertainty of the X-ray source (arcsec)
- BAYES_POSTERIOR_PROB (1E)
-
See section E.3
- ALLWISE_DESIGNATION (19A)
-
See section E.3
- ALLWISE_RA (1D)
-
See section E.3
- ALLWISE_DEC (1D)
-
See section E.3
- ALLWISE_W2MPRO (1E)
-
See section E.3
- ALLWISE_W1_W2 (1E)
-
See section E.3
- MISSING_IN_V3p1 (1B)
-
Set to 1 if this source was excluded in an earlier version of the catalogue (see section 2.2 for details)
Note that an older version of this catalogue (v3.1, containing 819 entries, see caveats in section 2.2) formed part of the SDSS-DR13 data release, and can be downloaded from https://data.sdss.org/sas/dr13/eboss/spiders/target/spiderstargetAGN-SPIDERS_XMMSL_AGN-v3.1.fits. The revised version of the catalogue presented here, which fixes these problems, is only available from the MPE X-ray surveys website: http://www.mpe.mpg.de/XraySurveys/SPIDERS/SPIDERS_AGN.
E.5 Catalogue of RASS sources targeted in SEQUELS
See section D for a description of how this catalogue was created. This catalogue contains 627 entries, with the following columns:
- RA (1D)
-
The Right Ascension of the SDSS-DR8 photometric counterpart to the X-ray source (deg, J2000; Aihara et al., 2011)
- DEC (1D)
-
The Declination of the SDSS-DR8 photometric counterpart to the X-ray source (deg, J2000; Aihara et al., 2011)
- FIBER2MAG (5E)
-
The ‘fiber magnitude’ of the optical counterpart to the X-ray source in the bands, assuming a 2 arcsec diameter fibre (mag, AB; Aihara et al., 2011)
- RUN (1J)
-
Element of the standard five-part SDSS-DR8 source identification descriptor for the optical counterpart to the X-ray source (Aihara et al., 2011)
- RERUN (3A)
-
see above
- CAMCOL (1J)
-
see above
- FIELD (1J)
-
see above
- ID (1J)
-
see above
- PRIORITY (1J)
-
See section E.3
- XRAY_SRC_NAME (16A)
-
See section E.3
- XRAY_RA (1D)
-
See section E.3
- XRAY_DEC (1D)
-
See section E.3
- XRAY_RADEC_ERR (1E)
-
See section E.3
- XRAY_FLUX (1D)
-
See section E.3
- XRAY_DET_ML (1D)
-
See section E.3
- BAYES_POSTERIOR_PROB (1E)
-
The Bayesian posterior probability (Ppost) of the association between the X-ray and optical source.
This catalogue formed part of the SDSS-DR13 data release, and so can also be downloaded from https://data.sdss.org/sas/dr13/eboss/spiders/target/spiderstargetSequelsAGN-SPIDERS_RASS_AGN-v1.1.fits.
E.6 Catalogue of bright X-ray sources used as an astrometric reference sample
For completeness, we provide here the astrometric reference catalogue of bright X-ray sources (from Chandra, XMM-Newton and Swift serendipitous catalogues) described in 4.1. This catalogue contains 4752 entries with the following columns:
- XBEST_CAT (5A)
-
A code (one of ‘CSC’, ‘3XMM’ or ‘SXPS’) identifying the catalogue from which the ‘best’ X-ray properties of this source were derived
- XBEST_RA (1D)
-
The ‘best’ X-ray determined Right Ascension of this source (deg, J2000)
- XBEST_DEC (1D)
-
The ‘best’ X-ray determined Declination of this source (deg, J2000)
- XBEST_FLUX_SOFT (1D)
-
An estimate of the X-ray flux in the ‘soft’ energy band (0.2–2 keV for CSC and 3XMM, 0.3-2 keV for 1SXPS; all with units erg cm-2 s-1)
- XBEST_FLUX_FULL (1D)
-
An estimate of the X-ray flux in the ‘full’ energy band (0.2–7 keV for CSC, 0.2–12 keV for 3XMM, and 0.3-10 keV for 1SXPS; all with units erg cm-2 s-1)
- XBEST_POSERR (1D)
-
The positional uncertainty in the form given by the parent catalogue (error ellipse half-major axis for CSC, 1 error radius for 3XMM, and 90 percent containment radius for 1SXPS; all with units of arcsec)
- CSC_name (20A)
-
Name of this source (if and) as it appears in the CSC catalogue (Evans et al., 2010)
- XMM_NAME (21A)
-
Name of this source (if and) as it appears in the 3XMM catalogue (Rosen et al., 2016)
- SXPS_Name (22A)
-
Name of this source (if and) as it appears in the 1SXPS catalogue (Evans et al., 2014)
- XBEST_NWISE (1J)
-
Number of potential AllWISE associations within the search radius (i.e. within 5 arcsec for CSC and 3XMM, and within 10 arcsec for 1SXPS)
- DIST_XBEST_ALLW (1D)
-
Distance from the best X-ray position to the nearest AllWISE counterpart (arcsec)
- ALLW_designation (20A)
-
The source identifier for the nearest AllWISE counterpart to the X-ray source (Cutri, 2013)
- ALLW_ra (1D)
-
The Right Ascension of the nearest AllWISE counterpart to the X-ray source (deg, J2000; Cutri, 2013)
- ALLW_dec (1D)
-
The Declination of the nearest AllWISE counterpart to the X-ray source (deg, J2000; Cutri, 2013)
- ALLW_w1mpro (1D)
-
The magnitude of the nearest AllWISE counterpart to the X-ray source (mag, Vega; Cutri, 2013)
- ALLW_w1sigmpro (1D)
-
The magnitude uncertainty of the nearest AllWISE counterpart to the X-ray source (mag, Vega; Cutri, 2013)
- ALLW_w2mpro (1D)
-
The magnitude of the nearest AllWISE counterpart to the X-ray source (mag, Vega; Cutri, 2013)
- ALLW_w2sigmpro (1D)
-
The magnitude uncertainty of the nearest AllWISE counterpart to the X-ray source (mag, Vega; Cutri, 2013)
- ALLW_W1_W2 (1D)
-
The magnitude uncertainty of the nearest AllWISE counterpart to the X-ray source (mag, Vega; Cutri, 2013)