On the Optical-to-Silicate Extinction Ratio as a Probe of the Dust Size in Active Galactic Nuclei
Abstract
Dust plays a central role in the unification theory of active galactic nuclei (AGNs). Whether the dust that forms the torus around an AGN is tenth micron-sized like interstellar grains or much larger has a profound impact on correcting for the obscuration of the dust torus to recover the intrinsic spectrum and luminosity of the AGN. Here we show that the ratio of the optical extinction in the visual band () to the optical depth of the 9.7 silicate absorption feature () could potentially be an effective probe of the dust size. The anomalously lower ratio of of AGNs compared to that of the Galactic diffuse interstellar medium of reveals that the dust in AGN torus could be substantially larger than the interstellar grains of the Milky Way and of the Small Magellanic Cloud, and therefore, one might expect a flat extinction curve for AGNs.
1 Introduction
Silicate dust is ubiquitously seen in a wide variety of astrophysical environments through the absorption or emission spectral features arising from the Si–O and O–Si–O vibrational modes (see Henning 2010). Interstellar silicate dust is of particular interest to astronomers, not only because it is a major dust species in the interstellar medium (ISM) and accounts for a substantial fraction of the observed optical extinction, but also because it is the raw material for building the obscuring torus around active galactic nuclei (AGNs; see Siebenmorgen & Krügel 2007) and the planet-forming disks around young stars (e.g., see Krügel & Siebenmorgen 1994). Since most of our knowledge about interstellar dust is inferred from its interaction with the electromagnetic radiation, the size of the dust is a key parameter in characterizing the properties of the dust (see Li 2009). While the characteristic size of interstellar silicate dust is around 0.1,111This characteristic size of 0.1 is inferred from the interstellar visual extinction. According to light scattering theory, dust grains of sizes comparable to the wavelength () of the incident light absorb and scatter photons most effectively (i.e., , where is the spherical radius of the grain; see Li 2009). With for the visual band, one obtains . the sizes of the silicate dust grains in the torus around AGNs and in protoplanetary disks around young stars are less clear. The predominant presence of larger grains in AGN torus or protoplanetary disks than their interstellar counterpart has important astrophysical implications. For protoplanetary disks, large grains imply the occurrence of grain growth, the first step toward planet formation. For AGN torus, larger grains indicate a smaller amount of extinction (on a per unit dust mass basis) and a flatter extinction curve in the ultraviolet (UV) and optical wavelength range.
In the diffuse ISM, the Si–O and O–Si–O stretching features occur at 9.7 and 18, respectively, and are seen in absorption (e.g., see Siebenmorgen et al. 2014). These features are smooth and lack fine structures, indicating a predominantly amorphous composition (Li & Draine 2001, Kemper et al. 2004, Li et al. 2007). In protoplanetary disks, the 9.7 Si–O feature, usually seen in emission, is often broader than the interstellar absorption feature. This is commonly interpreted as grain growth. Another piece of observational evidence for grain growth in protoplanetary disks comes from the far infrared (IR) to submillimeter opacity spectral index which is often flatter than its interstellar counterpart (see Draine 2006).
For AGNs, the situation is more complicated. The unification theory of AGNs assumes that all AGNs are surrounded by an anisotropic dusty torus and are essentially the same objects but viewed from different angles (Antonucci 1993, Urry & Padovani 1995). According to this theory, type 1 AGNs are viewed face-on and unobscured, while type 2 AGNs are viewed edge-on and the central regions, including the black hole, accretion disk and broad line region, are obscured. For type 1 AGNs, the Si–O stretching feature is mostly seen in emission (Hao et al. 2005, Siebenmorgen et al. 2005, Sturm et al. 2005), as expected from the unification theory. The peak wavelength of this feature often appreciably shifts from the canonical wavelength of 9.7 to longer wavelengths beyond 10. While Li et al. (2008) and Smith et al. (2010) attributed this longward wavelength shift of the “9.7” Si–O emission feature to m-sized silicate grains, Nikutta et al. (2009) argued that, in the framework of a clumpy dust torus, a mixture of sub-m-sized interstellar silicate and graphite grains can explain the observed longward wavelength shift of the silicate emission feature. They suggested that the longward wavelength shift could just be caused by radiation transfer effects. Similarly, Siebenmorgen et al. (2005, 2015) also found that their self-consistent two-phase AGN torus model could closely explain the observed wavelength shift of the “9.7” Si–O feature entirely in terms of radiative transfer effects.
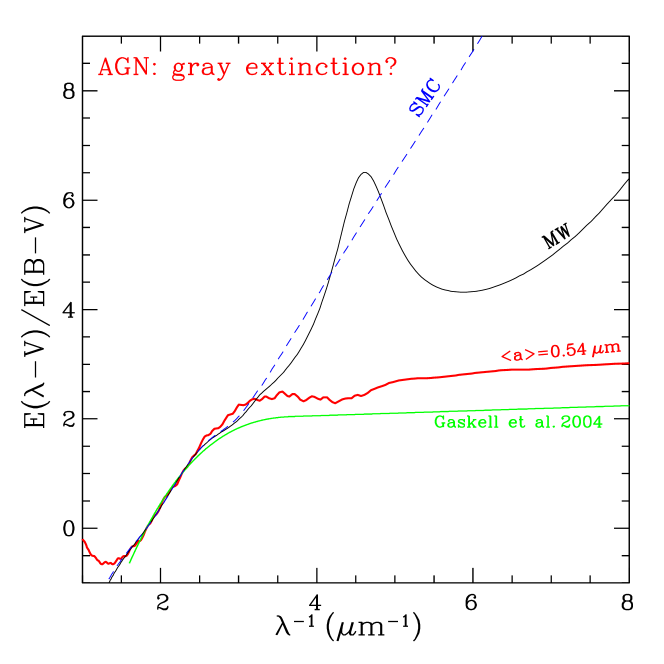
Whether the dust in the AGN torus is sub-m-sized like its precursor (i.e., interstellar grains) or much larger like that in protoplanetary disks has important impact on correcting for the dust extinction to recover the intrinsic spectra and luminosity of AGNs. If the AGN dust is interstellar-sized or smaller, one would expect an extinction curve like that of the Milky Way or the Small Magellanic Cloud (SMC) of which the extinction steeply rises with the increase of , the inverse wavelength. In contrast, if the AGN dust is m-sized, one would then expect a flat or gray extinction curve which exhibits little variation with wavelength (e.g., see Figure 7 in Xie et al. 2017). Numerous efforts have been made to deduce the AGN torus extinction curve but lead to contradicting results (see Li 2007 for a review). In the literature, the AGN extinction curves are mainly inferred from (1) composite quasar spectra, and (2) individual reddened AGNs. The former often reveals a “gray” extinction, implying that the size distribution of the dust in the AGN circumnuclear environments is skewed toward substantially large grains (e.g., see Gaskell et al. 2004, Czerny et al. 2004, Gaskell & Benker 2007). The latter often suggests a steeply-rising SMC-like extinction, indicating a preponderance of small grains near the nucleus (e.g., see Richard et al. 2003, Hopkins et al. 2004, Glikman et al. 2012). However, Siebenmorgen et al. (2015) argued that the AGN extinction curve is not necessarily a telltale of the dust size since there is no direct one-to-one link between the observed (or apparent) extinction curve of AGNs and the wavelength-dependence of the total dust cross sections. The latter is required to determine the dust size.
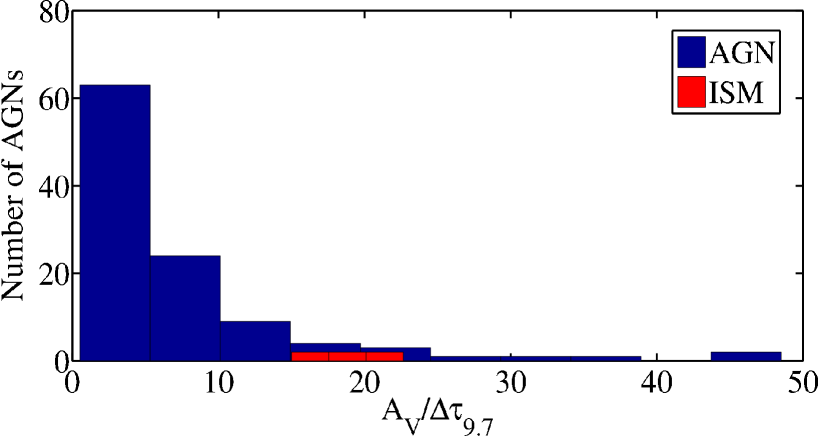
In this work we propose an alternative diagnosis of the dust size in AGN torus, based on , the ratio of the visual extinction to the 9.7 silicate absorption optical depth . Roche & Aitken (1984) determined for the solar neighbourhood diffuse ISM from six bright WC8 or WC9 Wolf-Rayet stars which suffer a visual extinction in the range of . The extinction to these stars was found to be dominantly interstellar origin with little extinction from their circumstellar shells. In contrast, Lyu et al. (2014) derived for 110 type 2 AGNs from the Balmer decrement measured with the Sloan Digital Sky Survey (SDSS) and from the 9.7 absorption spectra measured with the Spitzer/Infrared Spectrograph (IRS). As shown in Figure 1, although the ratio of the AGN sample of Lyu et al. (2014) exhibits a much larger scatter than that of the ISM sample of Roche & Aitken (1984), it is apparent that the majority of the AGN sample has an ratio much smaller than that of the diffuse ISM. Here we will show that, compared to the local ISM’s mean ratio of (Roche & Aitken 1984), the anomalously low ratio of derived for 110 type 2 AGNs (Lyu et al. 2014) implies that the dust in AGN torus is substantially larger than the interstellar grains of the Milky Way and of the SMC. This is independent of the exact dust shape and composition, as demonstrated in §2. We will discuss in §3 the role of carbon dust and the resulting flat extinction curve for AGNs and summarize the major results in §4. We will focus on type 2 AGNs as in type 1 AGNs and protoplanetary disks the 9.7 silicate feature is often seen in emission.
2 as a Probe of Dust Size
We first consider spherical grains of radii and of “astronomical silicate” composition (Draine & Lee 1984). We use Mie theory to calculate its extinction cross section at wavelength . The ratio of to the 9.7 silicate absorption depth is
| (1) |
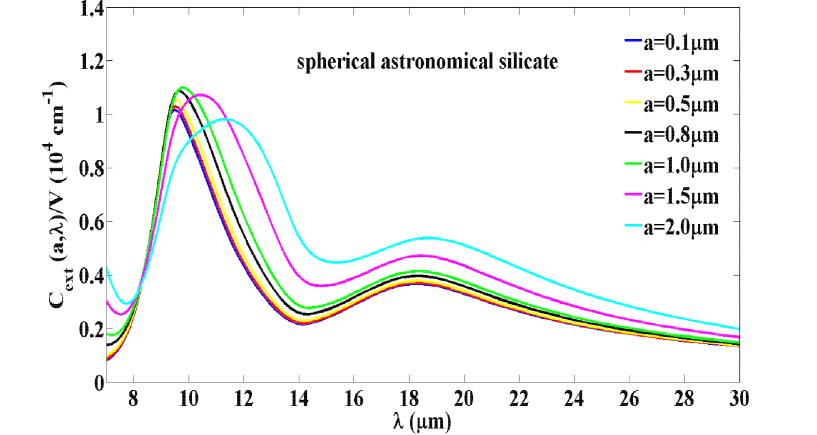
where is the extinction cross section at the visual band (i.e., ), and is the continuum-subtracted excess cross section of the 9.7 silicate feature. In Figure 2 we show the extinction cross sections of spherical “astronomical silicate” of various sizes in the wavelength range of the 9.7 and 18 silicate features. On a per unit volume basis, we see that the extinction profiles are almost identical for , implying that grains of are in the Rayleigh regime (i.e., ). For grains of , the 9.7 Si–O absorption feature becomes appreciably broader and its peak wavelength () shifts to longer wavelength, e.g., red-ward shifts from 9.5 for to 11.4 for , while the full-width-half-maximum (FWHM) of this feature increases from 2.59 to 5.50. We note that the red-ward wavelength shift of and the FWHM-broadening due to grain-size increase naturally explains what have been observed in AGNs, e.g., Hao et al. (2005) found that the “9.7” silicate emission feature of the luminous quasar 3C 273 peaks at 11; Sturm et al. (2005) and Smith et al. (2010) detected similar phenomena in the low luminosity AGN NGC 3998 and the nucleus of M81, respectively.
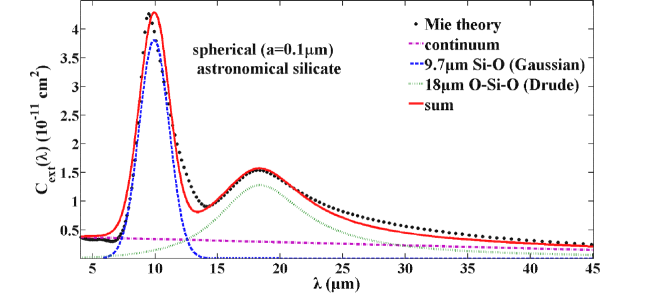
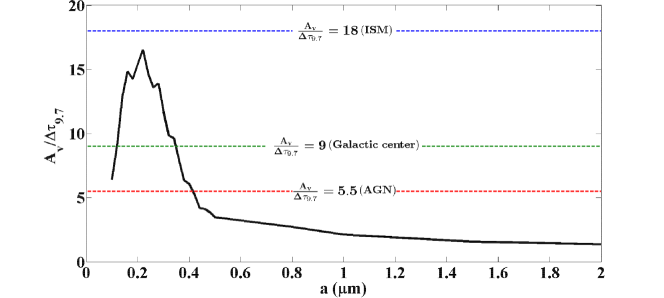
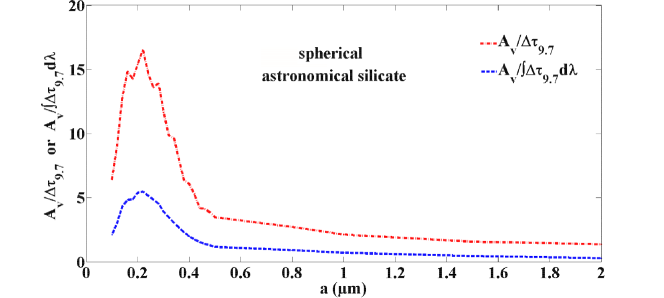
To subtract the continuum underneath the 9.7 and 18 silicate features, we fit these two features with parameterized functions together with an underlying linear continuum. As demonstrated in Figure 3, it turns out that a Gaussian profile better fits the 9.7 feature while a Drude profile fits the 18 feature better. In Figure 4 we show the ratio of the visual extinction to the continuum-subtracted 9.7 optical depth as a function of grain size, calculated from spherical “astronomical silicate” grains. It is seen that first rapidly increases with before it reaches a peak value of 16.5 at , then it quickly decreases with till , and finally, at , the decrease of with becomes more gradual. For the AGN ratio of (Lyu et al. 2014), from Figure 4 one derives the dust size to be 0.42.222Although it appears that one could also achieve with , we note that it is unlikely for such small grains to survive in the hostile circumnuclear environments around AGNs (e.g., see Siebenmorgen et al. 2004). The spectroscopic studies of the 9.7 silicate feature of AGNs all point to dust much larger than 0.1 (e.g., see Li et al. 2008, Köhler & Li 2010, Smith et al. 2010, Xie et al. 2017). We note that, as will be shown in §3, this size of is a lower limit since silicate dust is not the sole contributor to the optical extinction.
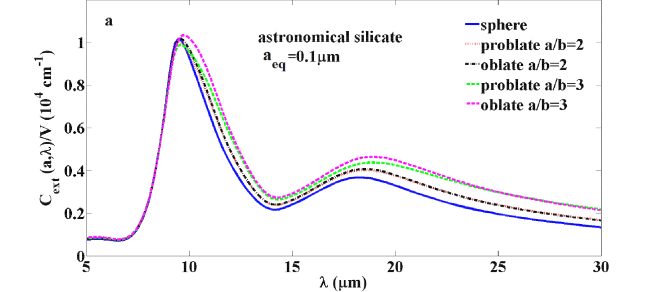
So far, we have assumed the dust to be spherical. It is well recognized that interstellar grains, the precursor of the dust grains in AGN torus, are nonspherical as revealed by the detection of interstellar polarization (e.g., see Siebenmorgen et al. 2014). To examine the effects of grain shape on , we consider spheroidal grains. Let and respectively be the semiaxis along and perpendicular to the symmetry axis of a spheroidal grain. Let be the radius of the equal-volume sphere. We consider prolates of and oblates of . In Figure 5a we show the extinction cross sections calculated from the Rayleigh scattering approximation (Bohren & Huffman 1983) for these spheroids of and of “astronomical silicate” composition. It is seen in Figure 5a that the extinction profiles of spheroidal grains do not differ substantially from that of spherical grains, except for more elongated grains, the red wing of the 9.7 feature becomes broader and the overall extinction level of the 18 feature becomes higher. We have also explored the variation of with for spheroidal grains.333At the wavelength range of the 9.7 and 18 silicate features, the Rayleigh scattering approximation is valid for (see Figure 2). For the visual band, the Rayleigh approximation is not valid for . We therefore calculate with Mie theory from their equal-volume spheres. As shown in Figure 5b, the results are closely similar to that of spherical grains: peaks at and for the AGN ratio of one derives . This demonstrates that grain shapes do not appreciably affect .
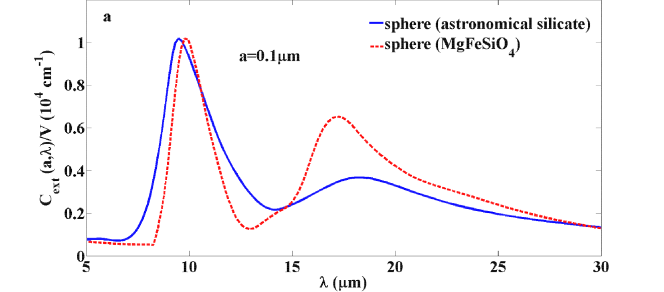
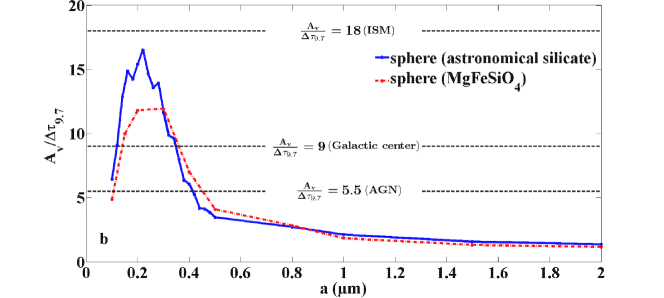
We have also investigated the effects of silicate composition on by considering the dielectric functions of amorphous olivine MgFeSiO4 experimentally measured by Dorschner et al. (1995). As shown in Figure 6a, compared to that of “astronomical silicate”, the 9.7 Si–O feature of spherical amorphous olivine of peaks at a longer wavelength and is considerably narrower, also, the 18 O–Si–O feature is substantially stronger. In Figure 6b we show the variation of with the dust size . Compared with that of “astronomical silicate”, although the peak ratio of of amorphous olivine is somewhat lower, the overall profile of of amorphous olivine resembles that of “astronomical silicate”, particularly, for amorphous olivine, one also requires the dust size to be 0.4 in order for the calculated to agree with that of AGNs (i.e., , Lyu et al. 2014). This demonstrates that the exact silicate composition does not considerably affect .
3 Discussion
In §2 we have shown that the observed AGN ratio of (Lyu et al. 2014) implies a dust size of , substantially exceeding the characteristic size of 0.1 of interstellar grains. This conclusion was derived from pure silicate dust. As amorphous silicate and some sorts of carbonaceous dust are the major dust species of the diffuse ISM (e.g., see Mishra & Li 2015, Siebenmorgen et al. 2014), one naturally expects both silicate dust and carbon dust (e.g., graphite, amorphous carbon) to be present in the dust torus around AGNs. Indeed, the 3.4 absorption feature, commonly attributed to the C–H stretching mode in saturated aliphatic hydrocarbon dust, is seen in AGNs (Wright et al. 1996, Imanishi et al. 1997). Mason et al. (2004) argued that the 3.4 absorption feature at least in face-on Seyfert 2 galaxies arises in dust local to the active nucleus rather than in the diffuse ISM of the galaxy. Since carbon dust contributes to but not to , with carbon dust included one expects a higher ratio of for a given dust size, and therefore, the observed AGN ratio of would require the dust size to be even larger than that derived in §2 based on a pure silicate composition.
We now consider a mixture of spherical amorphous carbon and spherical “astronomical silicate” dust with a mass ratio of . We calculate and , the extinction cross sections of amorphous carbon grains and “astronomical silicate” grains in the visual band, from Mie theory using the dielectric functions of Rouleau & Martin (1991) for amorphous carbon and of Draine & Lee (1984) for “astronomical silicate”. Assuming that both the silicate dust component and the carbon dust component have the same size distribution, one derives from
| (2) |
where is the ratio of the visual extinction to the 9.7 silicate optical depth of the silicate dust component alone, and are respectively the mass densities of amorphous silicate and amorphous carbon.
Apparently, the observed ratio also provides information about , the carbon dust to silicate dust mass ratio:
| (3) |
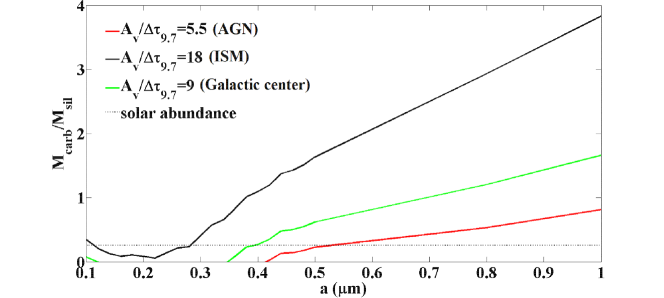
For a given dust size, we show in Figure 7 the maximum allowable for accounting for the observed ratio of AGNs. As expected, a larger ratio requires the presence of larger grains. With , the observed ratio of implies . Since it is unlikely for an AGN dust torus to only have silicate dust, we conclude that the dust size of is a lower limit.
If the AGN torus has a solar abundance for the dust-forming elements such as C, O, Mg, Si, and Fe (Asplund et al. 2009), one would obtain from
| (4) |
where is the interstellar C abundance (relative to H), is the gas-phase C abundance, , and are respectively the abundances of Fe, Mg and Si locked up in silicate dust of a stoichiometric composition of Mg2xFe2(1-x)SiO4 (i.e., each silicon atom corresponds to four oxygen atoms), and , , , and are respectively the atomic weights of C, Fe, Mg, Si and O. We adopt the solar abundance of parts per million (ppm), , , and (Asplund et al. 2009), and assume all Fe, Mg and Si elements are depleted in silicate dust (i.e., , , ). For C, subtracting the gas-phase abundance of (Cardelli et al. 1996), we are left with for the carbon dust component. With , one infers the dust size to be in order to account for the observed AGN ratio of (see Figure 7). Figure 7 also shows that a larger ratio (e.g., due to a lower gas-phase abundance [e.g., see Sofia et al. 2011]) would require a larger grain size.
We now calculate the extinction as a function of expected from a mixture of spherical “astronomical silicate” and spherical amorphous carbon of area-weighted mean radii and of a mass ratio of . We represent the extinction by , where , , and is the extinction at the band (i.e., ). To avoid the resonant structures expected to be pronounced in the extinction profiles of grains of a single size (see Bohren & Huffman 1983), we consider a MRN-type size distribution of (Mathis et al. 1977) in the size range of . This gives an area-weighted mean size of . As shown in Figure 8, the extinction curve predicted from such a mixture is flat or gray at (i.e., the extinction varies little with ) and closely agrees with that of Gaskell et al. (2004) who derived an AGN extinction curve based on the composite spectra of 72 radio quasars and 1018 radio-quiet AGNs. We note that Czerny et al. (2004) also constructed a featureless flat extinction curve for quasars based on the blue and red composite quasar spectra of Richards et al. (2003) obtained from the Sloan Digital Sky Survey (SDSS). The extinction curves of both the Milky Way and the Magellanic Clouds differ substantially from our model extinction curve as well as that of Gaskell et al. (2004) and Czerny et al. (2004) in that, the Galactic extinction curve shows a prominent extinction bump at 2175 and a steep far-UV rise which is believed to arise from small carbon grains (e.g., see Mishra & Li 2015). In contrast, the extinction curve of the SMC lacks the 2175 bump and displays an even steeper far-UV rise than that of the Milky Way.
Observationally, the predominant presence of large grains in AGN torus has also been indirectly inferred from the substantially reduced dust reddening- and extinction-to-gas ratios of AGNs: Maiolino et al. (2001a) determined for 19 AGNs the amount of reddening , , and , the hydrogen column densities. They found that for most (16 of 19) objects both and are significantly lower than that of the Galactic diffuse ISM by a factor ranging from a few to 100 (but also see Weingartner & Murray 2002). Maiolino et al. (2001b) ascribed the reduced and ratios of AGNs (often with a solar or higher metallicity) to grain growth through coagulation in the dense circumnuclear region which results in a dust size distribution biased in favour of large grains and therefore a flat extinction curve. We note that, this could also be caused by the preferential destruction of small grains in the hostile torus which is exposed to the energetic X-ray and far-UV photons from the central engine.
It is interesting to note that, as shown in Figures 4, 5b, 6b, silicate dust alone is not capable of explaining the observed ratio of of the local solar neighborhood diffuse ISM (Roche & Aitken 1984). This is true for both spherical and nonspherical grains and for both “astronomical silicate” and amorphous olivine compositions. With carbon dust included, is now achievable provided . For a solar abundance of , a mixture of silicate and carbon grains of sizes or result in (see Figure 7). We disregard the size of since the interstellar extinction curve constrains the mean dust size to be 0.1.444There may exist a population of very large grains in the ISM which substantially exceed 0.1 (e.g., see Grün et al. 1994, Block et al. 1994, Witt et al. 1994, Taylor et al. 1996, Witt et al. 2001, Wang et al. 2014, Westphal et al. 2014, Sterken et al. 2015, Wang et al. 2015a,b, Krelowski 2017). However, these grains are gray and do not show up in the UV/optical extinction curve. Also, they only account for 15% of the total dust mass in the ISM (e.g., see Wang et al. 2015a,b).
Within the Galaxy, not only the 9.7 silicate extinction profile but also the ratio vary among different sightlines. With (Roche & Aitken 1985), the optical-to-silicate extinction ratio of the line of sight toward the Galactic center differs from that of the local ISM by a factor of 2. Roche & Aitken (1985) suggested that the reduction of in the Galactic center may be caused by the fact that there are fewer carbon stars in the central regions of the Galaxy and therefore, the production of carbon-rich dust may be substantially reduced compared with the outer Galactic disk. However, Gao et al. (2010) argued against this hypothesis based on the fact that the 3.4 C–H feature of aliphatic hydrocarbon dust also exhibits a similar behavior: of the Galactic center also differs from that of the local ISM of by a factor of 2, where is the optical depth of the 3.4 aliphatic C–H absorption feature. If the hypothesis of Roche & Aitken (1985) was correct, one would expect a larger ratio in the Galactic center than that of the local ISM. We note that, along the lines of sight toward the Galactic center, there are dense molecular clouds.555The sightline toward the Galactic center source suffers about 30 of visual extinction (e.g. see McFadzean et al. 1989), to which molecular clouds may contribute as much as 10 (Whittet et al. 1997). In cold, dense molecular clouds, interstellar dust is expected to grow through coagulation (as well as accreting an ice mantle). Indeed, as shown in Figure 7, grains of are able to account for the observed ratio of . For a solar abundance of , a mixture of silicate and carbon grains of sizes lead to (see Figure 7).
Finally, we argue that may not be an accurate measure of the silicate absorption. Observationally, it is well recognized that the FWHM () of the 9.7 silicate absorption feature varies from one line of sight to another [e.g., 2.6 for the local diffuse ISM along the line of sight toward Cyg OB2 #12 (Whittet et al. 1997), 1.8 for the sightline toward the Galactic center object Sgr A⋆ (Kemper et al. 2004)]. Theoretically, the FWHM of the 9.7 silicate feature computed from Mie theory increases with the dust size (see Figure 2). We suggest that a more accurate measure of the silicate absorption would be , the integral of the continuum-subtracted 9.7 silicate absorption feature. Similarly, we obtain the visual extinction also by integrating over the Johnson -band filter response function. In Figure 9 we compare with . As expected, is not simply scaled from . We argue that, in future observational studies, it is more meaningful to determine than .
4 Summary
We have explored the possible diagnostic power of , the ratio of the optical extinction in the visual band to the optical depth of the 9.7 silicate absorption feature, in gaining insight into the size of the dust in AGNs, the local ISM, and the Galactic center. It is shown that, with , the dust in AGN torus could exceed 0.4 in radius, substantially larger than that of the Galactic diffuse ISM for which , and indicating a flat extinction curve for AGNs. Similarly, the dust associated with the Galactic center sightlines for which could also be considerably larger than that of the Galactic diffuse ISM, suggesting the coagulational growth of the dust in the molecular-cloud components along the lines of sight toward the Galactic center.
References
- Antonucci (1993) Antonucci, R. 1993, ARA&A, 31, 473
- Asplund et al. (2009) Asplund, M., Grevesse, N., Sauval, A. J., & Scott, P. 2009, ARA&A, 47, 481
- (3) Block, D. L., Witt, A. N., Grosbol, P., et al. 1994, A&A, 288, 383
- Bohren et al. (1983) Bohren, C.F., & Huffman, D. R. 1983, Absorption and Scattering of Light by Small Particles, Wiley, New York
- Cardelli et al. (1996) Cardelli, J. A., Meyer, D. M., Jura, M., & Savage, B. D. 1996, ApJ, 467, 334
- Czerny et al. (2004) Czerny, B., Li, J., Loska, Z., & Szczerba, R. 2004, MNRAS, 348, L54
- Dorschner et al. (1995) Dorschner, J., Begemann, B., Henning, T., Jaeger, C., & Mutschke, H. 1995, A&A, 300, 503
- Draine & Lee (1984) Draine, B.T., & Lee, H.M. 1984, ApJ, 318, 485
- Draine (2003) Draine, B.T. 2003, ARA&A, 41, 241
- Draine (2006) Draine, B. T. 2006, ApJ, 636, 1114
- Gao et al. (2010) Gao, J., Jiang, B. W., & Li, A. 2010, EP&S, 62, 63
- Gaskell et al. (2004) Gaskell, C.M., Goosmann, R.W., Antonucci, R.R.J., & Whysong, D.H. 2004, ApJ, 616, 147
- Gaskell et al. (2007) Gaskell, C.M., & Benker, A.J. 2007, arXiv:0711.1013
- Glikman et al. (2012) Glikman, E., Urrutia, T., Lacy, M., et al. 2012, ApJ, 757, 51
- (15) Grün, E., Gustafson, B., Mann, I., et al. 1994, A&A, 286, 915
- Hao et al. (2005) Hao, L., Spoon, H.W.W., Sloan, G.C., et al. 2005, ApJ, 625, L75
- Henning (2010) Henning, Th., 2010, ARA&A, 48, 21
- Hopkins et al. (2004) Hopkins, P. F., Strauss, M. A., Hall, P. B., et al. 2004, AJ, 128, 1112
- (19) Imanishi, M., Terada, H., Sugiyama, K., Motohara, K., Goto, M., & Maihara, T. 1997, PASJ, 49, 69
- Kemper et al. (2004) Kemper, F., Vriend, W. J., & Tielens, A. G. G. M. 2004, ApJ, 609, 826
- Köhler & Li (2010) Köhler, M., & Li, A. 2010, MNRAS, 406, L6
- (22) Krelowski, J. 2017, P&SS, in press
- Krügel & Siebenmorgen (1994) Krügel, E., & Siebenmorgen, R. 1994, A&A, 288, 929
- Li & Draine (2001) Li, A., & Draine, B. T. 2001, ApJ, 550, L213
- Li (2007) Li, A. 2007, in ASP Conf. Ser. 373, The Central Engine of Active Galactic Nuclei, ed. L. C. Ho, & J.-W. Wang (San Francisco, CA: ASP), 561
- (26) Li, A. 2009, in Small Bodies in Planetary Sciences (Lecture Notes in Physics vol. 758), ed. I. Mann, A. Nakamura, & T. Mukai, Springer, 167
- Li et al. (2007) Li, M. P., Zhao, G., & Li, A. 2007, MNRAS, 382, 26
- Li et al. (2008) Li, M. P., Shi, Q. J., & Li, A. 2008, MNRAS, 391, L49
- Lyu et al. (2014) Lyu, J.W., Hao, L., & Li, A. 2014, ApJ, 792, L9
- Maiolino et al. (2001a) Maiolino, R., Marconi, A., Salvati, M., et al. 2001a, A&A, 365, 28
- Maiolino et al. (2001b) Maiolino, R., Marconi, A., & Oliva, E. 2001b, A&A, 365, 37
- Mason et al. (2004) Mason, R.E., Wright, G.S., Pendleton, Y.J., & Adamson, A. 2004, ApJ, 613, 770
- Mathis et al. (1977) Mathis, J. S., Rumpl, W., & Nordsieck, K. H. 1977, ApJ, 217, 425
- McFadzean et al. (1989) McFadzean, A. D., Whittet, D. C. B., Bode, M. F., Adamson, A. J., & Longmore, A. J. 1989, MNRAS, 241, 873
- Mishra & Li (2015) Mishra, A., & Li, A. 2015, ApJ, 809, 120
- Nikutta et al. (2009) Nikutta, R., Elitzur, M., & Lacy, M. 2009, ApJ, 707, 1550
- Richards et al. (2003) Richards, G. T., Hall, P. B., Vanden Berk, D. E., et al. 2003, AJ, 126, 1131
- Roche et al. (1984) Roche, P. F., & Aitken, D.K. 1984, MNRAS, 208, 481
- Roche et al. (1985) Roche, P. F., & Aitken, D.K. 1985, MNRAS, 215, 425
- Rouleau & Martin (1991) Rouleau, F., & Martin, P. G. 1991, ApJ, 377 526
- Siebenmorgen et al. (2004) Siebenmorgen, R., Krügel, E., & Spoon, H. W. W. 2004, A&A, 414, 123
- Siebenmorgen et al. (2005) Siebenmorgen, R., Haas, M., Krügel, E., & Schulz, B. 2005, A&A, 436, L5
- Siebenmorgen & Krügel (2007) Siebenmorgen, R., & Krügel, E. 2007, A&A, 461, 445
- Siebenmorgen et al. (2014) Siebenmorgen, R., Voshchinnikov, N. V., & Bagnulo, S. 2014, A&A, 561, A82
- Siebenmorgen et al. (2015) Siebenmorgen, R., Heymann, F., & Efstathiou, A. 2015, A&A, 583, A120
- Smith et al. (2010) Smith, H. A., Li, A., Li, M. P., et al. 2010, ApJ, 716, 490
- (47) Sofia, U. J., Parvathi, V. S., Babu, B. R. S., & Murthy, J. 2011, AJ, 141, 22
- (48) Sterken, V. J., Strub, P., Krüger, H., et al. 2015, ApJ, 812, 140
- Sturm el at. (2005) Sturm, E., Schweitzer, M., Lutz, D., et al. 2005, ApJ, 629, L21
- (50) Taylor, A.D., Baggaley, W.J., & Steel, D.I., 1996, Nature, 380, 323
- Urry et al. (1995) Urry, C.M., & Padovani, P. 1995, PASP, 107, 803
- (52) Wang, S., Li, A., & Jiang, B. W. 2014, P&SS, 100, 32
- (53) Wang, S., Li, A., & Jiang, B. W. 2015a, ApJ, 811, 38
- (54) Wang, S., Li, A., & Jiang, B. W. 2015b, MNRAS, 454, 569
- Weingartner & Murray (2002) Weingartner, J. C., & Murray, N. 2002, ApJ, 580, 88
- (56) Westphal, A. J., Stroud, R. M., Bechtel, H. A., et al. 2014, Science, 345, 786
- Whittet et al. (1997) Whittet, D.C.B., Boogert, A.C.A., Gerakines, P.A. 1997, ApJ, 490, 729
- (58) Witt, A. N., Lindell, R. S., Block, D. L., & Evans, Rh. 1994, ApJ, 427, 227
- (59) Witt, A. N., Smith, R. K., & Dwek, E. 2001, ApJL, 510, L201
- (60) Wright, G.S., Bridger, A., Geballe, T.R., & Pendleton, Y. 1996, in New Extragalactic Perspectives in the New South Africa, ed. D. L. Block & J. M. Greenberg (Dordrecht: Kluwer), 143
- Xie et al. (2017) Xie, Y., Li, A., & Hao, L. 2017, ApJS, 228, 32