Study of the -decay of 100Tc with Total Absorption -Ray Spectroscopy
Abstract
The -decay of 100Tc has been studied using the Total Absorption -Ray Spectroscopy technique at IGISOL. In this work the new DTAS spectrometer in coincidence with a cylindrical plastic detector has been employed. The -intensity to the ground state obtained from the analysis is in good agreement with previous high-resolution measurements. However, differences in the feeding to the first excited state as well as weak feeding to a new level at high excitation energy have been deduced from this experiment. Theoretical calculations performed in the quasiparticle random-phase approximation (QRPA) framework are also reported. Comparison of these calculations with our measurement serves as a benchmark for calculations of the double -decay of 100Mo.
I Introduction
I.1 Motivation
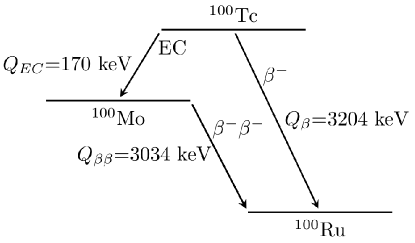
The study of double -decay processes is an interesting and challenging topic in nuclear and particle physics. It is amongst the rarest forms of radioactive decay and its occurrence has significant implications for the Standard Model of fundamental interactions. Double -decay is a radioactive decay process in which a nucleus with proton and neutron numbers undergoes a transition to the nucleus with . It can be observed for some nuclei, such as 100Mo, where the nucleus with atomic number higher by one unit (100Tc) has a smaller binding energy, and the single -decay is forbidden. If the nucleus with atomic number higher by two units, 100Ru, has a larger binding energy, then the double -decay process is allowed energetically Suhonen and Civitarese (1998) (and references therein).
With the exception of one unconfirmed case Klapdor-Kleingrothaus et al. (2001), double -decay has so far only been detected in the so-called two-neutrino mode, when two electron antineutrinos are emitted in addition to the two electrons. This process occurs whether or not neutrinos are their own antiparticles (whether or not they are Majorana particles). On the other hand, the neutrinoless case of the decay, that would violate lepton-number conservation, is considered one of the best candidates to provide information about the absolute neutrino mass scale and the Dirac or Majorana nature of the neutrino (see Avignone III et al. (2008); Vergados et al. (2012) for recent experimental and theoretical accounts of the subject). To extract this information one would need to determine experimentally the half-life of this very slow decay and estimate theoretically the phase-space factors and nuclear matrix elements (NME) implicit in the process.
Theoretical calculations of the NME for double -decay have been performed in the past using several approaches: the quasiparticle-random-phase-approximation (QRPA), the interacting shell model (ISM), the proton-neutron interacting boson model (IBA-2), the energy density functional approach (EDF) and the projected Hartree-Fock-Bogoliubov (HFB) mean-field scheme. A recent comparison of the different results can be found in the review Suhonen and Civitarese (2012a).
The calculations of the NME require a knowledge of the wave functions of the nuclear states involved. It has been suggested that it is possible to test the accuracy of the neutrinoless (0) double -decay calculations by comparing the two-neutrino (2) double -decay calculations (within the same theoretical frameworks) with measured 2 double -decay rates. In the QRPA calculations the parameters of the model can be determined not only by using the double -decay rates, but also using information on the single -decay rates (/EC, and ) for the intermediate nucleus. Precise data for the single decay of the associated intermediate nuclei of the double -decay process can help to fix the effective value of the axial vector coupling constant, , together with the value of the particle-particle strength, , within a QRPA framework. For this reason, improving our experimental knowledge of -decays, both double and single decays that are relevant to the neutrinoless double -decay calculations, should be considered to be of high priority. This is the main goal of the present work: an improved study of the single -decay 100Tc 100Ru to provide experimental constraints on nuclear-model calculations of the double -decay of 100Mo.
It should also be noted that constraining the parameters of the calculations is not just possible by means of -decay studies. In recent years a great effort has also been invested in studies of the properties of ground-state wave functions of double -decay candidates. For example, the occupancies of valence single-particle orbitals and pairing correlations of the states of interest have been measured by means of transfer reactions (see for example Freeman and Schiffer (2012); Thomas et al. (2012)).
One of the best known double -decay systems is the A=100 system shown in Figure 1 (100Mo, 100Tc, 100Ru) Hirsch et al. (1995); Barabash et al. (1998); Civitarese et al. (2003, 1998, 1999). Double -decay rates to the ground state and to the first excited state of 100Ru Arnold et al. (2007) have been measured in the NEMO 3 experiment Arnold et al. (2005). The EC branch of the decay 100Tc 100Mo has been measured recently with much higher precision than before Sjue et al. (2008). Also in a recent measurement using charge-exchange reactions the 100Ru 100Tc transitions have been measured, indicating the nature of the single-state dominance in the double -decay process Abad et al. (1984); Civitarese et al. (2003). On the other hand, the decay of 100Tc 100Ru has only been measured using the high-resolution -ray spectroscopy technique Furutaka et al. (2001); Berzins et al. (1969) and the present work is the first measurement of this decay employing the total absorption -ray spectroscopy technique.
100Mo has been used along with other isotopes for the 0 double -decay search in the NEMO 3 experiment, mentioned already. This experiment uses a tracking device and a calorimeter to measure different samples of double -decay isotopes. Apart from NEMO 3, there are two experiments based on 100Mo to search for the 0 decay. One is AMoRE (Advanced Mo based Rare process Experiment) Bhang et al. (2012) based on 40Ca100MoO4 scintillator crystals. The other is MOON (Mo/Majorana Observatory Of Neutrinos) Fushimi et al. (2010), that uses a 100Mo sheet inserted between two NaI(Tl) detectors. Both experiments exploit the reasonable cost of enrichment in 100Mo and the large that make this isotope attractive for double -decay studies.
The decay of 100Tc 100Ru has also recently attracted attention in the framework of a different neutrino related topic Huber and Jaffke (2016). This decay has been identified as an important contributor to a new type of flux-dependent correction to the antineutrino spectrum produced in nuclear reactors. This correction takes into account the contribution of the -decay of nuclides that are produced by neutron capture of long-lived fission products. The correction is non-linear in neutron flux, because the process depends on a fission process to produce the fission product (99Tc) followed by a neutron capture. For that reason, a better knowledge of the individual branches of this decay can also contribute to a better determination of this correction, of interest for neutrino-oscillation experiments.
The study of this decay is also of interest from the point of view of nuclear structure. 100Tc lies in a region of the nuclear chart, where shape effects and shape transitions could play an important role in the evolution of the nuclear structure Moller et al. (2006) and hence in -decay rates. The total absorption technique has been used to study shape effects in the parent nucleus, based on the measured (GT) strength distribution in the daughter Nácher et al. (2004); Poirier et al. (2004); Pérez-Cerdán et al. (2013); Estévez Aguado et al. (2015); Briz et al. (2015).
I.2 Total Absorption Spectroscopy
As already mentioned in the introduction, the -rays emitted in the decay of 100Tc 100Ru have only been measured with HPGe detectors. In such conventional high-resolution experiments, intensity to states at high excitation in the daughter nucleus may remain undetected due to the relatively poor efficiency of the HPGe detectors used. This experimental problem, the so-called Pandemonium effect (Hardy et al., 1977), can be avoided with the Total Absorption -ray Spectroscopy (TAGS) technique. Experiments performed in the past at GSI, ISOLDE and Jyväskylä using this technique have confirmed its potential Algora et al. (2004); Nácher et al. (2016); Jordan et al. (2013); Briz et al. (2015); Nácher et al. (2004); Estévez Aguado et al. (2015); Pérez-Cerdán et al. (2013); Poirier et al. (2004); Algora et al. (2010); Tain et al. (2015a). Moreover, methods were developed by the Valencia group to extract precise intensities from the data Tain and Cano-Ott (2007a); Cano-Ott et al. (1999a, b); Tain and Cano-Ott (2007b). Looking for possible weak branches that remained undetected in high-resolution studies is the reason why we considered measuring the -decay of 100Tc 100Ru with the TAGS technique. This could improve the experimental constraints on nuclear models used in double -decay calculations for the A=100 system.
II Experiment
The measurement of the 100Tc 100Ru decay was performed at the upgraded IGISOL IV facility of the University of Jyväskylä (Finland) (Moore et al., 2013) in February 2014. For this experiment, the new Decay Total Absorption -ray Spectrometer (DTAS) (Tain et al., 2015b), made of NaI(Tl) crystals, was used in the eighteen-module configuration (Guadilla et al., 2016). The 100Tc nuclei were produced from a Mo target (97.42 enrichment of 100Mo) by means of a (p,n) reaction with protons of 10 MeV from the MCC30 cyclotron that were slowed down to 8 MeV with a degrader to maximize the reaction yield.
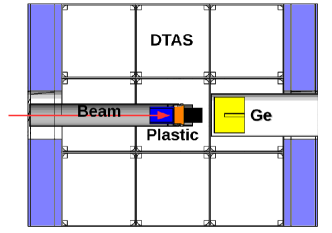
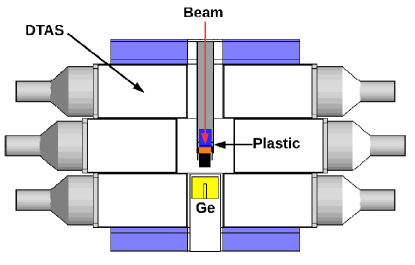
Since 100Tc decays to a stable daughter nucleus, there was no need to remove activity after implantation to eliminate the contamination from the descendants. Accordingly, after the purification in the JYFLTRAP double Penning trap Eronen et al. (2012) the activity was implanted directly at the bottom of a plastic -detector, which has a vase-shaped geometry Guadilla et al. (2017). This detector was placed at the centre of the DTAS detector system. The DTAS spectrometer was surrounded by shielding composed of stainless steel sheets, lead bricks and aluminium, which served to reduce the background counting rate by one order-of-magnitude. The set-up was completed with a HPGe detector placed behind the plastic detector, as shown in the schematic view of Figure 2.
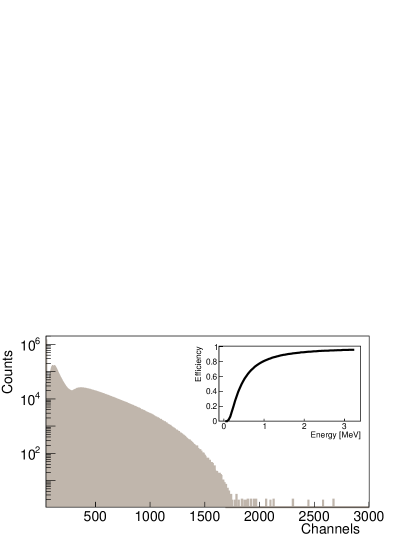
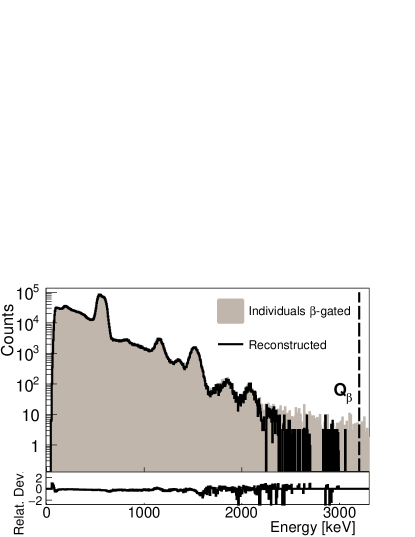
The total absorption signal of the DTAS detector was reconstructed offline by summing the signals from the eighteen individual modules and applying a method to correct possible changes in the photomultiplier gain based on an external reference detector, as described in Guadilla et al. . In our analog-to-digital converter (ADC) the spectrum of each individual module covered a range of 15 MeV with a threshold of 90 keV. The resulting software sum for the total 21 hours of measuring time is presented as the black line in Figure 3, and it is dominated by the background. In particular, the characteristic peaks at 1460.8 keV (40K) and at 2614.5 keV (208Tl) can be clearly seen, as well as the neutron capture peak in the 127I of the NaI(Tl) crystals at around 6.83 MeV.
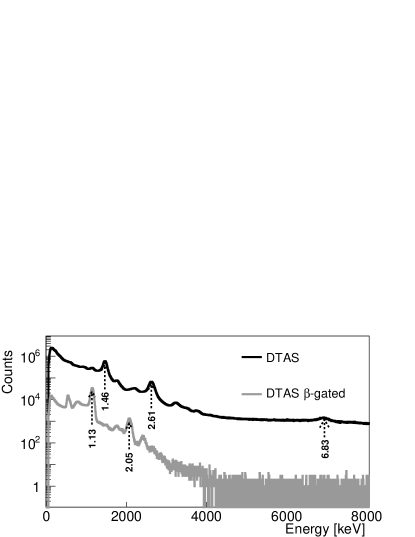
In order to clean the spectrum and select only those events coming from the -decay, coincidences with particles were required, as shown by the grey line in Figure 3. For this purpose we used a vase-shaped plastic detector Guadilla et al. (2017) of 35 mm external diameter and 50 mm length with 3 mm thickness in the lateral walls and in the bottom. The plastic detector was covered internally by a thin aluminized-mylar reflector in order to improve the light collection. The spectrum and the efficiency curve calculated with Monte Carlo (MC) simulations are shown in Figure 4. Due to the geometry of this detector, a careful characterization with MC simulations using optical photons was needed in order to understand and reproduce the shape of the resulting spectra and calculate accurately the dependence of the -efficiency as a function of the -end point energy Guadilla et al. (2017). The amount of light collected from the lateral walls was shown to be smaller than the light collected from the bottom, thus producing the bump at the beginning of the spectrum shown in Figure 4. The higher part of the light distribution above this bump is essentially due to interactions in the bottom of the detector. Two different energy thresholds were identified depending on the point where energy is deposited in the detector: 30 keV for the bottom and 100 keV for the lateral walls (see reference Guadilla et al. (2017) for more details).
III Analysis and results
The analysis was performed with the experimental -gated spectrum shown in Figure 3. The -intensity distribution was obtained with a de-convolution method using the spectrometer response to the decay Tain and Cano-Ott (2007a), to solve the inverse problem represented by:
| (1) |
where is the number of counts in channel of the spectrum, is the number of events that fed level in the daughter nucleus, is the contribution of all contaminants to channel , and is the response function of the detector that represents the probability that feeding to the level gives a count in channel of the experimental spectrum. This response function is calculated by means of MC simulations, and it is unique for each detector and each decay scheme Tain and Cano-Ott (2007a). In particular, it depends on the de-exciting branching ratio matrix of the levels in the daughter nucleus. The calculation of the branching ratio matrix is based partially on the known decay information for the levels at low excitation, that is taken from the literature, assuming that they are well known from high-resolution measurements. According to the Reference Input Parameter Library (RIPL-3) Capote et al. (2009), the level scheme of 100Ru is complete up to a level at 3.072 MeV. Accordingly our first choice for the known level scheme includes all levels up to this level. A second choice was to consider all levels up to the level at 2.387 MeV, the last level with a known spin-parity assignment seen in -decay Furutaka et al. (2001); Berzins et al. (1969). From the last known level included up to =3.204 MeV, a continuum region with 40 keV bins is defined with branching ratios based on the statistical model Tain and Cano-Ott (2007b). This complements the decay scheme in the energy window of the -decay. All parameters used for the statistical model calculation are extracted from RIPL-3 Capote et al. (2009) and summarized in Table 1, with Photon Strength Function (PSF) and deformation parameters based on Kopecky and Uhl (1990) and Raman et al. (2001a), respectively. The level density parameter “a” at the neutron binding energy is obtained from Enhanced Generalized Superfluid Model (EGSM) calculations. The Hartree-Fock-Bogoliubov (HFB) plus combinatorial nuclear level density Goriely et al. (2008, 2007) has been used, with C and P correction parameters of 0.01596 and 0.33071, respectively.
| Level-density parameter | Deformation parameter | Photon strength function parameters | ||||||||
|---|---|---|---|---|---|---|---|---|---|---|
| E1 | M1 | E2 | ||||||||
| a | E | E | E | |||||||
| [MeV] | [MeV] | [mb] | [MeV] | [MeV] | [mb] | [MeV] | [MeV] | [mb] | ||
| 8.4341 | 0.2148 | 14.531 17.416 | 4.201 5.926 | 78.421 111.167 | 8.847 | 4.000 | 2.277 | 13.594 | 4.910 | 2.358 |
Once the branching ratio matrix is constructed, the response function can be calculated recursively from mono-energetic -ray MC responses, folded with the response to the continuum for each level Cano-Ott et al. (1999a). For the simulations we use the Geant4 package Agostinelli et al. (2003), using a detailed description of the geometry of the set-up (the DTAS spectrometer, the ancillary detectors and the beam pipe). Moreover, the MC simulations include the non-proportionality of the light yield in NaI(Tl) in the form described in Cano-Ott et al. (1999a). The inclusion of this process has been shown to be crucial Cano-Ott et al. (1999a); Guadilla et al. in the analysis of TAS data obtained with spectrometers made of this material. The Geant4 MC simulations were validated for this geometry by comparison with measurements of well-known radioactive sources (24Na, 60Co, 137Cs, 22Na, and 152Eu-133Ba) Guadilla et al. .
In addition, we investigated the sensitivity of the -detector to -rays. This can introduce distortions in the -gated TAGS spectrum. For a realistic estimation, we made a MC simulation with decay cascades generated with the DECAYGEN event generator Tain and Cano-Ott (2007b). As input to this event generator we use the branching ratio matrix and the intensity distribution from our analysis. The output consists of an event file where the primaries are labelled and can be identified. By simulating the -particles and -rays from the event file, and comparing with a simulation with only -particles, we deduced that around of the counts in the total simulation for the 100Tc are coming from the interaction of -rays with our plastic detector, which represents a negligible distortion.
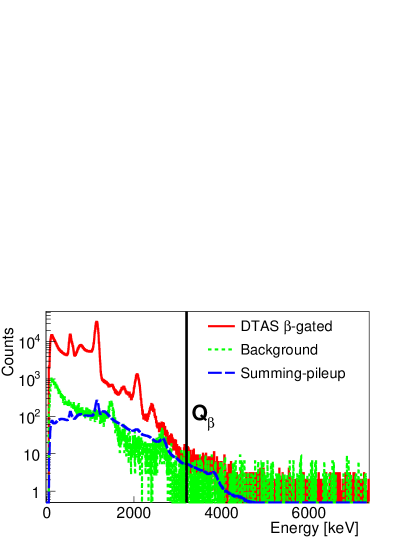
In a TAGS analysis it is crucial to identify all the sources of contamination. In this case, although we are considering coincidences with the detector, the large ground state feeding intensity of this decay, which is around 90 as we shall see later, together with the high efficiency of the TAS gives rise to a non-negligible number of random coincidences of the -particles with the environmental background in DTAS. This dominates the DTAS spectrum if no coincidence conditions are imposed, as shown in Figure 3. The contribution of this contamination was obtained using the two main peaks at 1460.8 keV and at 2614.5 keV that were mentioned earlier. Apart from the environmental background, we have to consider the contribution of the summing-pileup of signals. To deal with this we follow the procedure explained in Guadilla et al. that has already been applied successfully in previous works Tain et al. (2015a); Zakari-Issoufou et al. (2015); Valencia et al. (2017). It is based on the random superposition of two stored events within the ADC gate length. This contribution is normalized with a theoretical expression based on Cano-Ott et al. (1999b). In Figure 5 the contribution of the contaminants is shown together with the -gated spectrum.
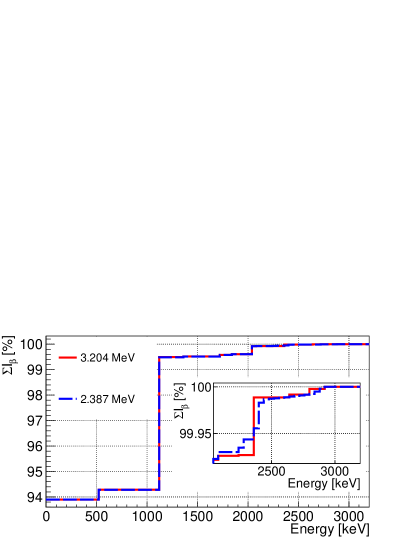
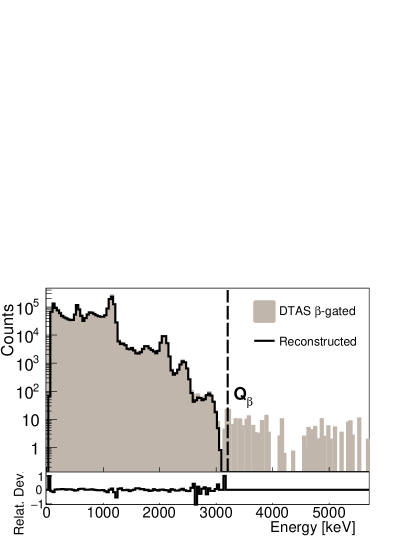
The analysis was carried out by applying the expectation maximization (EM) algorithm to extract the -feeding distribution Tain and Cano-Ott (2007a). The quality of the analysis can be checked by the comparison of the experimental spectrum with the spectrum reconstructed with the -intensities obtained in the analysis convoluted with the response function of the spectrometer by using Equation 1. We have observed that there is no noticeable difference if we consider the known level scheme up to 3.072 MeV or up to 2.387 MeV, as can be seen in Figure 6, where both -intensity distributions are compared. Moreover, from the analysis it was concluded that allowing feeding only to states observed in the high-resolution measurement of the -decay was enough to obtain a good reproduction of the spectrum. However, the fit at high energies in the analysis with the known part up to 3.072 MeV is improved if we consider an additional 2+ level at 2.934 MeV that was not seen in previous decay studies, but was seen in electron capture studies from 100Rh Singh (2008). The improvement of the fit with intensity at this energy is also seen in the analysis performed with the known level scheme up to 2.387 MeV, where the last level populated in the continuum is at 2.940 MeV. The level at 2.934 MeV, according to the information from the Evaluated Nuclear Structure Data File (ENSDF), de-excites with a single -ray of 2934 keV to the ground state and has spin-parity values of 1+ or 2+. In the RIPL-3 database Capote et al. (2009), a spin-parity assignment of 2+ is suggested and this was our assumption in the analysis. However, we also tested the 1+ spin-parity assignment as a possibility for this level, with very similar results. The final intensity distribution was obtained with the known level scheme up to 3.072 MeV, and it is presented in the fourth column of Table 2. The quality of the final analysis is shown in Figure 7.
| Energy [MeV] | ENSDF [] | DTAS [] | ENSDF | DTAS | theory | |
|---|---|---|---|---|---|---|
| 0.000 | 93.3(1111for further discussion see text.) | 93.9(5) | 4.591(6)222 This value has been calculated with the program of the National Nuclear Data Center (NNDC) log that uses ENSDF evaluated data as input (the intensity from the third column). It differs slightly from the value of the evaluation Singh (2008). | 4.588(6) | 4.63 | |
| 0.538 | 0.75(14) | 0.39(5) | 6.35(9) | 6.63(6) | 5.88 | |
| 1.130 | 5.36(13) | 5.20(40) | 5.04(1) | 5.05(4) | 6.06 | |
| 1.362 | 0.030(4) | 0.026(8) | 7.1(1) | 7.15(14) | 7.35 | |
| 1.741 | 0.066(3) | 0.062(6) | 6.34(2) | 6.37(5) | - | |
| 1.865 | 0.030(4) | 0.029(3) | 6.54(6) | 6.55(5) | - | |
| 2.052 | 0.36(5) | 0.31(2) | 5.21(6) | 5.27(3) | 5.30 | |
| 2.099 | 0.0073(7) | 0.0045(40) | 6.83(5) | 7.04(40) | - | |
| 2.241 | 0.0013(7) | 0.0006(5) | 7.36(20) | 7.69(80) | - | |
| 2.387 | 0.063(4) | 0.062(6) | 5.41(3) | 5.42(5) | 5.27 | |
| 2.660 | 0.0046(10) | 0.0032(30) | 5.9(1) | 6.1(10) | 6.24 | |
| 2.838 | 0.006(3) | 0.006(1) | 5.2(2) | 5.22(8) | 5.73 | |
| 2.934 | - | 0.0024(9) | - | 5.18(20) | 5.64 |
For the evaluation of the uncertainties in the -intensities resulting from the analysis and presented in Table 2, several sources of systematic error were considered (statistical errors are negligible in comparison). First, the normalization factors of the contaminants were varied and the impact on the -intensities evaluated. We have found that the reproduction of the experimental spectrum allows a change of up to 50 for the normalization factor of the background, and 10 for the summing-pileup. The impact of the effect of the detector efficiency has also been studied by changing the threshold value in the MC simulation by 30. Finally, the Maximum Entropy (ME) algorithm Tain and Cano-Ott (2007a) has been applied instead of the EM algorithm in order to check the influence of the method of de-convolution. By combining all of these sources of uncertainty, we have estimated the possible systematic errors in the analysis.
Finally, as a crosscheck of the consistency of the analysis, we have also calculated the values de-exciting the main levels populated in the decay, using our branching ratio matrix and our distribution. The result is presented in Table 3 and it shows a nice agreement with the high-resolution intensities. Furthermore, the segmentation of the spectrometer allows us to check the reproduction of the individual-module spectra of DTAS. A simulation using the DECAYGEN event generator Tain and Cano-Ott (2007b) with the branching ratio matrix and the intensity distribution from our analysis as input, reproduces nicely the sum of the 18 single-crystal spectra when compared with experiment, as shown in Figure 8.
| Energy [keV] | ENSDF | DTAS |
|---|---|---|
| 539.48 | 0.066 | 0.060 |
| 1130.25 | 0.054 | 0.052 |
| 1362.21 | 0.001 | 0.001 |
| 1740.95 | 0.001 | 0.001 |
| 2051.51 | 0.004 | 0.003 |
| 2387.12 | 0.001 | 0.001 |
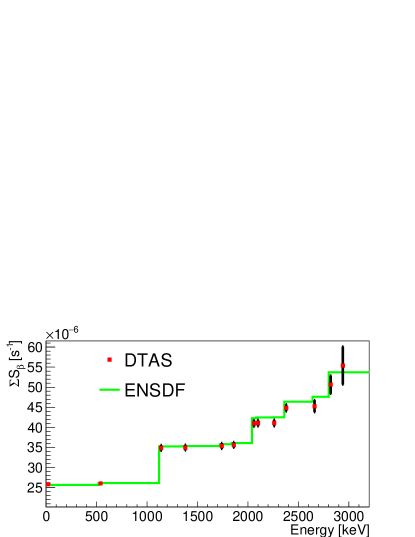
The information for the from ENSDF Singh (2008) is compared with the result of the analysis in Figure 9. In Table 2 we present the values and values corresponding to this comparison. The accumulated strength is also calculated in both cases and compared in Figure 10.
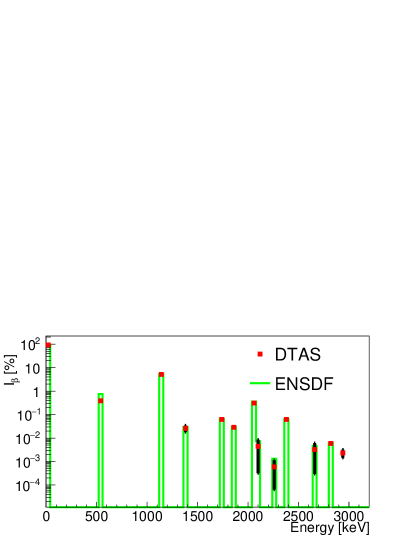
From the data compiled in Tables 2 and 3, it can be concluded that the TAGS results confirm the high-resolution results in this case. All intensities are in agreement within the errors, except for the first 2+ state. In general, intensities obtained exhibit relative differences of with respect to ENSDF. The new TAGS data give a slightly larger ground state feeding intensity ( difference) and a population of the first 2+ state smaller. Intensities to levels at 2.099 MeV and 2.241 MeV have relative differences with ENSDF of and respectively. These levels are weakly populated, and the intensities are determined with large errors in our analysis. Similarly, the intensity to the level at 2.660 MeV also has a large error because it is strongly affected by the 2614.5 keV peak in the environmental background, and the intensity differs by from the evaluated value.
Concerning the most important branch of the decay, the ground state feeding, we obtained a value of 93.9(5), in comparison with the 93.3(1) value from ENSDF Singh (2008). However, it should be noted that the quoted value in ENSDF has a quite small error. In the only high-resolution reference that gives absolute -intensities with errors Furutaka et al. (2001), the -ray with 100 relative intensity (539.6 keV) is measured with an absolute intensity of 6.6(6). Using this number we have evaluated the ground state feeding intensity, and obtained 93.3(6), where the error is calculated by applying the conventional method for error propagation. If we consider the updated error given by the same authors in a subsequent publication Furutaka et al. (2005), with 6.6(5), a ground state feeding intensity of 93.3(4) is obtained. In both cases, the error is larger than the ENSDF value, and our value of 93.9(5) is in reasonable agreement with them. It is worth mentioning that in the EC decay study from Sjue et al. (2008), a 6.6(3) absolute intensity is obtained for the 539.6 keV -ray. An evaluation of the ground state feeding intensity by combining this error and the relative intensities from Furutaka et al. (2001) gives a 93.3(2). Furthermore, we have also calculated the ground state feeding by applying a - counting method for TAGS data proposed by Greenwood et al. Greenwood et al. (1992). Our preliminary calculation with this method gives a value of 92.8(5), closer to the value from high-resolution measurements. However, we should note that with this ground state feeding intensity we do not obtain as good reproduction of the low energy part of the TAGS spectrum as with the value reported in Table 2.
IV Theoretical description of the results
As mentioned in the introduction, the original goal of this work was to contribute with an independent measurement of the 100Tc 100Ru -decay to the overall knowledge of the system and thus provide a better experimental constraint on the nuclear models used in double -decay calculations. In this section, we will give a few details of the calculations performed using the quasiparticle random-phase approximation (QRPA) for this decay, and we will compare the results of the TAGS analysis with these calculations.
IV.1 Description of the nuclear model
The wave functions of the nuclear states involved in the -decay transitions of 100Tc into 100Ru are calculated in this case using QRPA in a realistically large single-particle model space spanned by the single-particle orbitals 1p-0f-2s-1d-0g-0h for both protons and neutrons, with all spin-orbit partners included. The calculated states, except for , and states, except for , in 100Ru are assumed to be basic excitations (one-phonon states) of the charge-conserving QRPA (ccQRPA) Suhonen (2007), whereas the and states are assumed to consist of two ccQRPA phonons as discussed in Civitarese and Suhonen (1994). The ground state of the nucleus 100Tc is generated by the usual proton-neutron QRPA (pnQRPA) Suhonen (2007). The one- and two-phonon states in 100Ru are then connected to the ground state of 100Tc by transition amplitudes obtained from a higher-QRPA framework called the multiple-commutator model (MCM), first introduced in Suhonen (1993) and further extended in Civitarese and Suhonen (1994). The MCM framework has been used on many occasions in the past in -decay and double--decay calculations, as described in Suhonen and Civitarese (2012b).
For the Gamow-Teller transitions we can define Suhonen (2007):
| (2) |
where is a phase-space factor, [s] is the partial half-life of a transition in seconds and is the weak axial-vector coupling constant with its bare one-nucleon value . The quantity is the Gamow-Teller transition matrix element to be computed by the MCM method.
The single-particle energies were first generated by the use of a spherical Coulomb-corrected Woods-Saxon (WS) potential, with the global parametrization of Ref. Bohr and Mottelson (1969). The BCS approximation was used to define the quasiparticles needed for the pnQRPA calculations of the wave functions in the nucleus 100Tc and the ccQRPA calculations of the wave functions in the final nucleus 100Ru. The Bonn-A G-matrix Holinde (1981) has been used as the starting point for the two-body interaction and it has been scaled separately for the pairing and proton-neutron multipole channels Suhonen et al. (1988a, b). The pairing matrix elements are scaled by a common factor, separately for protons and neutrons, and in practice these factors are fitted so that the lowest quasiparticle energies obtained from the BCS match the experimental pairing gaps for protons and neutrons respectively.
The particle-hole and particle-particle parts of the proton-neutron two-body interaction in the pnQRPA calculation are scaled by the particle-hole parameter and particle-particle parameter , respectively Suhonen et al. (1988a, b). The value of the particle-hole parameter was fixed by the available systematics Suhonen (2007) on the location of the Gamow-Teller giant resonance (GTGR) for states. The value of is not fixed a priori and it is a free parameter in the model. Its value regulates the decay amplitude of the first state in an odd-odd nucleus Suhonen (2005), as here in the case of the ground state of 100Tc. Also the value of the axial vector coupling constant is not known in finite nuclei. The effective (quenched) value of has attracted a lot of attention recently due to the fact that it plays a crucial role in predictions of the rates of double -decays, which depend on to the fourth power. Typically, in the shell-model calculations in the sd and pf shells a moderate quenching, , has been adopted Wildenthal et al. (1983); Martínez-Pinedo et al. (1996). However, a strong quenching of was reported in the shell-model calculations in the mass region in Ref. Juodagalvis and Dean (2005). In a more recent shell-model study Caurier et al. (2012) values of about were obtained in the mass region and an even stronger quenching of for . Strong quenchings for have also been obtained in the framework of the pnQRPA Faessler et al. (2008); Suhonen and Civitarese (2013, 2014); Pirinen and Suhonen (2015) and in the interacting boson approximation calculations Barea et al. (2013); Yoshida and Iachello (2013); Barea et al. (2015). A combined global analysis of the values of and was performed in the pnQRPA approach in Pirinen and Suhonen (2015). The measured Gamow-Teller ground-state-to-ground-state -decay rates were compared with the computed ones within the mass range . In the present calculations we adopt the values and directly from this global analysis and use them to compute the values for all decay transitions in this work.
For the ccQRPA the parameter was kept in the default, pure G-matrix value and was fixed to reproduce the experimental excitation energy of the state in 100Ru by the ccQRPA calculations. The , and states are assumed to belong to a two-phonon triplet where the degeneracy of the states is lifted by their interactions with the one-phonon states, as discussed in Delion and Suhonen (2003). In the MCM description non-interacting two-phonon states are used at exactly twice the energy of the state, and no mixing with the one-phonon states is assumed. Hence, in the present MCM calculations the states , and share the common energy of .
IV.2 Discussion
The resulting values obtained from this calculation are presented together with the experimental ones in Table 2. As one can see, the ground-state value is well reproduced due to the features of the global fit of Pirinen and Suhonen (2015). However, the predictions for transitions to the and states fail. This seems to be a characteristic problem with the transitions to excited states in 100Ru since similar difficulties were faced in the earlier calculations of Griffiths and Vogel (1992); Suhonen and Civitarese (1994). In these studies a simultaneous prediction of the two-neutrino double -decay rate of 100Mo and the -decay rates of 100Tc was attempted and the parameter of the pnQRPA was used for this purpose. By varying and keeping moderately quenched () a quite good result for the double--decay half-life, yr, was obtained when compared with the present experimental value yr Barabash (2013) with a similar single-particle basis set to that used in the present calculations. Instead, in the global fit of Pirinen and Suhonen (2015) the same was used for all nuclei within the mass range and a half-life three times longer than the experimental one was obtained by using the linear model with .
One possible obstacle to an accurate theoretical description of the -decay properties of 100Tc in the present and earlier calculations is the appearance of deformation effects at around mass . This is a problem since the pnQRPA calculations conducted here and earlier are based on a spherical mean field. In an earlier study Kotila et al. (2003) the isotopic chain 98-106Ru was studied by using the microscopic anharmonic vibrator approach (MAVA) to track the possible setting of deformation in the chain. The MAVA uses a realistic nuclear Hamiltonian to derive equations of motion for the mixing of one- and two-phonon degrees of freedom starting from the collective phonons of QRPA. This means that the assumption of harmonic vibration in the present calculations is relaxed and the degeneracy of the two-phonon , and states, mentioned earlier, is broken by the one-phonon–two-phonon interactions. In the study Kotila et al. (2003) it was found that the nucleus 100Ru can be seen as a transitional nucleus between the anharmonic vibrator 98Ru and the (quasi-)rotors 102-106Ru. Furthermore, the theoretical study of Moller et al. (1995) and the experimental study of Raman et al. (2001b) suggest that 100Ru possesses a moderate deformation around implying that 100Ru is a soft nucleus lying between an anharmonic vibrator and a deformed rotor. For 100Tc the calculations of Moller et al. (2006) imply a moderate deformation of , not far from the deformation of 100Ru. Hence, 100Tc can also be considered to be a soft transitional nucleus like 100Mo. It could be that even this softness, being between a vibrator and a rotor, can affect the -decay transitions for 100Tc 100Ru in such a way that a perfect description of these transitions becomes impossible with a simple spherical pnQRPA approach.
V Conclusions
In this work we have presented a measurement of the 100Tc 100Ru -decay using the total absorption -ray spectroscopy technique for the first time. The results of this analysis confirm the intensities obtained with HPGe detectors using the high-resolution technique Furutaka et al. (2001); Berzins et al. (1969). In particular, the large intensity of the most important branch of the decay, going to the ground state of 100Ru, has been confirmed. Moreover, a - counting method for TAGS data also gives a ground state feeding intensity in agreement with the TAGS analysis. The remainder of the intensities obtained are also in reasonable agreement with previous results. The largest discrepancies are observed for the first state. The best fit in the TAGS analysis is obtained when feeding to a new state at 2.934 MeV is introduced. This intensity was not seen in previous -decay studies.
Due to the importance of this decay for double decay studies, it was crucial to confirm with the TAGS technique the available data, avoiding any possible influence of the Pandemonium systematic error Hardy et al. (1977). Although the high-resolution experimental information may look reasonably complete, new intensity was detected in previous TAGS experiments even in apparently well known cases, as in the recent study of the decay of 87Br Valencia et al. (2017), or in the decay of 148Dy Algora et al. (2004). In addition, this result represents a validation of the good performance of the new experimental set-up formed by the DTAS detector in combination with a vase-shaped plastic detector.
The decay data have been discussed in the framework of the QRPA calculations, because of their impact in double -decay calculations. These calculations are in good agreement with TAGS results for the ground state feeding and for the level at 2.052 MeV, with differences in intensity of less than . The rest of the calculations lead to intensities differing by between and from TAGS results, except for the and states in 100Ru, where discrepancies are a factor of 6 and 10 respectively. These deviations from the measured -decay rates could be due to the small deformation (shape softness) of both the mother and daughter nuclei. Concerning the interesting double -decay there is a slight conflict regarding the adopted effective value of the axial-vector coupling constant . On the one hand, the -decay calculations presented here are performed by adopting the value from the linear model of a global Gamow-Teller -decay study. The other model of that study, with constant , yields a poorer reproduction of the results for the present decay transitions. On the other hand, the constant model works better for the 2 double -decay, reproducing almost exactly the 100Mo 2 double -decay half-life and many other 2 double -decay half-lives. In this way the presently discussed triplet – Mo, Tc and Ru – continues to be a challenge for nuclear models aiming at a successful description of both the single -decays and the double -decay for these nuclei.
Acknowledgements.
AA acknowledges useful discussions with Prof. A Garcia and Dr. S Sjue during the preparation of the experimental proposal. This work has been supported by the Spanish Ministerio de Economía y Competitividad under Grants No. FPA2011-24553, No. AIC-A-2011-0696, No. FPA2014-52823-C2-1-P, No. FPA2015-65035-P, No. FPI/BES-2014-068222 and the program Severo Ochoa (SEV-2014-0398), by the Spanish Ministerio de Educación under the FPU12/01527 Grant, by the European Commission under the FP7/EURATOM contract 605203 and the FP7/ENSAR contract 262010, and by the Programme (CSIC JAE-Doc contract) co-financed by FSE. This work has been partially supported by the Academy of Finland under the Finnish Centre of Excellence Programme 2012-2017 (Project No. 213503, Nuclear and Accelerator Based Programme at JYFL). WG was supported by the UK Science and Technology Facilities Council (STFC) Grant ST/F012012/1 and by the University of Valencia.References
- Suhonen and Civitarese (1998) J. Suhonen and O. Civitarese, Phys. Rep. 300, 123 (1998).
- Klapdor-Kleingrothaus et al. (2001) H. V. Klapdor-Kleingrothaus et al., Modern Physics Letters A 16, 2409 (2001).
- Avignone III et al. (2008) F. T. Avignone III et al., Rev. Mod. Phys. 80, 481 (2008).
- Vergados et al. (2012) J. D. Vergados et al., Rep. Prog. Phys. 75, 106301 (2012).
- Suhonen and Civitarese (2012a) J. Suhonen and O. Civitarese, J. Phys. G: Nucl. Part. Phys. 39, 124005 (2012a).
- Freeman and Schiffer (2012) S. J. Freeman and J. P. Schiffer, J. Phys. G: Nucl. Part. Phys. 39, 124004 (2012).
- Thomas et al. (2012) J. S. Thomas et al., Physical Review C 86, 047304 (2012).
- Hirsch et al. (1995) J. G. Hirsch et al., Phys. Rev. C 51, 2252 (1995).
- Barabash et al. (1998) A. S. Barabash et al., Phys. Lett. B 345, 408 (1998).
- Civitarese et al. (2003) O. Civitarese et al., Eur. Phys. J. A 16, 353 (2003).
- Civitarese et al. (1998) O. Civitarese et al., Phys. Rev. C. 58, 1535 (1998).
- Civitarese et al. (1999) O. Civitarese et al., Nuc. Phys. A. 653, 321 (1999).
- Arnold et al. (2007) R. Arnold et al., Nuc. Phys. A. 781, 209 (2007).
- Arnold et al. (2005) R. Arnold et al., Nucl. Instrum. and Methods A 536, 79 (2005).
- Sjue et al. (2008) S. K. L. Sjue et al., Phys. Rev. C 78, 064317 (2008).
- Abad et al. (1984) J. Abad et al., An. Fis. A 80, 9 (1984).
- Furutaka et al. (2001) K. Furutaka et al., J. Nucl. Science and Technology 38, 1035 (2001).
- Berzins et al. (1969) G. Berzins et al., Phys. Rev. 187, 1618 (1969).
- (19) “Q-value Calculator (QCalc), National Nuclear Data Center, Brookhaven National Laboratory,” http://www.nndc.bnl.gov/qcalc/.
- Bhang et al. (2012) H. Bhang et al., J. Phys. Conf. Ser. 375, 042023 (2012).
- Fushimi et al. (2010) K. Fushimi et al., J. Phys. Conf. Ser. 203, 012064 (2010).
- Huber and Jaffke (2016) P. Huber and P. Jaffke, Phys. Rev. Lett. 116, 122503 (2016).
- Moller et al. (2006) P. Moller et al., Phys. Rev. Lett. 97, 162502 (2006).
- Nácher et al. (2004) E. Nácher et al., Phys. Rev. Lett. 92, 232501 (2004).
- Poirier et al. (2004) E. Poirier et al., Phys. Rev. C 69, 034307 (2004).
- Pérez-Cerdán et al. (2013) A. B. Pérez-Cerdán et al., Phys. Rev. C 88, 014324 (2013).
- Estévez Aguado et al. (2015) M. E. Estévez Aguado et al., Phys. Rev. C 92, 044321 (2015).
- Briz et al. (2015) J. A. Briz et al., Phys. Rev. C 92, 054326 (2015).
- Hardy et al. (1977) J. C. Hardy et al., Phys. Lett. B 71, 307 (1977).
- Algora et al. (2004) A. Algora et al., Phys. Rev. C 70, 064301 (2004).
- Nácher et al. (2016) E. Nácher et al., Phys. Rev. C 93, 014308 (2016).
- Jordan et al. (2013) D. Jordan et al., Phys. Rev. C 87, 044318 (2013).
- Algora et al. (2010) A. Algora et al., Phys. Rev. Lett. 105, 202501 (2010).
- Tain et al. (2015a) J. L. Tain et al., Phys. Rev. Lett. 115, 062502 (2015a).
- Tain and Cano-Ott (2007a) J. L. Tain and D. Cano-Ott, Nucl. Instrum. and Methods A 571, 728 (2007a).
- Cano-Ott et al. (1999a) D. Cano-Ott et al., Nucl. Instrum. and Methods A 430, 333 (1999a).
- Cano-Ott et al. (1999b) D. Cano-Ott et al., Nucl. Instrum. and Methods A 430, 488 (1999b).
- Tain and Cano-Ott (2007b) J. L. Tain and D. Cano-Ott, Nucl. Instrum. and Methods A 571, 719 (2007b).
- Moore et al. (2013) I. D. Moore et al., Nucl. Instrum. and Methods B 317, 208 (2013).
- Tain et al. (2015b) J. L. Tain et al., Nucl. Instrum. and Methods A 803, 36 (2015b).
- Guadilla et al. (2016) V. Guadilla et al., Nucl. Instrum. and Methods B 376, 334 (2016).
- Eronen et al. (2012) T. Eronen et al., Eur. Phys. J. A 48, 46 (2012).
- Guadilla et al. (2017) V. Guadilla et al., Nucl. Instrum. and Methods A 854, 134 (2017).
- (44) V. Guadilla et al., (unpublished) .
- Capote et al. (2009) R. Capote et al., Nucl. Data Sheets 110, 3107 (2009).
- Kopecky and Uhl (1990) J. Kopecky and M. Uhl, Phys. Rev. C 41, 1941 (1990).
- Raman et al. (2001a) S. Raman, C. W. Nestor Jr, and P. Tikkanen, Atomic Data and Nuclear Data Tables 78, 1 (2001a).
- Goriely et al. (2008) S. Goriely, S. Hilaire, and A. J. Koning, Phys. Rev. C 78, 064307 (2008).
- Goriely et al. (2007) S. Goriely, M. Samyn, and J. Pearson, Phys. Rev. C 75, 064312 (2007).
- Agostinelli et al. (2003) S. Agostinelli et al., Nucl. Instrum. and Methods A 506, 250 (2003).
- Zakari-Issoufou et al. (2015) A.-A. Zakari-Issoufou et al., Phys. Rev. Lett. 115, 102503 (2015).
- Valencia et al. (2017) E. Valencia et al., Phys. Rev. C 95, 024320 (2017).
- Singh (2008) B. Singh, Nuclear Data Sheets 109, 297 (2008).
- (54) “ENSDF Analysis Programs, LOGFT, National Nuclear Data Center, Brookhaven National Laboratory,” http://www.nndc.bnl.gov/nndcscr/ensdf_pgm/analysis/logft/unx/.
- Furutaka et al. (2005) K. Furutaka et al., J. Nucl. Radiochem. Sci. 6, 283 (2005).
- Greenwood et al. (1992) R. C. Greenwood, D. A. Struttmann, and K. D. Watts, Nucl. Instrum. and Methods A 317, 175 (1992).
- Suhonen (2007) J. Suhonen, From Nucleons to Nucleus: Concepts of Microscopic Nuclear Theory (Springer, 2007).
- Civitarese and Suhonen (1994) O. Civitarese and J. Suhonen, Nucl. Phys. A 575, 251 (1994).
- Suhonen (1993) J. Suhonen, Nucl. Phys. A 563, 205 (1993).
- Suhonen and Civitarese (2012b) J. Suhonen and O. Civitarese, J. Phys. G: Nucl. Part. Phys. 39, 185105 (2012b).
- Bohr and Mottelson (1969) A. Bohr and B. R. Mottelson, Nuclear Structure, Vol. I (Benjamin, 1969).
- Holinde (1981) K. Holinde, Phys. Rep. 68, 121 (1981).
- Suhonen et al. (1988a) J. Suhonen et al., Phys. Lett. B 202, 174 (1988a).
- Suhonen et al. (1988b) J. Suhonen et al., Nucl. Phys A 486, 91 (1988b).
- Suhonen (2005) J. Suhonen, Phys. Lett. B 607, 87 (2005).
- Wildenthal et al. (1983) B. H. Wildenthal et al., Phys. Rev. C 28, 1343 (1983).
- Martínez-Pinedo et al. (1996) G. Martínez-Pinedo et al., Phys. Rev. C 53, R2602 (1996).
- Juodagalvis and Dean (2005) A. Juodagalvis and D. J. Dean, Phys. Rev. C 72, 024306 (2005).
- Caurier et al. (2012) E. Caurier et al., Phys. Lett. B 711, 62 (2012).
- Faessler et al. (2008) A. Faessler et al., J. Phys. G 35, 075104 (2008).
- Suhonen and Civitarese (2013) J. Suhonen and O. Civitarese, Phys. Lett. B 725, 153 (2013).
- Suhonen and Civitarese (2014) J. Suhonen and O. Civitarese, Nucl. Phys. A 924, 1 (2014).
- Pirinen and Suhonen (2015) P. Pirinen and J. Suhonen, Phys. Rev. C 91, 054309 (2015).
- Barea et al. (2013) J. Barea et al., Phys. Rev. C 87, 014315 (2013).
- Yoshida and Iachello (2013) N. Yoshida and F. Iachello, Prog. Theor. Exp. Phys. 2013, 043D01 (2013).
- Barea et al. (2015) J. Barea et al., Phys. Rev. C 91, 034304 (2015).
- Delion and Suhonen (2003) D. S. Delion and J. Suhonen, Phys. Rev. C 67, 034301 (2003).
- Griffiths and Vogel (1992) A. Griffiths and P. Vogel, Phys. Rev. C 46, 181 (1992).
- Suhonen and Civitarese (1994) J. Suhonen and O. Civitarese, Phys. Rev. C 49, 3055 (1994).
- Barabash (2013) A. S. Barabash, AIP Conf. Proc. 1572, 11 (2013).
- Kotila et al. (2003) J. Kotila et al., Phys. Rev. C 68, 054322 (2003).
- Moller et al. (1995) P. Moller et al., At. Data Nucl. Data Tables 59, 185 (1995).
- Raman et al. (2001b) S. Raman et al., At. Data Nucl. Data Tables 78, 1 (2001b).