High-redshift blazars through NuSTAR eyes
Abstract
The most powerful sources among the blazar family are MeV blazars. Often detected at , they usually display high X- and -ray luminosities, larger-than-average jet powers and black hole masses . In the present work we perform a multiwavelength study of three high redshift blazars: 3FGL J0325.5+2223 (), 3FGL J0449.0+1121 (), and 3FGL J0453.22808 (), analysing quasi simultaneous data from GROND, Swift-UVOT and XRT, NuSTAR, and Fermi-LAT. Our main focus is on the hard X-ray band recently unveiled by NuSTAR (379 keV) where these objects show a hard spectrum which enables us to constrain the inverse Compton peak and the jet power. We found that all three targets resemble the most powerful blazars, with the synchrotron peak located in the sub-millimeter range and the inverse Compton peak in the MeV range, and therefore belong to the MeV blazar class. Using a simple one zone leptonic emission model to reproduce the spectral energy distributions, we conclude that a simple combination of synchrotron and accretion disk emission reproduces the infrared-optical spectra while the X-ray to -ray part is well reproduced by the inverse Compton scattering of low energy photons supplied by the broad line region. The black hole masses for each of the three sources are calculated to be . The three studied sources have jet power at the level of, or beyond, the accretion luminosity.
1 Introduction
Blazars are a subset of active galactic nuclei (AGN) whose relativistic jets are pointed towards the observer (, being the viewing angle and the bulk Lorentz factor). From their optical properties, they have been sub-classified as flat spectrum radio quasars (FSRQs), if their spectrum shows broad emission lines (equivalent width, EWÅ), and BL Lacertae (BL Lac) objects which show weak (EWÅ) or absent emission lines (Stickel et al., 1991; Stocke et al., 1991). Blazars are known to radiate over the entire electromagnetic spectrum, from the low-energy radio band to very high-energy -rays; this radiation is primarily due to non-thermal emission processes and is believed to be the manifestation of a powerful relativistic jet (e.g., Blandford & Rees, 1978; Urry & Padovani, 1995; Dermer & Giebels, 2016). The spectral energy distribution (SED) of a blazar displays two characteristic broad humps, one peaking between infrared (IR) and X-ray frequencies and the other between the X-ray and -ray energy bands. The low-energy hump is attributed to the synchrotron process of relativistic electrons present in the jet, while the high-energy peak is associated with the inverse Compton (IC) scattering of low-energy photons by relativistic electrons. The low-energy photons can be either synchrotron photons (synchrotron self Compton or SSC; Konigl, 1981) or photons originating externally to the jet (external Compton or EC; Begelman & Sikora, 1987).
Two features are noteworthy: due to the peculiar orientation of the relativistic jet, the enhancement ascribed to relativistic beaming allows us to detect blazars at high redshifts. Moreover, according to the so-called ‘blazar sequence’ (Fossati et al., 1998; Ghisellini et al., 1998), the efficiency of electron cooling due to IC increases with increasing source luminosity. These arguments imply that the more distant and luminous the object is, the greater the shift of the SED humps towards lower frequencies. The synchrotron peak of the most powerful blazars is located in the sub-millimeter (mm) range, while the IC peak falls in the MeV band. The position of the latter classifies such objects as ‘MeV blazars’ (e.g., Bloemen et al., 1995). The characteristics of their spectra have allowed us to detect blazars up to (e.g., Romani et al., 2004; Sbarrato et al., 2013).
The shift of the IC peak makes MeV blazars bright at hard X-rays
( keV) (see, e.g., Ghisellini, 2013).
With the advent of the first focusing hard X-ray telescope in orbit, the Nuclear Spectroscopic Telescope Array (NuSTAR; Harrison et al., 2013),
it is now possible to explore the hard X-ray (379 keV) energy band with unprecedented detail.
NuSTAR has already been shown to be a powerful instrument for the study of the most
luminous and distant blazars, opening a window to understand the early X-ray universe (e.g., Sbarrato et al., 2013).
Thanks to its sensitivity, it has allowed us to investigate some peculiar X-ray features of high-redshift blazars,
like variability (e.g. Sbarrato et al., 2016) or flattening in the spectrum (e.g., Paliya et al., 2016).
Also, by combining NuSTAR observations with Fermi-Large Area Telescope (Fermi-LAT; Atwood et al., 2009) data, we can more reliably measure the location of the IC peak in the SED. Since the bolometric luminosity of blazars is dominated
by high-energy emission (e.g., Ghisellini et al., 2014), an accurate measurement of the IC component in the SED provides important constraints on the power of the jet
and on the relativistic particle population.
Moreover, the shift in the synchrotron peak reveals the underlying optical-UV thermal emission from the accretion disk (e.g., Ghisellini et al., 2010). Modeling the disk emission
with a standard optically thick, spatially thin geometry (Shakura & Sunyaev, 1973), one can estimate the central black hole mass and the accretion disk luminosity. As a result,
MeV blazars are ideal objects to study the accretion-jet connection.
Furthermore, these sources generally host extremely massive black holes at their centers (, e.g., Ghisellini et al., 2010; Ajello et al., 2016; Paliya et al., 2016).
This has important implications as the detection of a blazar implies the existence of such sources (where 10-15, e.g., Sikora et al., 1997)
with misaligned jets at the same redshift, hosting similarly massive black holes. Therefore a detailed study of MeV blazars, hosting extremely massive black holes, places useful
constraints on the high end of the black-hole mass function, which is essential for a full theoretical understanding of the growth and evolution of black holes over cosmic time (e.g., Johnson & Haardt, 2016).
This can be accomplished by adopting a multi-wavelength approach and utilizing data from a variety of
instruments.
Here we present a broadband study of three high-redshift blazars: 3FGL J0325.52223 (), 3FGL J0449.01121 (), and 3FGL J0453.22808 (). These are among the most powerful known sources of this class: found at with a -ray luminosity L erg s-1(Ackermann et al., 2015), they are soft -ray emitters but display a hard X-ray continuum (2-10 keV) (e.g., Ajello et al., 2009; Ghisellini et al., 2011), which classifies them as MeV blazars. They are among the few of their class that are detected in X-rays and by the Fermi-LAT as well.
In fact, they have been selected as they are the only three sources, among the ten most luminous LAT FSRQs (Ackermann et al., 2015), which do not have hard X-ray coverage. Therefore we report their first E10 keV detection obtained from NuSTAR observations111These three sources were observed by NuSTAR as part of our cycle program (proposal number 1285; obs IDs: 60101078002, 60101079002, 60101080002).. As such it becomes possible to accurately determine the location of the high-energy peak in their SEDs.
Our primary motivation is to understand their physical properties by means of a multi-frequency data analysis and theoretical SED modeling, with a major focus on the hard X-ray observations. All three sources have been simultaneously observed by NuSTAR, Swift X-Ray Telescope (XRT; Burrows et al., 2005) and Swift-UltraViolet and Optical Telescope (UVOT; Roming et al., 2005). Thus, the X-ray energy band was fully covered from 0.3 up to 79 keV. To cover the infrared (IR) to ultra-violet (UV) part of the SEDs, we integrated the observations from Swift-UVOT with the ones from the Gamma-Ray Burst Optical/Near-Infrared Detector (GROND; Greiner et al., 2008); for two of the sources these were carried out within one week of NuSTAR observations, while for 3FGL J0453.22808 they were taken within six months, due to technical issues. We also analyze the recently released Pass 8 data from Fermi-LAT, which provides better sensitivity at lower energies (Atwood et al., 2013) compared to previously released datasets. Throughout, we use cosmological parameters km s-1 Mpc-1, , and (Komatsu et al., 2009).
2 Observations
2.1 Fermi
The LAT Pass 8 data used in this work covers the period of NuSTAR observations. Since all three objects are faint in -rays, we chose a large time bin (MJD 5708257448) to generate a meaningful SED. Moreover, there is no significant -ray variability detected from these sources222We searched for significant -ray flux variations using the tool ‘Fermi All-sky Variability Analysis’ (FAVA; Ackermann et al., 2013), but found none, at least during the period covered in this work., and therefore, the selected period is a reasonable choice.
We followed the standard data reduction procedure as given in the online documentation333http://fermi.gsfc.nasa.gov/ssc/data/analysis/documentation/ with a few modifications. In the energy range 0.06300 GeV, we only selected SOURCE class events (evclass=128), including all four point spread function (PSF) event types lying within a 15∘ region of interest (ROI) centered at the target source. We used a relational filter “DATAQUAL0”, && “LATCONFIG==1” to define good time intervals. Only the events with zenith angle of 70∘, 75∘, 85∘ and 90∘ (according to the PSF types) were included in the analysis in order to avoid contamination from Earth-limb -rays. We performed a component-wise data analysis to account for different PSF types and considered the third catalog of Fermi-LAT detected sources (3FGL; Acero et al., 2015) to generate a source model. The source model includes all the sources present within the ROI, a Galactic diffuse emission component (gll_iem_v06.fits) and isotropic emission models (iso_P8R2_SOURCE_V6_PSF#_v06.txt, where #: 0, 1, 2, and 3) (Acero et al., 2016). A combined fitting was performed using the summed likelihood method included in the pyLikelihood library of the ScienceTools to derive the strength of the -ray signal. This was accomplished by computing a maximum likelihood test statistic TS = 2) where represents the likelihood function, between models with and without a point source at the position of the object (Mattox et al., 1996). Since we were using data below 100 MeV, we enabled the energy dispersion corrections for all sources, except for the diffuse backgrounds. We performed a first round of optimization to obtain a best initial guess of the spectral parameters for all sources. We then allowed the spectral parameters of all the sources having TS25 and lying within 10∘ from the center of the ROI to vary during the fitting. In the source spectra, only spectral bins where the source was detected with TS9 are reported.
2.2 NuSTAR
The blazar 3FGL J0325.52223 was observed by NuSTAR on 2015 November 8 for a net exposure of 22.2 ks; 3FGL J0449.01121 was observed on 2015 December 2 for a net exposure of 20.5 ks; and 3FGL J0453.22808 was monitored on 2015 December 3 for a net exposure of 19.5 ks. The data for both NuSTAR Focal Plane Modules (FPMA and FPMB; Harrison et al., 2013) were processed using the NuSTAR Data Analysis Software (NUSTARDAS) v1.5.1. We calibrated the event data files using the task nupipeline, with the response file taken from the latest Calibration Database (CALDB). The generation of source and background spectra, ancillary and response matrix files, has been achieved using the nuproducts script. We selected circles with radii of 30″centered on the target sources as the source regions and the background events were extracted from circles with the same area but from a nearby source-free region on the same frame.
2.3 Swift
Swift-XRT (Burrows et al., 2005) and UVOT (Roming et al., 2005) observations were carried out simultaneously with NuSTAR monitoring. 3FGL J0325.52223 was
observed on 2015 November 8, whereas 3FGL J0449.01121 and 3FGL J0453.22808 were monitored on 2015 December 2 and December 3, respectively. The exposure time for each of the three targets was 2 ks.
Due to these short exposure times and the intrinsic faintness of the sources in this band, none of the targets were detected by UVOT.
The Swift-XRT observations were executed in the photon counting mode. The XRT data were analysed with the
XRTDAS software package (v.3.0.0) distributed by HEASARC within the HEASoft package
(v.6.17). We used the task xrtpipeline to calibrate and clean the event files. Using the tool XSELECT, we extracted the source and background
regions using circles and annuli centered on the source, respectively. The radii for the two regions were chosen taking into account the difference in count
rates for the three objects. For 3FGL J0325.52223 we used a circular region of 45″radius, and an annular region of inner radius 90″and outer radius 190″;
for 3FGL J0449.01121 we used a circular region of 12″radius, and an annular region of inner radius 40″and outer radius 140″; and for
3FGL J0453.22808 we used a circular region of 25″radius, and an annular region of inner radius 50″and outer radius 150″.
The ancillary response files were generated using xrtmkarf and the source spectra were rebinned to have at least one count per bin.
2.4 GROND
GROND is a multi-channel imager mounted on the 2.2 m MPG444https://www.eso.org/sci/facilities/lasilla/telescopes/national/2p2.html telescope at ESO in La Silla, Chile. It simultaneously observes with seven filters (, J, H, Ks), covering the optical to near-infrared wavelength regime (Greiner et al., 2008). The data analysis procedure is described in detail in Krühler et al. (2008). For the optical filters (), the point spread function (PSF) photometric technique was employed, whereas the aperture extraction method was applied for the near-infrared (J, H, Ks) filters, because of the undersampled PSF in these bands. The optical filters were calibrated with the SDSS Data Release 8 (Aihara et al., 2011) and the near-IR filters were calibrated with 2MASS stars (Skrutskie et al., 2006). We have corrected for Galactic extinction following Schlafly & Finkbeiner (2011). The resulting magnitudes were converted to the AB magnitude system and are provided in Table 1.
3 Results
3.1 X-ray Spectral analysis
The joint Swift-XRT (0.3-10 keV) and NuSTAR (3.0-79 keV) spectra were simultaneously fitted with XSPEC using the C statistic (Cash, 1979). For all three sources we included Galactic absorption () with Galactic neutral hydrogen column densities taken from Kalberla et al. (2005).
A power-law model with absorption fixed at the Galactic value was used in all three cases. We included a multiplicative constant factor to cross-calibrate the three instruments; we kept it equal to 1 for FPMB but left it free to vary for FPMA and Swift-XRT. For two of the targets, the difference for FPMA is in the range of 6-7 %, while for Swift-XRT it is in the 3-20 % range. This is consistent with what has already been found for other sources (e.g., Madsen et al., 2015). In the case of 3FGL J0449.0+1121, due to poor photon statistics, we decided to keep the cross-calibration constant fixed to 1 for both FPMA and FPMB. Within errors, the cross-normalization constant for Swift-XRT is compatible with 1. The results of the spectral fits are provided in Table 1 and Figure 1 shows, as an example, the combined spectrum for 3FGL J0325.52223.
3.2 SED modeling
To understand the underlying physical mechanisms powering the relativistic jets of these objects, we reproduced the broadband SEDs using a simple one zone leptonic emission model. The details of the adopted procedure can be found in Ghisellini & Tavecchio (2009) and here it is briefly described. The observed radiation was assumed to originate from a spherical emission region covering the entire cross-section of the jet, located at a distance of from the central engine, and moving with the bulk Lorentz factor . The jet semi opening angle was assumed to be 0.1 rad. The relativistic electron population was assumed to follow a broken power law energy distribution of the following type
| (1) |
where is the break energy, p and q are the slopes of the particle energy distribution before and after , respectively. In the presence of a tangled but uniform magnetic field , electrons radiate via synchrotron and IC mechanisms. For the IC process, the low energy photons considered are synchrotron photons and photons originating outside the jet. We have considered several AGN components as potential reservoirs of external radiation energy density: (a) the accretion disk emission; (b) the X-ray corona lying above and below the accretion disk, having a cut-off power law spectral shape, and reprocessing 30% of the disk luminosity (); (c) the broad line region (BLR); and (d) the dusty torus. Both the BLR and the torus are considered as spherical shells located at distances cm and cm, respectively, where is the accretion disk luminosity in units of 1045 erg s-1. They are assumed to re-emit 10% and 50% of and their spectral shapes are considered as a blackbody peaking at the Lyman-alpha frequency and , respectively, where is the characteristic temperature of the torus. The EC spectra were calculated by deriving the comoving frame radiative energy densities from these components. Finally, we evaluated various powers that the jet carries in the form of the magnetic field (), electrons (), radiation (), and protons (). The or kinetic jet power was estimated by considering protons to be cold and hence contributing only to the inertia of the jet and having an equal number density to that of relativistic electrons (e.g., Celotti & Ghisellini, 2008).
3.3 Black hole mass estimation
The most commonly used approach to calculate quasar black hole mass is adopting a single epoch optical spectroscopic measurement, which assumes that the BLR is virialized (e.g., Shen et al., 2011). Another novel method to derive the black hole mass is by reproducing the IR-UV spectra of quasars with a standard Shakura & Sunyaev (1973) accretion disk, provided the big blue bump is visible in this energy band (see, Ghisellini & Tavecchio, 2015). This is particularly useful when the optical/IR spectrum of the source is not available. In this technique, the spectral shape of the accretion disk is assumed as a multi-color blackbody with the following flux density profile (Frank et al., 2002)
| (2) |
where is the distance of the observer, is the Boltzmann constant, is the speed of light, and and are the inner and outer disk radii, taken as 3 and 500, respectively. is the Schwarzschild radius. The radial temperature profile can be given as
| (3) |
where is the Stefan-Boltzmann constant and is the accretion efficiency, adopted here as 10%. There are only two parameters, the black hole mass and the accretion rate , to determine. The rate of accretion can be computed from the intrinsic accretion disk luminosity . Since can be obtained from observations, provided the peak of the big blue bump is visible in the SED, this leaves only the black hole mass as a free parameter (e.g., Ghisellini & Tavecchio, 2015).
The black hole masses of two out of three sources, 3FGL J0325.52223 and 3FGL J0449.01121, were derived by Shaw et al. (2012) using the optical spectroscopic approach. Using the C iv line, they found masses of and for 3FGL J0325.52223 and 3FGL J0449.01121, respectively. For 3FGL J0453.22808, we used C iv line parameters from Fricke et al. (1983) and adopted the empirical relations of Shen et al. (2011) to derive a central black hole mass of . Instead following the SED modeling approach, we found black hole masses for 3FGL J0325.52223, 3FGL J0449.01121 and 3FGL J0453.22808 of , and , respectively (all black-hole masses are listed in Table 3). The black hole masses computed from both approaches reasonably match within a factor of 2 for two of the sources555It should be noted that the typical errors in virial spectroscopic black hole mass calculation is 0.4 dex (e.g., Vestergaard & Peterson, 2006; Shen et al., 2011), though the SED modeling predicts a higher black hole mass (factor of 6) for 3FGL J0449.0+1121.
4 Discussion
High-redshift blazars are bright targets in hard X-rays. This is probably due to the shift of blazar SED towards longer wavelengths as their non-thermal luminosity increases (Fossati et al., 1999). The shifting causes their spectra to become steeper at -rays () and harder at X-rays (). Indeed, all the three MeV blazars studied here display these features (see Table 1). In this regard, observations in both these energy bands are crucial to determine the power of the jet and explore its connection to accretion. In fact, having both NuSTAR and Fermi-LAT detections for all three sources provides a unique opportunity to locate the IC peak and study the shape of the underlying electron population. The bolometric emission in such powerful blazars is dominated by high energy X-ray and -rays radiation conveying that good quality spectral measurements in both bands are desirable. Furthermore, there are a few other interesting properties of high redshift blazars revealed by NuSTAR monitoring. This includes a spectral flattening seen in the joint Swift-XRT and NuSTAR spectrum of various MeV blazars (Paliya et al., 2016) and also a substantial flux variability seen at two different epochs of NuSTAR monitoring (e.g., Tagliaferri et al., 2015). The latter becomes more important due to the fact that these sources are weaker at -rays and may not have enough signal to detect significant variability in this energy range. As a result, NuSTAR has proved to be a fundamental instrument to pursue high-redshift blazar studies.
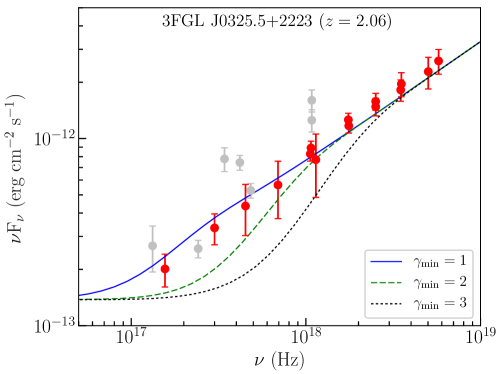
The joint XRT and NuSTAR spectra of the three sources do not show any curvature within the available statistics and is well fitted by a simple absorbed power law model with fixed to the Galactic value. It is reported in various recent studies that the 0.3-79 keV X-ray spectra of many MeV blazars () show a distinct curvature or a break around few keV (e.g. Tagliaferri et al., 2015; Paliya et al., 2016). Such a feature reflects the behavior of the emitting electron distribution, intrinsic to the jet, rather than any other external factors (Paliya et al., 2016, and references therein). On the other hand, there are observations of MeV blazars, that do not show any such feature (e.g. Ajello et al., 2016). In fact, the shape of the X-ray spectrum constrains the behavior of the underlying electron population, especially the low energy cut-off of the electrons () provided the X-ray emission is dominated by EC process, rather than by SSC (see, e.g., Celotti & Ghisellini, 2008). This is illustrated in Figure 3. As can be seen, a good fit can be achieved only with . For higher values, the model predicts a significant break in the X-ray spectrum, which is not seen666We caution that our calculations at low values of are rather approximate. These relatively ‘cold’ electrons could be involved in bulk Compton process (Celotti et al., 2007) and one should self-consistently take this into account. However, this feature is yet to be observed (however see, Ackermann et al., 2012, for a possible detection) and so its contribution is uncertain. Furthermore, the kinetic jet power is very sensitive to and for it falls below the jet power in radiation, which is problematic for powerful FSRQs (see, e.g. Ghisellini et al., 2014). This implies the joint XRT and NuSTAR observations are instrumental in evaluating the minimum energy of the underlying particle population, which ultimately controls the jet power.
The broadband SEDs of the three MeV sources resemble those of powerful blazars. The synchrotron peaks lie in the sub-mm range, whereas the high-energy IC peaks lie in the MeV band. The Compton dominance (the ratio of IC to synchrotron peak luminosities) is found to be 1 for all three blazars. The GROND observations reveal a break in the IR-optical spectra of the sources which we interpret as a combination of the falling synchrotron spectrum and the rising accretion disk radiation. Though we do not see the peak of the disk emission (primarily due to lack of UV data), based on the shape of the GROND spectra and the available archival broad line luminosities (Fricke et al., 1983; Shaw et al., 2012), we are able to derive both the disk luminosity and the central black hole mass. Another constraint is provided by the broader limiting range of the disk luminosity that can be set by considering 10. The upper limit ensures the source to be sub-Eddington and the lower limit assumes the accretion disk is radiatively efficient. Furthermore, combining the observations from Swift-XRT, NuSTAR and Fermi, we can cover the X- and -ray portions of the spectrum. These parts of the SEDs are successfully reproduced by IC scattering of low energy photons produced externally to the jet.
Since in the adopted model the radiative energy densities of various AGN components are functions of the distance from the central engine, we are able to determine the location of the emission region. This is found to be at the outer edge of the BLR where a major fraction of the seed photons are supplied by the BLR clouds. The X-ray spectra of all three objects are extremely hard and observations further hint at the dominance of the EC process over SSC emission in this energy range (see, Ajello et al., 2016, for a detailed discussion). On the other hand, the -ray SEDs are steep, as expected in high redshift blazars. The spectral shapes observed at X-ray and -ray energies help constrain the slopes of the underlying broken power law electron energy distribution. Overall, the observed SED parameters of these three sources are similar to other high-redshift MeV blazars (e.g., Ghisellini et al., 2010).
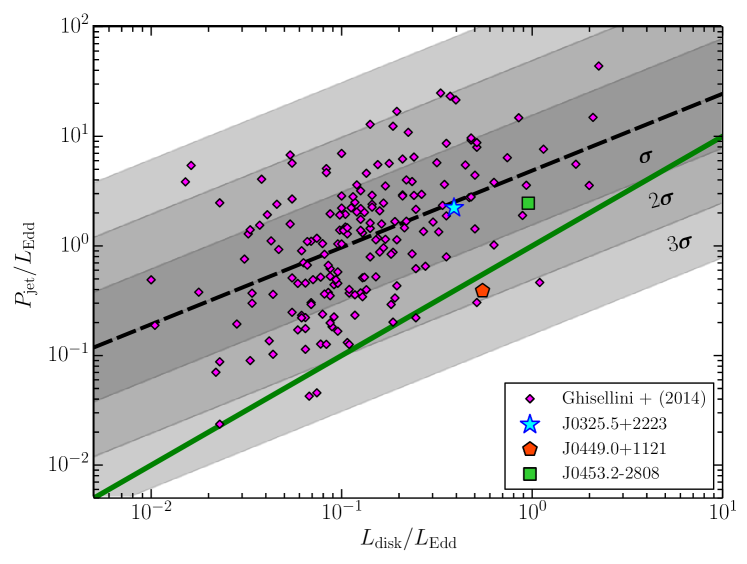
With good quality IR-optical (constraining the accretion disk emission) and hard X-ray--ray data (required for the accurate measurement of the jet power) in hand, it is interesting to compare the disk-jet connection observed in the three MeV blazars studied in this work with that for other blazars. With this in mind, we collect the jet powers and disk luminosities of all blazars studied by Ghisellini et al. (2014). In Figure 4, we plot the jet power as a function of the disk luminosity for blazars, including our three MeV sources. The plotted quantities are normalized for the central black hole mass. As can be seen, the majority of sources have normalized jet power exceeding their normalized disk luminosities (the one-to-one correlation is shown by the green solid line). 3FGL J0325.5+2223 and 3FGL J0453.22808 have their jet powers larger than their disk luminosities, though 3FGL J0449.0+1121 lies just below the one-to-one correlation. Indeed, among the three objects, this object has the least jet power. The jet powers of both 3FGL J0325.5+2223 and 3FGL J0453.22808 appear to be larger than the Eddington luminosity (). However, there are a few caveats. The existence of electron-positron pairs in the jet would reduce the jet power by / (where , see, Pjanka et al., 2017, for a detailed discussion), although their number could not greatly exceed the protons in order to avoid the Compton rocket effect that would otherwise stop the jet (Ghisellini & Tavecchio, 2010). Furthermore, the budget of the jet power can also come down if one considers a spine-sheath structured jet, instead of a one-zone uniform emission region (Sikora et al., 2016). Most importantly, the underestimation of the black hole mass can also lead to super-Eddington jet power. Consequently, one has to take into account these uncertainties and/or their combination before drawing any firm conclusion.
5 Conclusions
We studied three high redshift () MeV blazars using quasi-simultaneous GROND, Swift, NuSTAR, and Fermi-LAT data, focusing on the hard X-ray part uncovered by NuSTAR. With the latter and the aid of the Fermi-LAT data we were able to constrain the position of the IC peak and to derive related characteristics of these sources like bolometric luminosity, jet power as well as the relativistic particle distribution and the location of the emission region. Our primary findings are as follows
-
1.
All sources are significantly detected by NuSTAR and exhibit a flat (photon index ) X-ray spectrum extended up to 79 keV, as revealed from joint XRT and NuSTAR fitting.
-
2.
The broadband SEDs of these sources resembles that of powerful blazars with synchrotron and IC peaks lying at sub-mm and MeV energy ranges, respectively.
-
3.
The IR-optical spectra can be explained by a combination of synchrotron and accretion disk spectrum, whereas, high energy X-ray to -ray radiation is successfully reproduced by IC scattering of low energy photons mainly supplied by the BLR.
-
4.
The location of the emission region is found to be at the outer edge of the BLR in all three sources. The black hole masses for all three sources are greater than .
-
5.
Comparing the normalized jet powers and disk luminosities of these sources with that of a large sample of blazars, we find them to lie on the well known disk-jet correlation derived by Ghisellini et al. (2014) where their jet powers exceeds accretion disk luminosities. Only 3FGL J0449.0+1121 shows a slight offset from this correlation.
| Fermi-LAT | ||||||||
| Name | Time Covered | FluxaaIntegrated -ray flux in the GeV energy range in units of photons . | Photon IndexbbPhoton index calculated from -ray analysis. | Test StatisticccTest statistic is a measure of significance of detection (; Mattox et al., 1996). | ||||
| 3FGL J0325.52223 | 2015-03-012016-03-01 | 76.36 | ||||||
| 3FGL J0449.01121 | 2015-03-012016-03-01 | 229.62 | ||||||
| 3FGL J0453.22808 | 2015-03-012016-03-01 | 195.91 | ||||||
| NuSTAR Swift-XRT | ||||||||
| Name | Date | ddColumn density in units of . | Photon Index eePhoton index calculated from X-ray analysis. | Flux ffObserved flux in units of in the keV energy band. The errors are at the 90% level of confidence for one parameter of interest and the fluxes are corrected for the Galactic absorption. | C-Stat/dof | |||
| 3FGL J0325.52223 | 2015-11-08 | 643.74/823 | ||||||
| 3FGL J0449.01121 | 2015-12-02 | 291.47/331 | ||||||
| 3FGL J0453.22808 | 2015-12-03 | 625.66/769 | ||||||
| GROND | ||||||||
| Name | UT DateggExposure start time. | AB MagnitudehhCorrected for Galactic reddening. | ||||||
| 3FGL J0325.52223 | 2015-11-15.49 | |||||||
| 3FGL J0449.01121 | 2015-12-08.31 | |||||||
| 3FGL J0453.22808 | 2016-06-01.63 | |||||||
| ††footnotetext: Notes: | ||||||||
| Parameter | J0325.5+2223 | J0449.0+1121 | J0453.22808 |
| Slope of the particle distribution below the break energy () | 1.45 | 1.55 | 1.95 |
| Slope of the particle distribution above the break energy () | 3.9 | 4.15 | 4.1 |
| Magnetic field in Gauss () | 3.2 | 1.5 | 2.5 |
| Particle energy density in erg cm-3 () | 0.03 | 0.01 | 0.01 |
| Bulk Lorentz factor () | 10 | 12 | 10 |
| Minimum Lorentz factor () | 1 | 6 | 1 |
| Break Lorentz factor () | 57 | 310 | 139 |
| Maximum Lorentz factor () | 3e3 | 3e3 | 3e3 |
| Dissipation distance in parsec () | 0.18 (3090) | 0.23 (4850) | 0.37 (3900) |
| Size of the BLR in parsec (in ) | 0.18 (3091) | 0.19 (4006) | 0.35 (3709) |
| Black hole mass in log scale, in units of solar mass () | 8.8 | 8.7 | 9.0 |
| Accretion disk luminosity in log scale (, erg s-1) | 46.48 | 46.54 | 47.08 |
| Accretion disk luminosity in Eddington units () | 0.40 | 0.56 | 0.95 |
| Characteristic temperature of IR-torus in Kelvin () | 500 | 500 | 500 |
| Observed variability time scale in days () | 4 | 5 | 10 |
| Jet power in electrons in log scale (, erg s-1) | 44.87 | 44.52 | 44.90 |
| Jet power in magnetic field in log scale (), erg s-1 | 46.06 | 45.79 | 46.49 |
| Radiative jet power in log scale (, erg s-1) | 45.74 | 45.60 | 45.92 |
| Jet power in protons in log scale (, erg s-1) | 47.18 | 46.15 | 47.43 |
| 3FGL J0325.52223 | 3FGL J0449.01121 | 3FGL J0453.22808 | |
|---|---|---|---|
| () | |||
| () |
References
- Acero et al. (2015) Acero, F., Ackermann, M., Ajello, M., et al. 2015, ApJS, 218, 23
- Acero et al. (2016) Acero, F., Ackermann, M., Ajello, M., et al. 2016, The Astrophysical Journal Supplement Series, 223, 26
- Ackermann et al. (2012) Ackermann, M., Ajello, M., Ballet, J., et al. 2012, ApJ, 751, 159
- Ackermann et al. (2013) Ackermann, M., Ajello, M., Albert, A., et al. 2013, ApJ, 771, 57
- Ackermann et al. (2015) Ackermann, M., Ajello, M., Atwood, W. B., et al. 2015, ApJ, 810, 14
- Aihara et al. (2011) Aihara, H., Allende Prieto, C., An, D., et al. 2011, ApJS, 193, 29
- Ajello et al. (2009) Ajello, M., Costamante, L., Sambruna, R. M., et al. 2009, ApJ, 699, 603
- Ajello et al. (2016) Ajello, M., Ghisellini, G., Paliya, V. S., et al. 2016, ApJ, 826, 76
- Atwood et al. (2013) Atwood, W., Albert, A., Baldini, L., et al. 2013, arXiv:1303.3514, arXiv:1303.3514
- Atwood et al. (2009) Atwood, W. B., Abdo, A. A., Ackermann, M., et al. 2009, ApJ, 697, 1071
- Begelman & Sikora (1987) Begelman, M. C., & Sikora, M. 1987, ApJ, 322, 650
- Blandford & Rees (1978) Blandford, R. D., & Rees, M. J. 1978, Phys. Scr, 17, 265
- Bloemen et al. (1995) Bloemen, H., Bennett, K., Blom, J. J., et al. 1995, A&A, 293
- Burrows et al. (2005) Burrows, D. N., Hill, J. E., Nousek, J. A., et al. 2005, Space Sci. Rev., 120, 165
- Cash (1979) Cash, W. 1979, ApJ, 228, 939
- Celotti & Ghisellini (2008) Celotti, A., & Ghisellini, G. 2008, MNRAS, 385, 283
- Celotti et al. (2007) Celotti, A., Ghisellini, G., & Fabian, A. C. 2007, MNRAS, 375, 417
- Dermer & Giebels (2016) Dermer, C. D., & Giebels, B. 2016, Comptes Rendus Physique, 17, 594
- Fossati et al. (1999) Fossati, G., Celotti, A., Ghisellini, G., & Maraschi, L. 1999, in Astronomical Society of the Pacific Conference Series, Vol. 159, BL Lac Phenomenon, ed. L. O. Takalo & A. Sillanpää, 351
- Fossati et al. (1998) Fossati, G., Maraschi, L., Celotti, A., Comastri, A., & Ghisellini, G. 1998, MNRAS, 299, 433
- Frank et al. (2002) Frank, J., King, A., & Raine, D. J. 2002, Accretion Power in Astrophysics, by Juhan Frank and Andrew King and Derek Raine, pp. 398. ISBN 0521620538. Cambridge, UK: Cambridge University Press, February 2002
- Fricke et al. (1983) Fricke, K. J., Kollatschny, W., & Witzel, A. 1983, A&A, 117, 60
- Ghisellini (2013) Ghisellini, G. 2013, Mem. Soc. Astron. Italiana, 84, 719
- Ghisellini et al. (1998) Ghisellini, G., Celotti, A., Fossati, G., Maraschi, L., & Comastri, A. 1998, MNRAS, 301, 451
- Ghisellini & Tavecchio (2009) Ghisellini, G., & Tavecchio, F. 2009, MNRAS, 397, 985
- Ghisellini & Tavecchio (2010) —. 2010, MNRAS, 409, L79
- Ghisellini & Tavecchio (2015) —. 2015, MNRAS, 448, 1060
- Ghisellini et al. (2014) Ghisellini, G., Tavecchio, F., Maraschi, L., Celotti, A., & Sbarrato, T. 2014, Nature, 515, 376
- Ghisellini et al. (2010) Ghisellini, G., Della Ceca, R., Volonteri, M., et al. 2010, MNRAS, 405, 387
- Ghisellini et al. (2011) Ghisellini, G., Tagliaferri, G., Foschini, L., et al. 2011, MNRAS, 411, 901
- Greiner et al. (2008) Greiner, J., Bornemann, W., Clemens, C., et al. 2008, PASP, 120, 405
- Harrison et al. (2013) Harrison, F. A., Craig, W. W., Christensen, F. E., et al. 2013, ApJ, 770, 103
- Johnson & Haardt (2016) Johnson, J. L., & Haardt, F. 2016, PASA, 33, e007
- Kalberla et al. (2005) Kalberla, P. M. W., Burton, W. B., Hartmann, D., et al. 2005, A&A, 440, 775
- Komatsu et al. (2009) Komatsu, E., Dunkley, J., Nolta, M. R., et al. 2009, ApJS, 180, 330
- Konigl (1981) Konigl, A. 1981, ApJ, 243, 700
- Krühler et al. (2008) Krühler, T., Küpcü Yoldaş, A., Greiner, J., et al. 2008, ApJ, 685, 376
- Madsen et al. (2015) Madsen, K. K., Harrison, F. A., Markwardt, C. B., et al. 2015, ApJS, 220, 8
- Mattox et al. (1996) Mattox, J. R., Bertsch, D. L., Chiang, J., et al. 1996, ApJ, 461, 396
- Paliya et al. (2016) Paliya, V. S., Parker, M. L., Fabian, A. C., & Stalin, C. S. 2016, ApJ, 825, 74
- Pjanka et al. (2017) Pjanka, P., Zdziarski, A. A., & Sikora, M. 2017, Monthly Notices of the Royal Astronomical Society, 465, 3506
- Romani et al. (2004) Romani, R. W., Sowards-Emmerd, D., Greenhill, L., & Michelson, P. 2004, ApJ, 610, L9
- Roming et al. (2005) Roming, P. W. A., Kennedy, T. E., Mason, K. O., et al. 2005, Space Sci. Rev., 120, 95
- Sbarrato et al. (2013) Sbarrato, T., Tagliaferri, G., Ghisellini, G., et al. 2013, ApJ, 777, 147
- Sbarrato et al. (2016) Sbarrato, T., Ghisellini, G., Tagliaferri, G., et al. 2016, MNRAS, 462, 1542
- Schlafly & Finkbeiner (2011) Schlafly, E. F., & Finkbeiner, D. P. 2011, ApJ, 737, 103
- Shakura & Sunyaev (1973) Shakura, N. I., & Sunyaev, R. A. 1973, A&A, 24, 337
- Shaw et al. (2012) Shaw, M. S., Romani, R. W., Cotter, G., et al. 2012, ApJ, 748, 49
- Shen et al. (2011) Shen, Y., Richards, G. T., Strauss, M. A., et al. 2011, ApJS, 194, 45
- Sikora et al. (1997) Sikora, M., Madejski, G., Moderski, R., & Poutanen, J. 1997, ApJ, 484, 108
- Sikora et al. (2016) Sikora, M., Rutkowski, M., & Begelman, M. C. 2016, MNRAS, 457, 1352
- Skrutskie et al. (2006) Skrutskie, M. F., Cutri, R. M., Stiening, R., et al. 2006, AJ, 131, 1163
- Stickel et al. (1991) Stickel, M., Padovani, P., Urry, C. M., Fried, J. W., & Kuehr, H. 1991, ApJ, 374, 431
- Stocke et al. (1991) Stocke, J. T., Morris, S. L., Gioia, I. M., et al. 1991, ApJS, 76, 813
- Tagliaferri et al. (2015) Tagliaferri, G., Ghisellini, G., Perri, M., et al. 2015, ApJ, 807, 167
- Urry & Padovani (1995) Urry, C. M., & Padovani, P. 1995, PASP, 107, 803
- Vestergaard & Peterson (2006) Vestergaard, M., & Peterson, B. M. 2006, ApJ, 641, 689