ArXiv, Mar 2017 \Archive \PaperTitleRoom temperature bulk diamond 13C hyperpolarisation – Strong evidence for a complex four spin coupling\AuthorsRalf Wunderlich1*, Jonas Kohlrautz1, Bernd Abel2, Jürgen Haase1 and Jan Meijer1 \KeywordsHyperpolarization — NV centre — Diamond \Abstract Hyperpolarisation at room temperature is one of the most important research fields in order to improve liquid, gas or nanoparticle tracer for Magnetic Resonance Imaging (MRI) in medical applications. In this paper we utilize nuclear magnetic resonance (NMR) to investigate the hyperpolarisation effect of negatively charged nitrogen vacancy (NV) centres on carbon-13 nuclei and their spin diffusion in a diamond single crystal close to the excited state level anti crossing (ESLAC) around . Whereas the electron spins of the NV centre can be easily polarized in its m = 0 ground state at room temperature just by irradiation with green light , the swop of the NV electron spin polarization to a carbon-13 nuclei is a complex task. We found that the coupling between the polarized NV electron spin, the electron spin of a substitutional nitrogen impurity (P1) as well as its nitrogen-14 nuclei and the carbon-13 nuclear spin has to be considered. Here we show that through an optimization of this procedure, in about two minutes a signal to noise ratio which corresponds to a 23 hour standard measurement without hyperpolarisation and an accumulation of 460 single scans can be obtained. Furthermore we were able to identify several polarisation peaks of different sign at different magnetic fields in a region of some tens of gauss. Most of the peaks can be attributed to a coupling of the NV centres to nearby P1 centres. We present a new theoretical model in a framework of cross polarisation of a four spin dynamic model in good agreement with our experimental data. The results demonstrate the opportunities and power as well as limitations of hyperpolarisation in diamond via NV centres. We expect that the current work may have a significant impact on future applications.
Introduction
Magnetic resonance tomography (MRT) is one of the most important tools of today’s modern medicine diagnostics. Nuclear Magnetic Resonance (NMR) in general benefits from high spectral resolution but suffers of low sensitivity which is in a spin system proportional to the spin polarisation and the number of spins . Due to the Boltzmann distribution this fraction is just at room temperature and standard conditions in humane medicine. An enhancement of this factor is directly related to the lateral resolution and could increase the quality of MRT by orders of magnitude. MRT is based mainly on the visualization and the dynamics of proton spins. However in the last century a large number of new tracers have been tested in order to visualize dynamic processes inside the body. Functionality tests using hyperpolarised 3He or 129Xe nuclei in the gas phase for lung cancer is an example and routinely applied nowadays but still under research and development [17]. In contrast the electron spin of a negativly charged nitrogen vacancy (NV) centre, consisting of a substitutional nitrogen atom next to a vacancy in the diamond lattice, can be nearly polarized to by irradiation with green light [4]. Common goal of a number of research groups is the transfer of the electron polarisation to nuclear spins. The NV centre - carbon-13 nucleus structure is an outstanding model system which combines the possibility of a nearly fully polarised electron spin reservoir and a easy to measure nuclear spin species. In thermal equilibrium the polarisation is given by and a brute force method to enhance the signal is cooling down the spin system. This can be combined with the optical induced polarisation of the the NV centre in high magnetic fields which also leads to a non-equilibrium spin polarisation of C-13 nuclei in diamond [15, 21]. Also more sophisticated microwave driven nuclear polarisation (DNP) techniques in the manner of Overhauser [19] like the solid effect (SE) [10] the cross effect (CE) [11] or the thermal mixing [12] can be used and are already combined with the properties of NV centres [26, 20, 2]. An approach without additional micro wave appliancation to overcome the low signal to noise ratio (SNR) is to deploy the hyperfine or dipole interaction between a polarised and an unpolarised spin system. This was done in Ref. [5, 6] in which the authors attribute their polarisation effect to the exited state level anti-crossing (ESLAC), which takes place at around . Previous optical hole-bleaching experimenal studies reported already cross polarisation of negatively charged NV and substitutional nitrogen (P1) centres by field dependent absorption messurements with a narrow-band laser [9]. However this technique could not distingush between up or down polarisation and disregarding nuclear spins. More recently this effect was published for single NV centres as well as for neutral NV centres detected by Optical Detected Magnetic Resonance (ODMR) [7, 3, 25]. Both consider only coupling between the electron spins. To exploit the nuclear hyperpolarisation effect we use a modified NMR system. With this approach we are sensitive to carbon-13 spins including those far away from all ODMR-active centres and other defects.
1 Methods
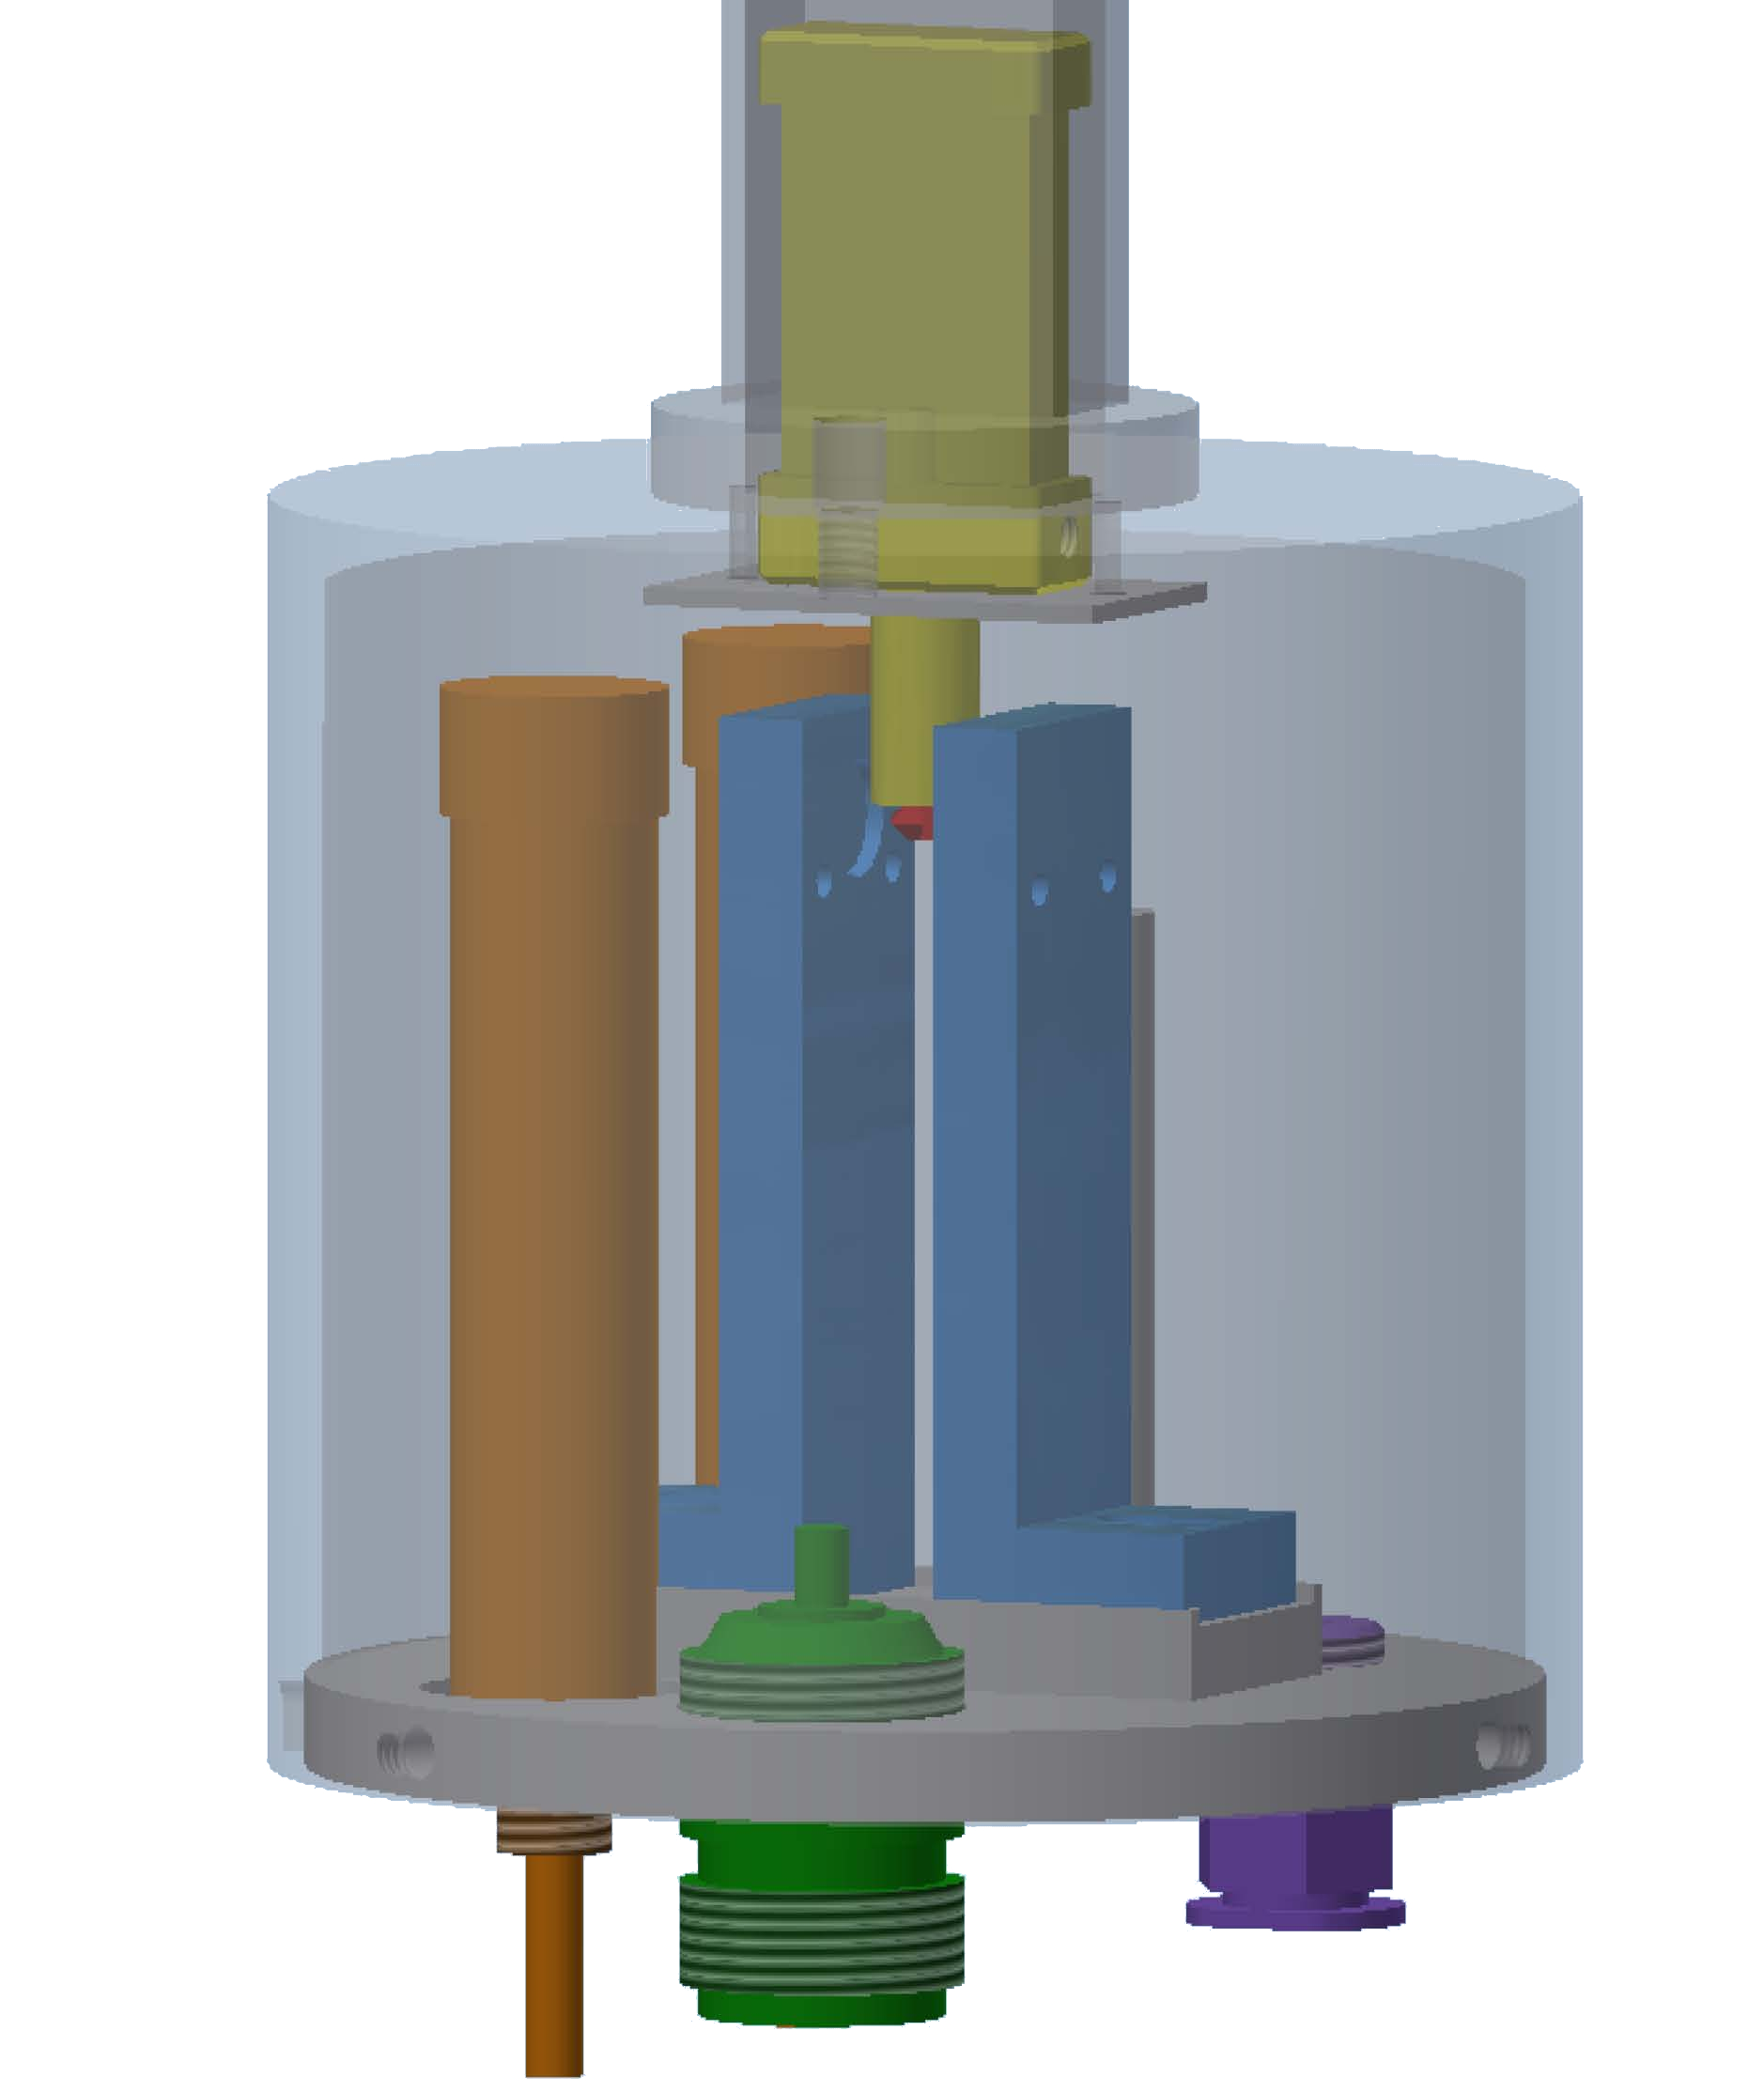
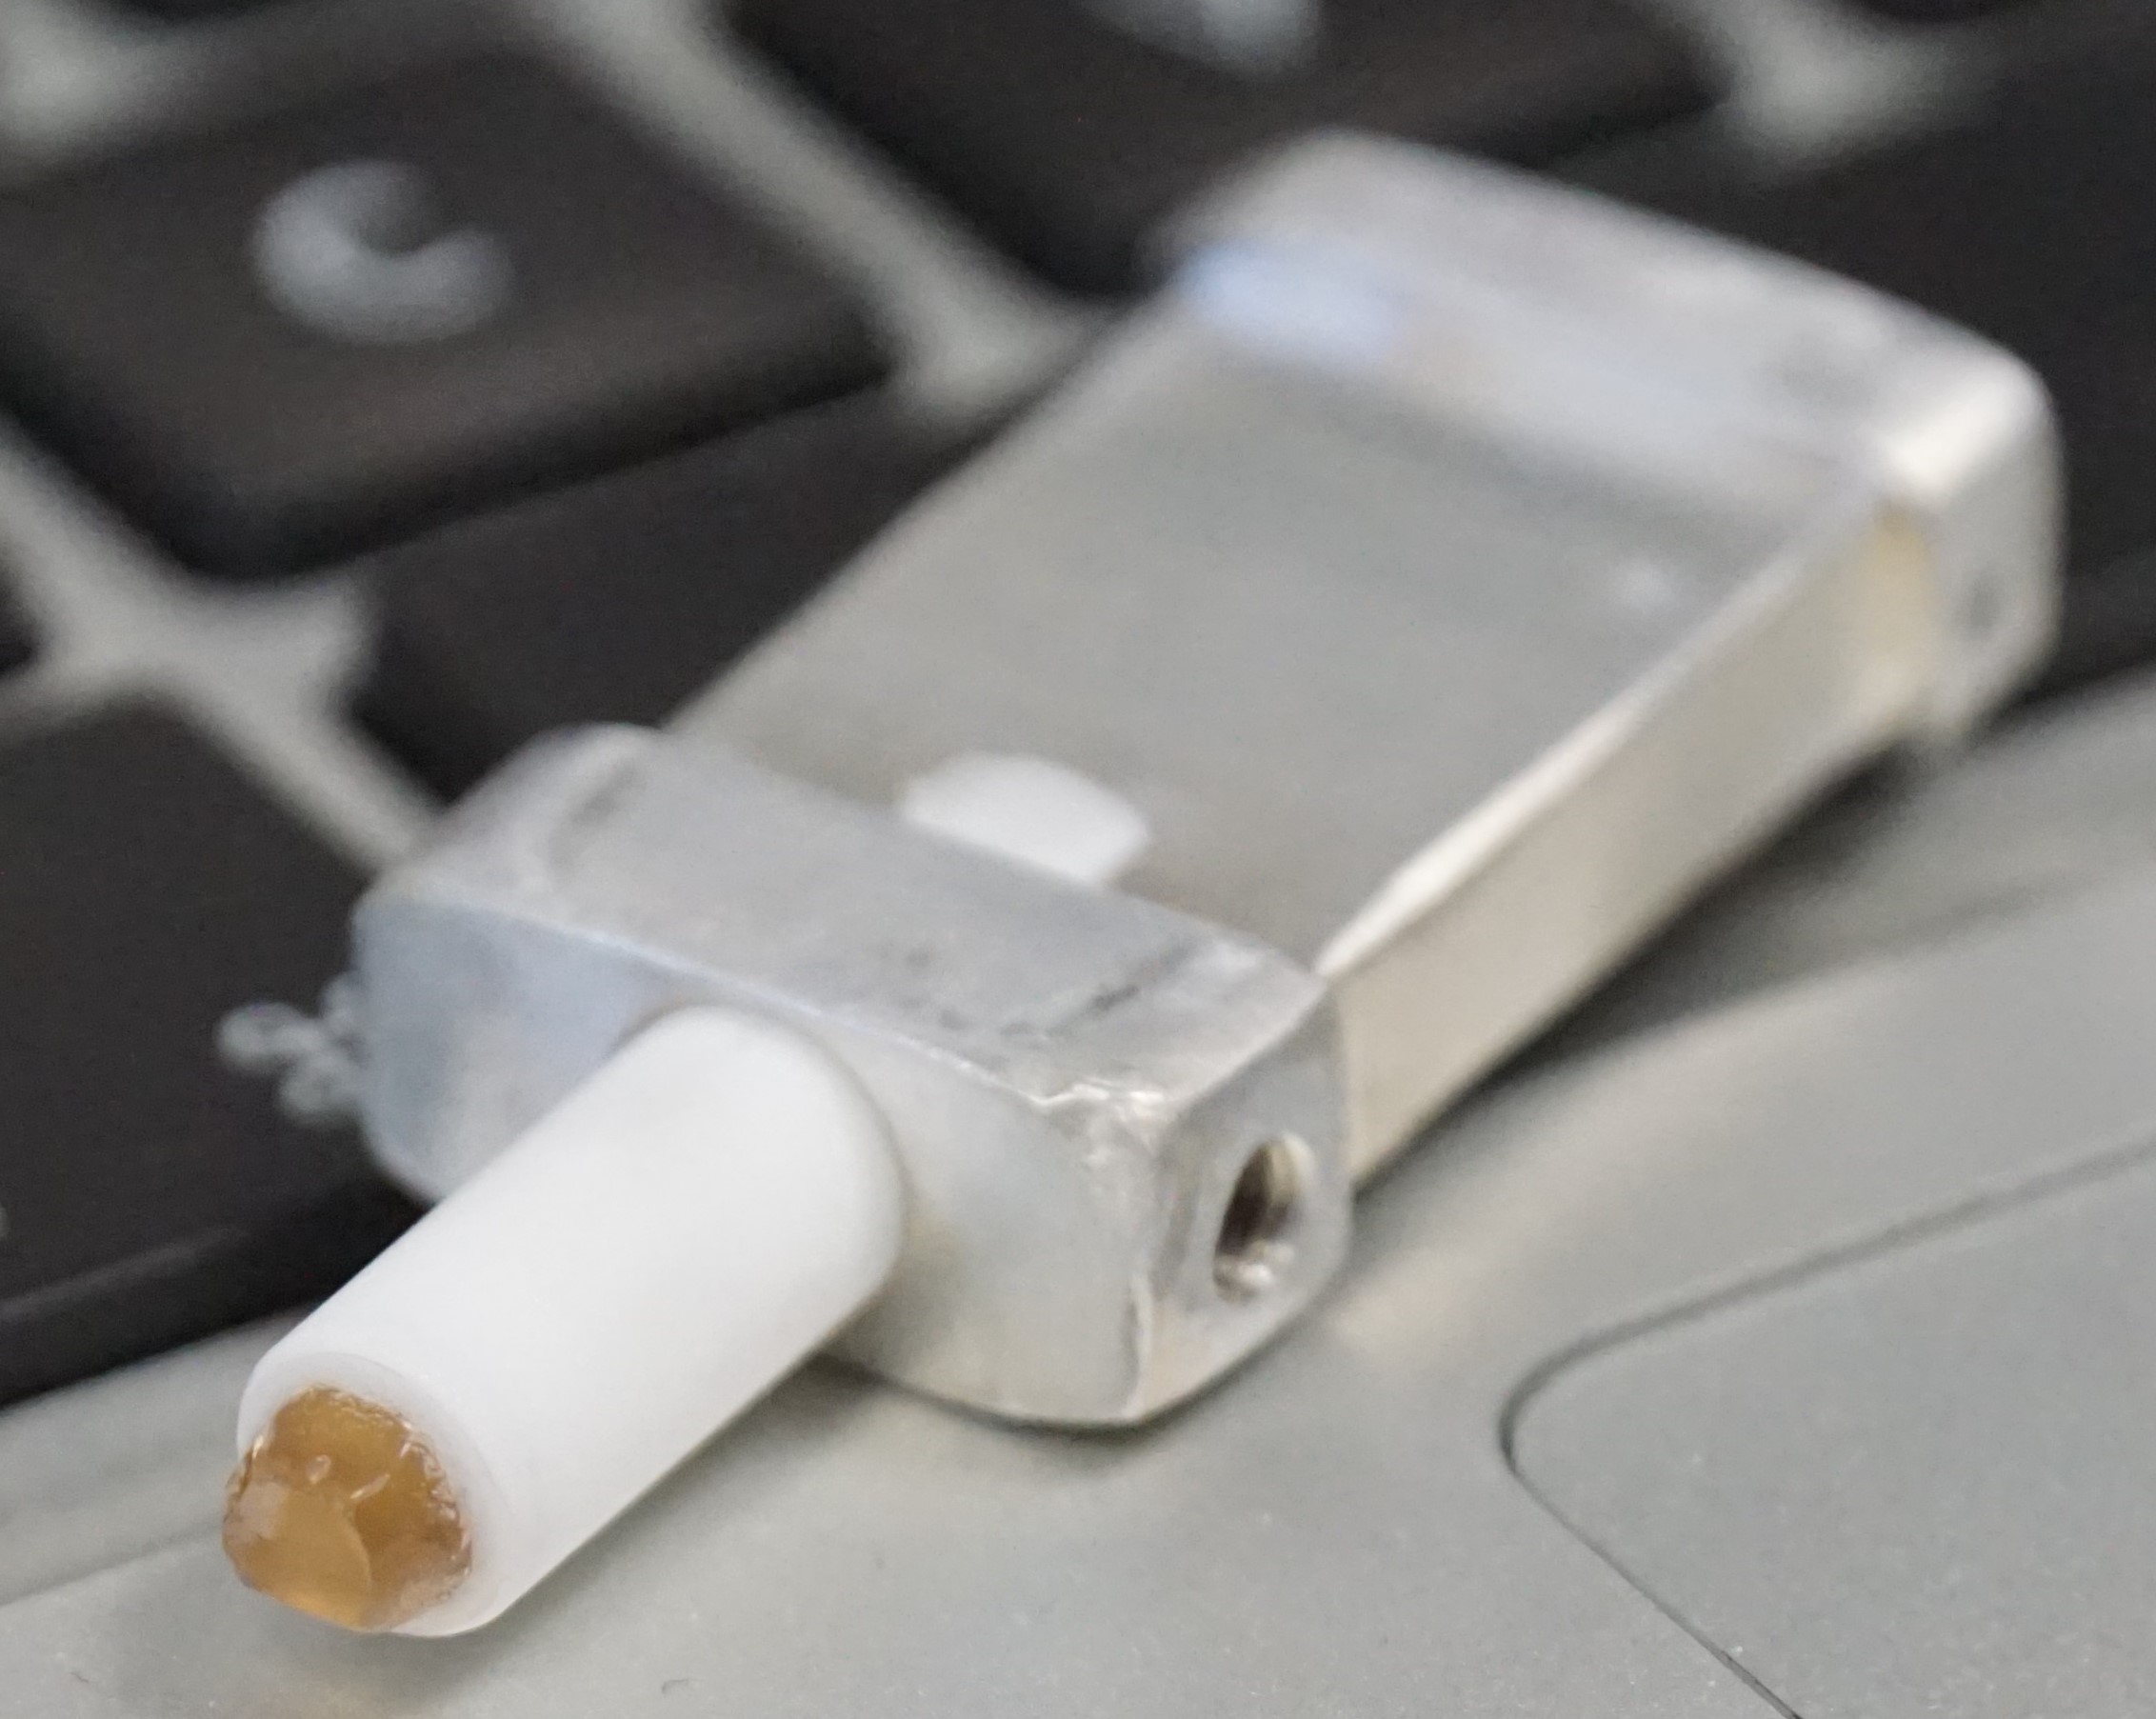
A home-made Helmholtz coil in combination with a programmable power supply provides a constant low magnetic field with a stability of about . The diamond sample is fixed on a metal shuttle and aligned with one of the four NV axes along the magnetic field vector. For the NV polarisation we use a laser with a power up to . The laser light is guided through a core multimode optical fiber with an numerical aperture of . The SMA905 connector at the end of the fiber is screwed several millimeters before the sample (Fig. 1).
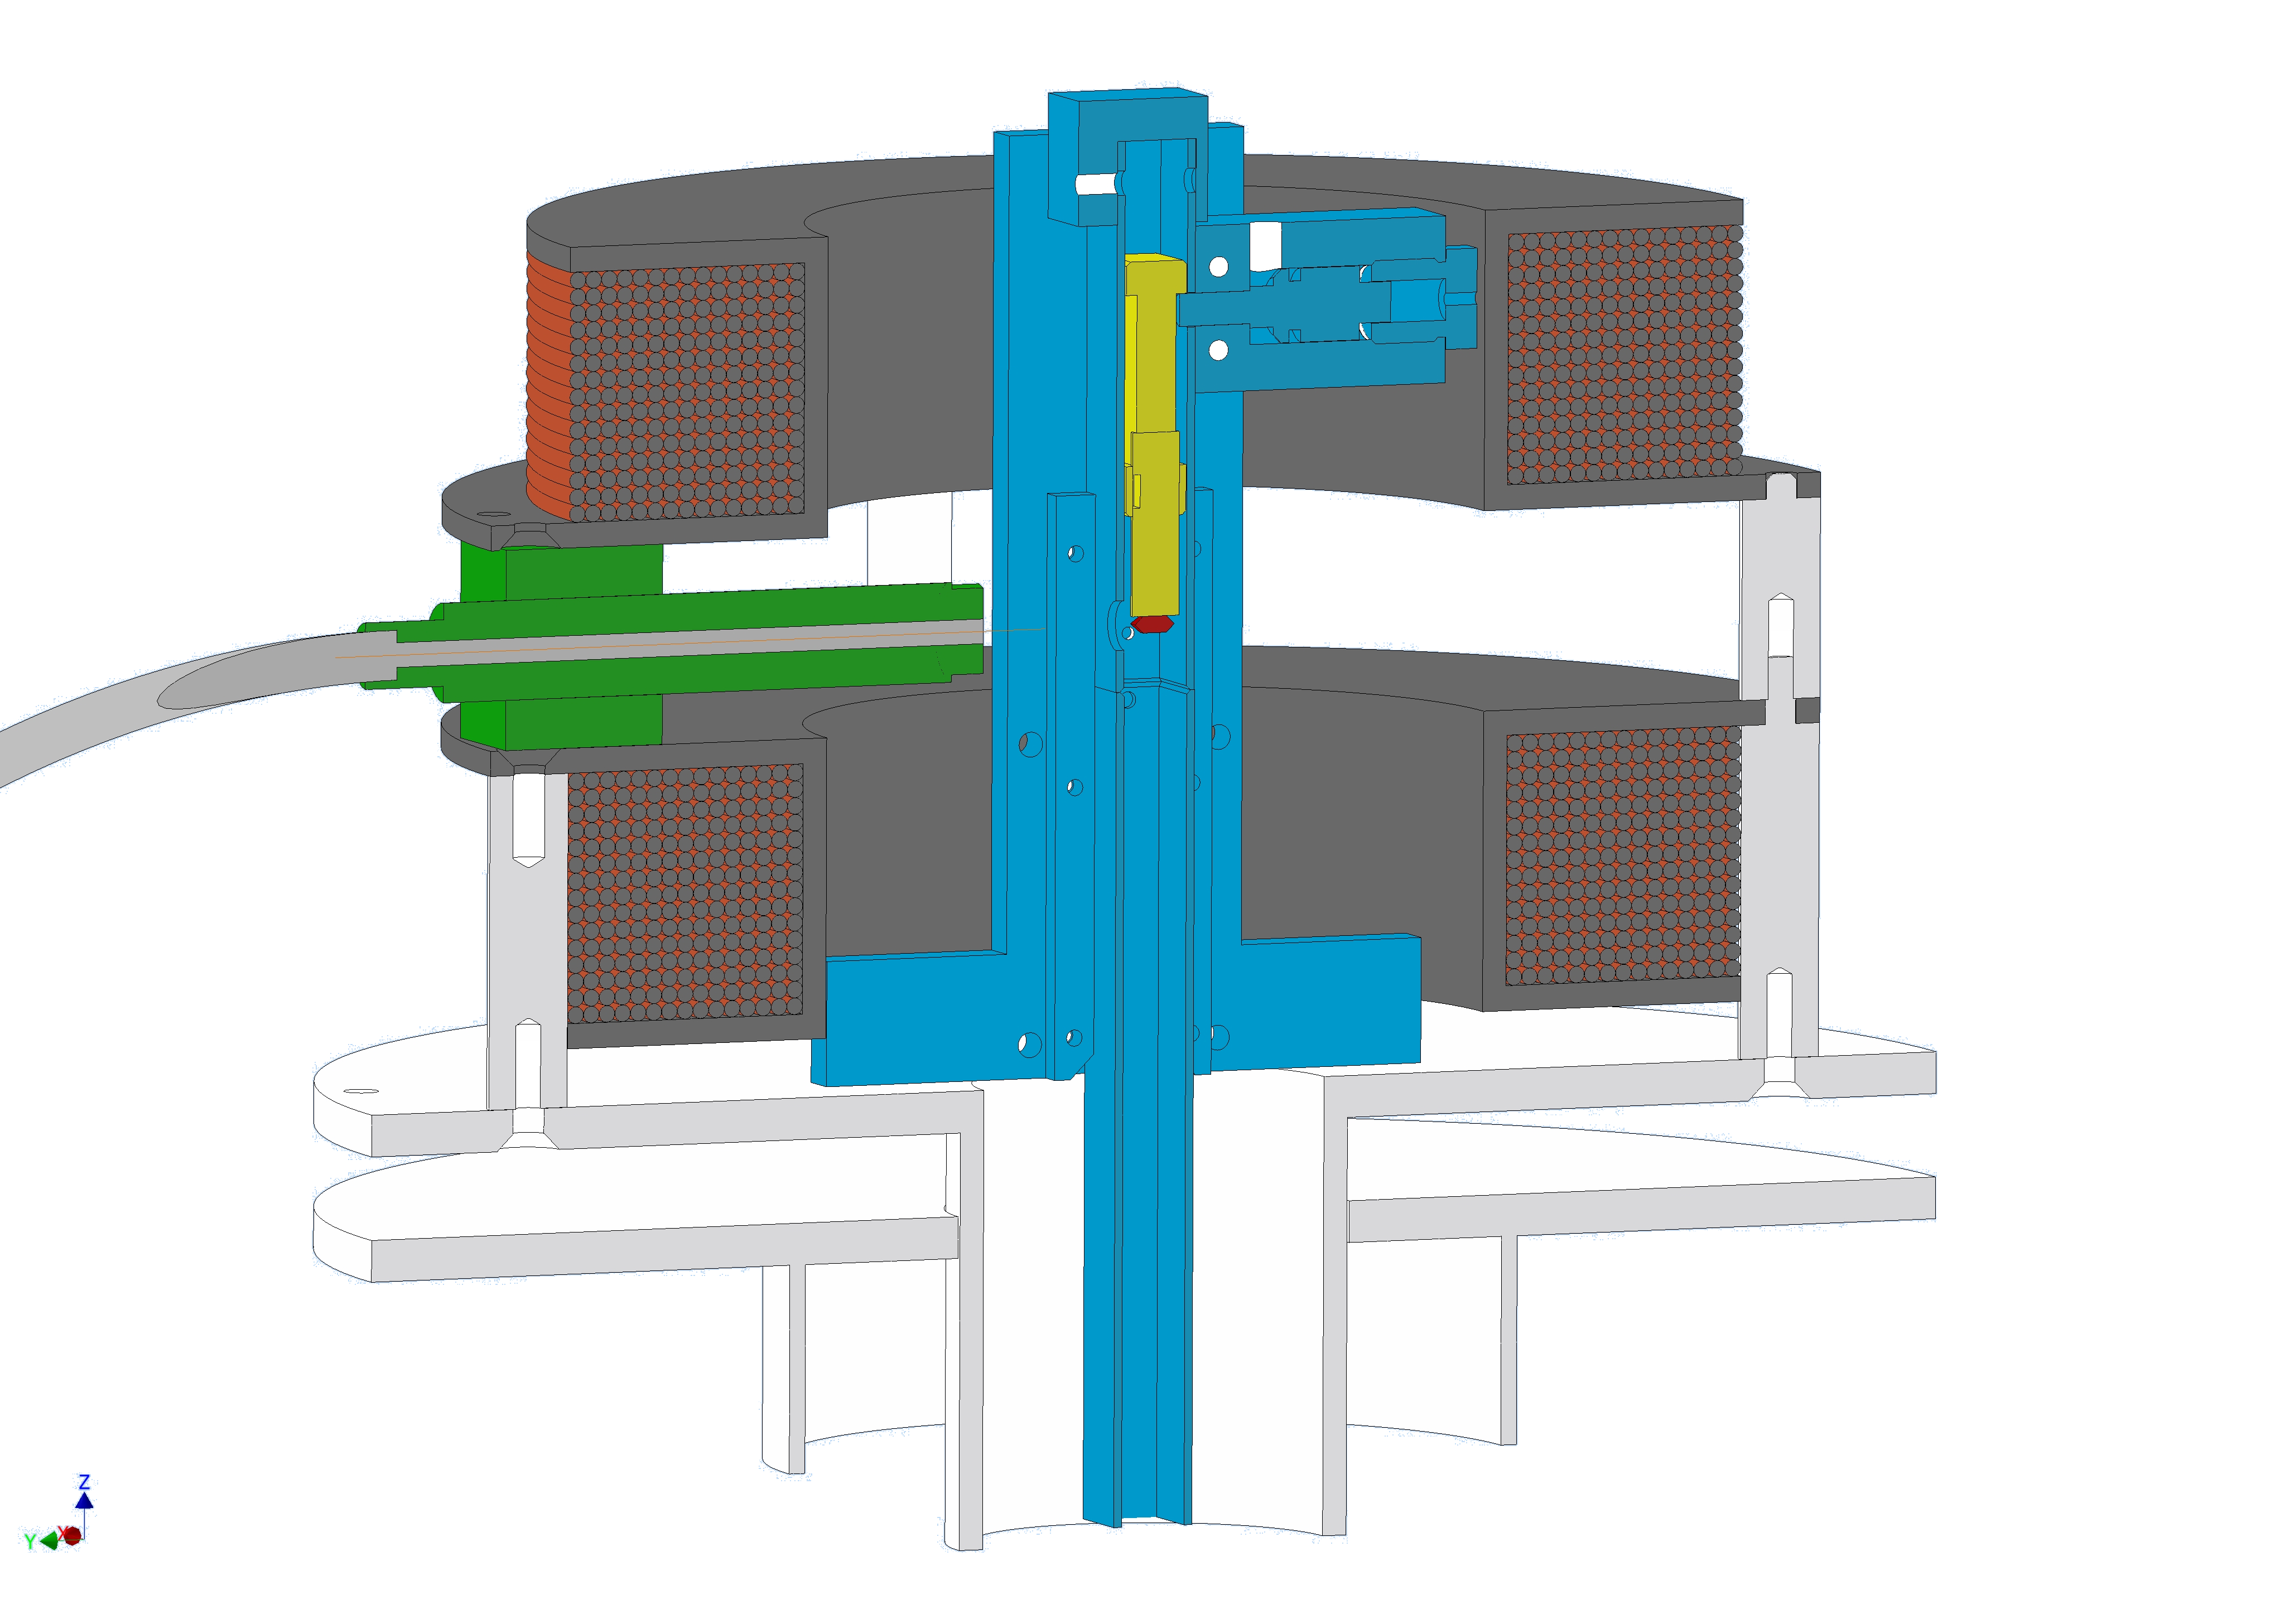
The shuttle is guided inside a rectangular hollow profile from the low field coils to a probehead in the middle of a commercial superconducting NMR magnet. After a shuttling duration of about one second the sample is placed between a pair of Helmholtz-like RF coils with a diameter of fixed on a ceramic frame. Subsequently a pulse of is applied and the NMR signal of the C-13 spins is recorded.
Afterwards the shuttle is lifted up via a pneumatic system back into the radiation unit and is fixed. After short cooling by several air jets the next run with different settings e.g. magnetic field or laser duration starts completely automatically.
This enables a systematic and reproducible investigation of the hyperpolarisation process.
In comparison to ODMR techniques the presented approach allows the observation of the polarisation effect of nuclei far away from the ODMR active centre. This is in particular important to investigate spin diffusion processes in solids and consequently a development of an overall bulk polarisation and application.
All measurements were performed with a commercially available HPHT diamond sample from Element Six with dimensions of about mm3 and a naturally abundance of C-13 isotopes moreover a nitrogen content of ppm. After a electron irradiation with a fluence of the sample was annealed at for (tab.1).
| ID 179 (111)-diamond | ||
| property | value | unit |
| mass | 0.0738 | |
| N content | 100 - 200 | ppm |
| C-13 content | ||
| e- irradiation fluence | ||
| annealing temperature | ||
| annealing time | ||
During irradiation the sample reaches a maximal temperature of about . Before and after each preparation step an photoluminescence spectrum was taken during a x-y-Scan below the sample surface in a self-made confocal microscope with an air objective MPlanoApo /0.95 from Olympus to monitor the NV creation and its density. For excitation we use a Nd:YAG Laser and the spectrometer containing a grid as monochromator from Jobin Yvon with a CCD sensor of .
2 Results and Discussion
2.1 Optical Spectrum
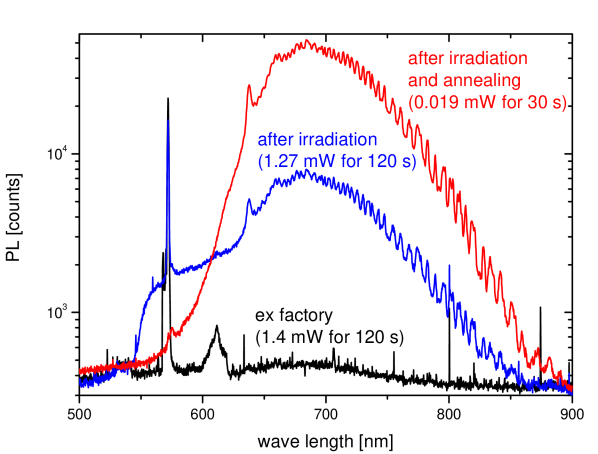
Figure 2 shows three different photo luminescence (PL) spectra each after specific preparation step. For the original sample ex factory (black) just the Raman peak at , a second feature at about and no NV signal is noticeable. The peak is actually known as PL from some natural type I diamonds [27]. After electron irradiation a clear zero phonon line (ZPL) at with its characteristic side bands arises and the peak disappears (blue). Besides the Raman peak a small at was vaguely perceptible. Subsequent annealing leads to an massive boost in the NV signal (red). Please note while the spectrum for the untreated (black) and electron irradiated (blue) sample is recorded under similar conditions apparent from similar heights of the Raman peaks the spectrum after annealing (red) is recorded four times shorter and with only of the laser power. This corresponds to a factor of in signal intensity and therefore NV density compared to the sample that was untreated and not annealed.
2.2 NMR measurements
All presented measurements were conducted at ambient conditions and the noise was checked to be thermal. First we estimate the pulse length with a nutation experiment at about to with a carrier frequency of . Figure 4 depicts the integral NMR signal intensity depending on the magnetic field during laser irradiation and a shuttling into the NMR probe within about one second.
One representative spectrum of the acquired spectra and the corresponding thermal spectrum are plotted in Fig. 3. Both spectra were fitted to a Gaussian function. The thermal spectrum (a) has a linewidth (FWHM) of and the hyper-polarised one has a smaller width of , both based on the fits. However at least the hyperpolarised spectrum has an ever narrower linewidth slightly below this value regarding the raw data. This discrepancy can be explained with the rather short last delay of due to the requirement of an adequate accumulation time in the thermal case compared to the measured spin-lattice relaxation time of some hours (see below). This means that in the thermal experiment we measure the C-13 nuclei with shorter T1 times in proximity to impurities like P1 centres which are indeed present all over the investigated sample (see nitrogen content in Tab.1). The narrow line width in the hyper-polarised case can be compared with theoretical calculation of the line width of C-13 nuclei solely dipolar coupled to each other. An estimation for homonuclear dipolar coupling by numerical simulations lead to a linewidth of maximal based on the second moment for a Gaussian line shape [1, 22]. We also performed hyper-polarised Hahn spin echo measurements via phase cycling to determine the spin-spin relaxation time, but we could not record any signal. The inset in Fig. 3 shows an average solid/dipolar echo signal of scans in a phase cycling experiment in the time domain with between the two pulses. As an evidence for dipolar coupling of C-13 spins a refocusing of the signal can be observed at [16].
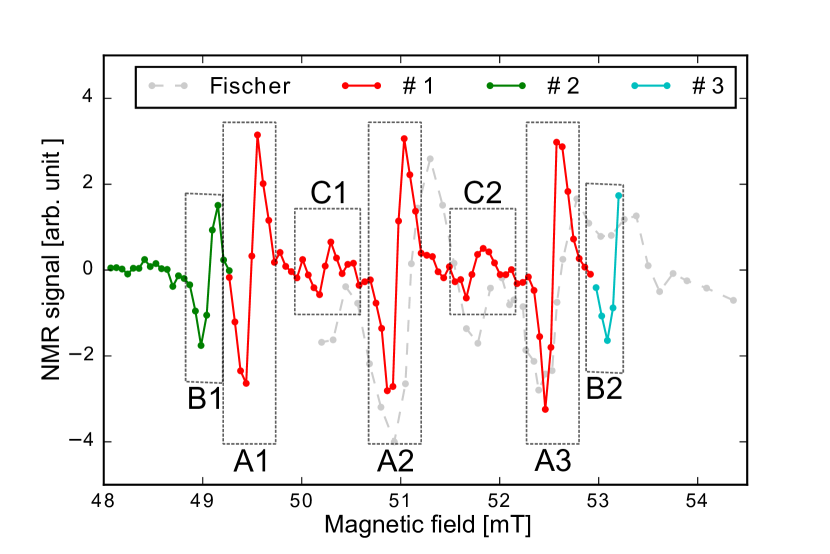
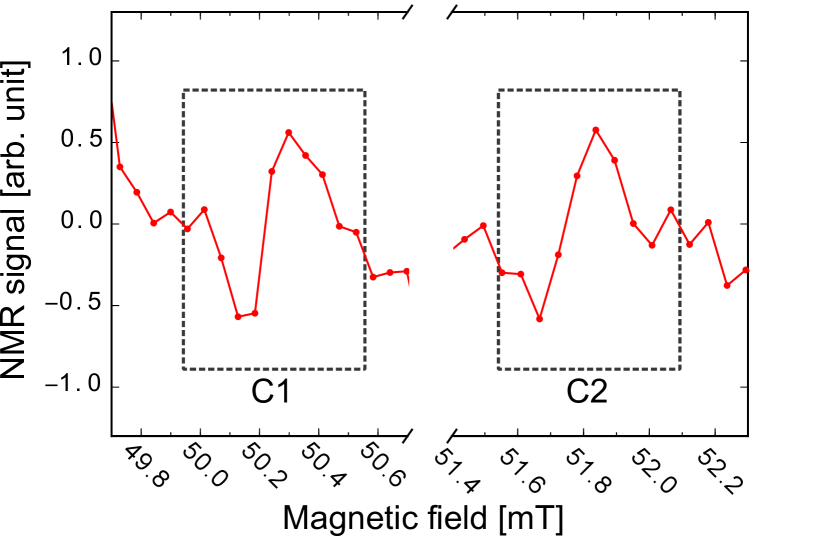
The field-dependence of the signal displays a non-trivial behaviour of pronounced peaks and sign changes (Fig. 4). We subdivide these peaks in three classes A, B and C. The peaks of A and B can be understood if one takes into account coupling and therefore cross relaxation between the NV-carbon-13 systems and the P1-N14 systems. The energy matching between these two systems at a certain magnetic field due to each Zeeman splitting leads to a resonant coupling and consequently a cross relaxation (Hartmann-Hahn condition)[8]. A P1 centre experiences a hyperfine coupling to its intrinsic 14N nuclei spin (=1). Due to a Jahn-Teller distortion towards one neigboring carbon atom this coupling depends on the direction of the applied magnetic field [23]. Under our experimental conditions P1 centres can be divided in two groups. One is aligned in direction and the other is one oriented under an angle of about relative to the magnetic field. The latter one displays a weaker hyperfine coupling to their 14N nuclei. The smaller peaks (B) can be associated with coupling between NV centres and P1 centres both aligned parallel to the applied field where the electron spin polarisation of the NV centres is most efficient. The case of coupling between an aligned NV centre with an unaligned P1 centre is three times more likely due to the three equivalent orientations in the diamond lattice. The peaks of the group A correspond to such a coupling and are therefore roughly three times higher than that ones of group B. A closer look at the data represented in Fig. 4 suggests a similar but much weaker signal (C) between the peaks of highest intensity. To support this we measured this field region twice under the same experimental conditions to enhance the signal to noise ratio (Fig. 5). The origin of these peaks is unclear. It could result from other spin species in the sample or 15N () associated P1 centres. The latter case would in principal explain the position and shape of this peaks but not its intensity which should be about times weaker than the peaks referring to the 14N-P1 centres due to the natural abundance. Unlikely this hyperpolarisation signal could also be induced from the ESLAC. For detailed account and explanation see the theory and simulation section below. Furthermore, the sharp resonances in the polarisation may suggest that just those carbon-13 nuclei, which are weakly coupled to the NV centre, can transport their spin polarisation to neighboring spins. Otherwise the NMR signal should be detected over a broader field range. In this picture a “frozen“core of strongly coupled and polarised spins surrounding the NV centre. These spins are commonly probed in ODMR experiment and show a spin polarisation in much broader field regions [13, 24]. Apparently, the Larmor frequencies of neighbouring spins in this region differ to much for a resonant spin exchange. Thus the carbon nuclei in a more or less well defined shell-like region around the NV centre can pass on their spin polarisation into the bulk via the nuclear dipole network [14]. Additionally it is statistically more unlikely to have a carbon-13 spin next to the NV centre than at some distance.
For time resolved measurement of the hyperpolarisation effect, we choose the negative peak at in field region A1 in Fig. 4. The experimental procedure for each experiment is illustrated schematically next to the corresponding plot in Fig. 6. To find the characteristic pumping time, the sample was irradiated in the corresponding field with constant power but different duration. Afterwards the sample was shuttled in the NMR probe and the pulse was applied immediately (Fig. 6a). The characteristic pumping time in this experiment was determined to about .
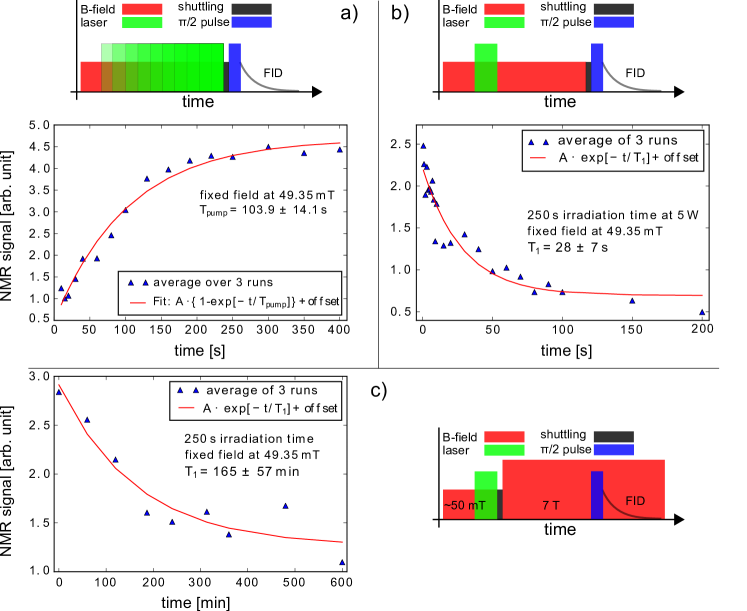
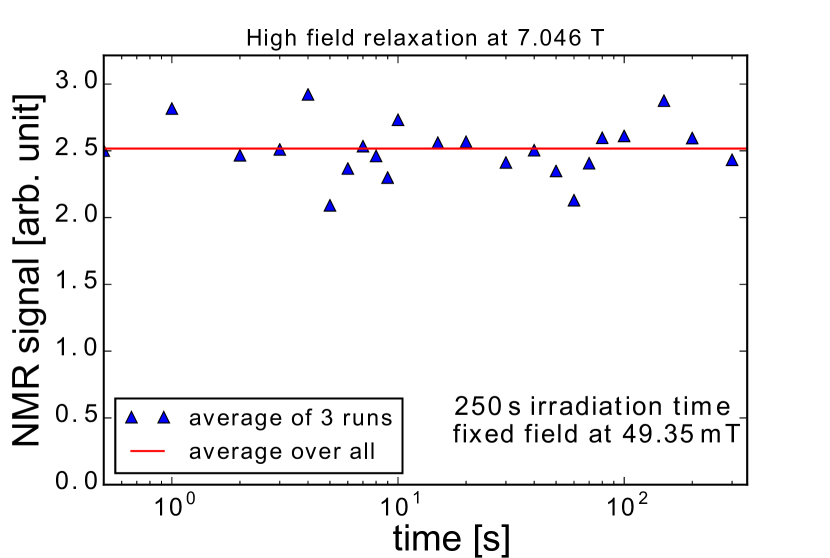
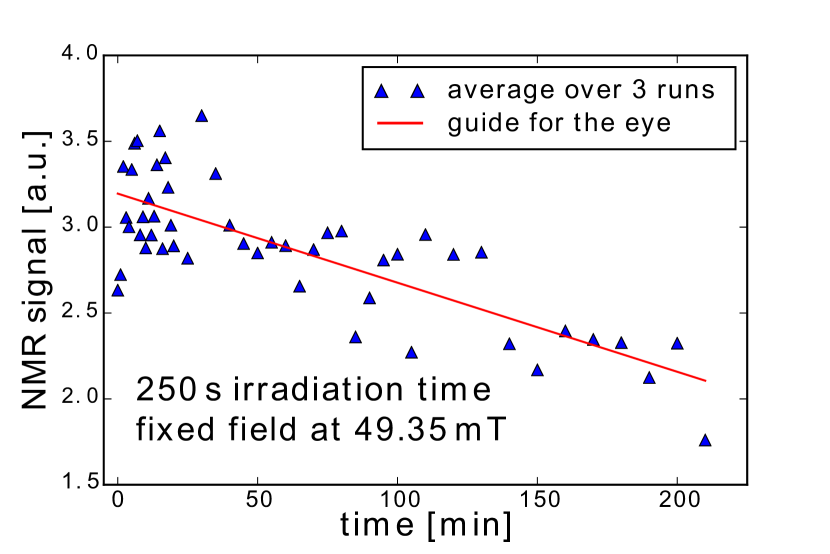
The depolarisation in the same field was measured with a pumping time of which is sufficient to be in the saturated region of the pumping process. The characteristic decay time back to the thermal equilibrium was determined to be (Fig. 6b). This is about times faster than the characteristic pumping time. Reasons for this can be the fact, that the NV system is frequently in the excited state during the polarisation. This is accompanied by an other electronic configuration as in the ground state, where the NV centre is in resonance with the P1 defects. Also it should be mentioned that an unstable laser output in the first seconds can cause longer pumping times. Figure 6c) shows the exponential-like decay of the integral signal intensity over . The depolarisation behaviour back to the equilibrium state in the field shows a much longer relaxation time of about . Due to this long time no change in the signal can be recognized within in the first (See Fig. 11 in appendix) and even an observation time over identify just a slow decrease of the signal (see Fig. 12 in appendix). The extreme long T1 time might be a manifestation of the wide off-resonant Zeeman splittings of the two defect systems and may be an advantage for future developments and novel applications.
2.3 Theory and Simulation
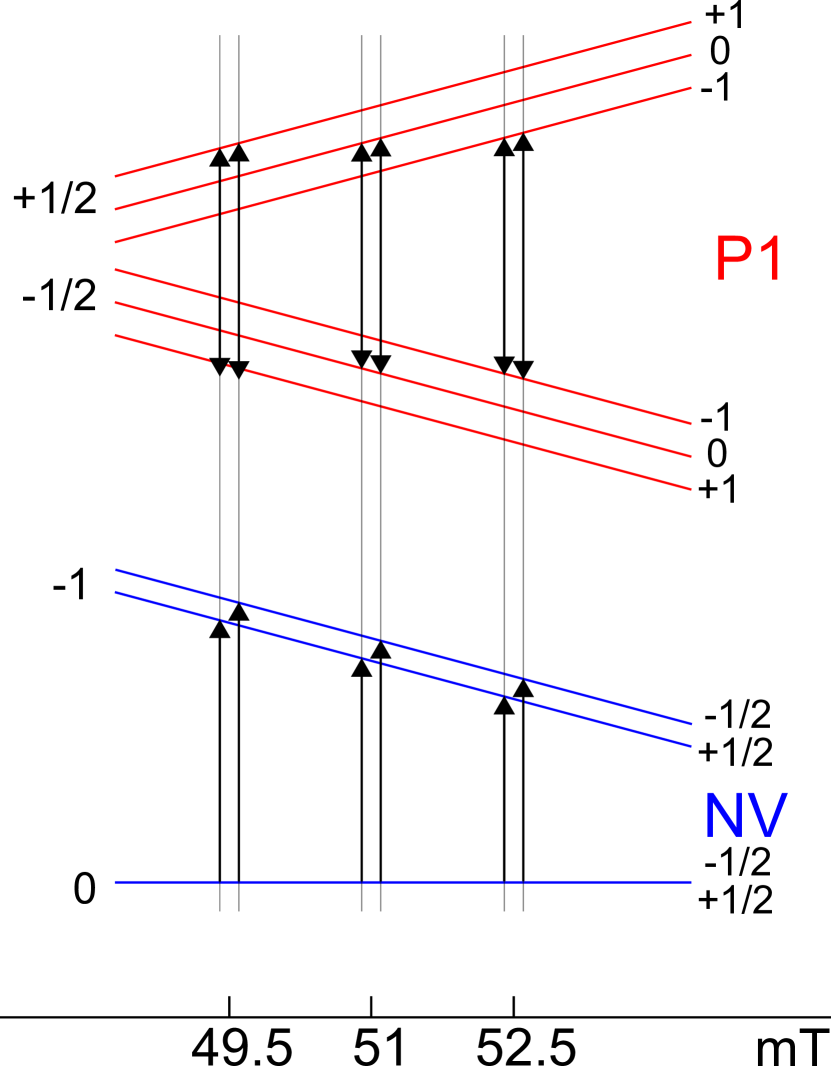
We assume two quantum objects one consisting of a NV centre in its optical ground state with the electron spin and a nearby spin of a carbon-13 nucleus. The other one is composed of the electron spin of a P1 centre and the hyperfine coupled intrinsic nitrogen spin . Here we consider the N-14 isotope () due to a natural abundance of . In this model we neglect the interaction of the intrinsic nitrogen spin of the NV centre which is weak in the ground state. The situation is illustrated in Fig. 7. This leads to the following two Hamiltonians,
where denotes the isotropic interaction parameter for the NV and 13C spin, the hyperfine coupling parameter for the aligned (A) and the non-aligned P1 centres (B) along the z-axis and the gyromagnetic ratio of an electron () The applied external magnetic field is oriented parallel to the z-axis. The zero field splitting in the NV optical ground state is . Additionally, we assume in this model a dipole-dipole coupling of the NV coupled carbon-13 spin to an initially unpolarised C-13 spin reservoir, which is not directly considered in the Hamiltonian but ensures the distribution of spin polarisation over the hole diamond lattice. For our simulations we choose a relatively weak coupling of the NV centre to the carbon spin of consistent with the narrow polarisation signal in the field dependent measurements. But it should be mentioned, that simulations, where the coupling does not exceed values of display a very similar polarisation pattern. For higher values the energy level is further shifted which produces unobserved peaks and peak shapes.
The values for the hyperfine coupling are taken from the literature as and [9, 23]. By solving the Hamilton eigenvalue problem the energy levels of both systems are calculated. In the case of the P1 complex we distinguish between the two possible orientations in the crystal lattice and its relative abundance (1:3). The nitrogen content in the sample results in an average distance of nitrogen associated defects of about . This corresponds to a dipolar coupling strength of – or for a distance of even are found. A resonant energy transfer between both quantum systems achieved within an energy difference of in the presented simulation (Fig. 8), being characteristic for the coupling strength among the defects. For each initial and final state of the possible transitions the expectation value is stored to determine the preferable spin polarisation. In this simple algorithm the differences of reflects the spin flip probability of the carbon-13 nucleus. Now each polarised carbon-13 nucleus acts as source of either positive or negative spin polarisation for dipole coupled neighbouring spins with similar Larmor frequencies.
The resolution of the field sweep is modelled as a convolution with a Gaussian with a full width at half maximum of . With this approach the shape of the marked regions in the experimental data in Fig. 4 can be well reproduced. In this model it is not obvious which physical parameter determines the recorded line width of the polarisation peaks in Fig. 4. Either both the electron interaction NV-P1 and the NV-C-13 coupling are weak or the interaction to the P1 system is weak (narrow resonant energy transfer) and the coupling of the NV centre to the carbon-13 spin is strong or vice versa. Nevertheless, the concept of a coupling scenario in the NV optical ground state is reasonable because of the rather short life time of several nano seconds in the excited state [18]. This short life time corresponds to a short interaction time with very slow time evolution of the state vectors, which are responsible for the polarisation effect in terms of hyperfine coupling and cross polarisation. This only allows efficient interaction with strongly coupled spins. In contrast this is not the case in the ground state where also weak coupling could contribute to a polarisation effect.
2.4 Conclusion and Outlook
In the present contribution we highlight a magnetic field dependent nuclear polarisation around measured by NMR. Our data suggest that the observed effect can not be allocated to the hyperfine coupling in ESLAC but is much more likely related to a cross polarisation between a NV carbon-13 system and a nearby P1 centre. The dominant polarisation pattern can be explained by and attributed to cross relaxation between dipolar coupled NV and 14N-P1 centres in good agreement with the theoretical simulation. Two minor features in the data are observed whose origin is still unclear at present but may be associated with 15N-P1 centres. If this conclusion is true it would suggest that an interaction with a P1 centre generates an efficient bulk polarisation even at relatively low concentrations. In this picture the P1 defect acts as mediator for the nuclear polarisation effect much more efficient than the ESLAC and should be exploited further in future hyperpolarisation applications.
In order to investigate this effect in more detail the defect distance has to be modified, which can be accomplished by samples with different nitrogen content. A fluence variation of the electron irradiation would change the NV-P1 ratio and therefore also the average distance between those defect types. One cannot rule out the possibility that with shrinking distance the interaction becomes so strong that the process of spin flips has to be described by quantum state overlaps and time depending Schrödinger equation. For the current experiments this was not necessary. Furthermore it becomes apparent that maybe a selective coupling to C-13 or other spins with a minimum distance to the NV centre is necessary for an effective spin diffusion into the surrounding bulk.
Acknowledgments
This work was supported by the VolkswagenStiftung. We thank Dr. W. Knolle from the Leibniz Institute of Surface Modification (IOM) for helpful discussions and valuable assistance during the high energy electron irradiation.
References
- Abragam [1961] Anatole Abragam. The principles of nuclear magnetism. Oxford University Press, 1961.
- Alvarez et al. [2015] Gonzalo A. Alvarez, Christian O. Bretschneider, Ran Fischer, Paz London, Hisao Kanda, Shinobu Onoda, Junichi Isoya, David Gershoni, and Lucio Frydman. Local and bulk 13C hyperpolarization in nitrogen-vacancy-centred diamonds at variable fields and orientations. Nat. Commun., page 8456, 2015. 10.1038/ncomms9456.
- Belthangady et al. [2013] C. Belthangady, N. Bar-Gill, L. M. Pham, K. Arai, D. Le Sage, P. Cappellaro, and R. L. Walsworth. Dressed-state resonant coupling between bright and dark spins in diamond. Phys. Rev. Lett., 110:157601, 2013. 10.1103/PhysRevLett.110.157601.
- Doherty et al. [2013] Marcus W. Doherty, Neil B. Manson, Paul Delaney, Fedor Jelezko, Jörg Wrachtrup, and Lloyd C.L. Hollenberg. The nitrogen-vacancy colour centre in diamond. Physics Reports, 528:1 – 45, 2013. 10.1016/j.physrep.2013.02.001.
- Fischer et al. [2013a] Ran Fischer, Christian O. Bretschneider, Paz London, Dmitry Budker, David Gershoni, and Lucio Frydman. Bulk nuclear polarization enhanced at room temperature by optical pumping. Phys. Rev. Lett., 111:057601, 2013a. 10.1103/PhysRevLett.111.057601.
- Fischer et al. [2013b] Ran Fischer, Andrey Jarmola, Pauli Kehayias, and Dmitry Budker. Optical polarization of nuclear ensembles in diamond. Phys. Rev. B, 87:125207, 2013b. 10.1103/physrevb.87.125207.
- Hanson et al. [2006] R. Hanson, F. M. Mendoza, R. J. Epstein, and D. D. Awschalom. Polarization and readout of coupled single spins in diamond. Phys. Rev. Lett., 97:087601, 2006. 10.1103/physrevlett.97.087601.
- Hartmann and Hahn [1962] S. R. Hartmann and E. L. Hahn. Nuclear double and resonance in the rotating and frame. Phys. Rev., 128:2042, 1962. 10.1103/PhysRev.128.2042.
- Holliday et al. [1989] K Holliday, N B Manson, M Glasbeek, and E van Oort. Optical hole-bleaching by level anti-crossing and cross relaxation in the N-V centre in diamond. Journal of Physics: Condensed Matter, 1:7093, 1989.
- Hovav et al. [2010] Yonatan Hovav, Akiva Feintuch, and Shimon Vega. Theoretical aspects of dynamic nuclear polarization in the solid state - the solid effect. J. Magn. Reson., 207:176–189, 2010. 10.1016/j.jmr.2010.10.016.
- Hovav et al. [2012] Yonatan Hovav, Akiva Feintuch, and Shimon Vega. Theoretical aspects of dynamic nuclear polarization in the solid state - the cross effect. J. Magn. Reson., 214:29–41, 2012. 10.1016/j.jmr.2011.09.047.
- Hu et al. [2011] Kan-Nian Hu, Galia T. Debelouchina, Albert A. Smith, and Robert G. Griffin. Quantum mechanical theory of dynamic nuclear polarization in solid dielectrics. The Journal of Chemical Physics, 134:125105, 2011. 10.1063/1.3564920.
- Jacques et al. [2009] V. Jacques, P. Neumann, J. Beck, M. Markham, D. Twitchen, J. Meijer, F. Kaiser, G. Balasubramanian, F. Jelezko, and J. Wrachtrup. Dynamic polarization of single nuclear spins by optical pumping of nitrogen-vacancy color centers in diamond at room temperature. Phys. Rev. Lett., 102:057403, 2009. 10.1103/physrevlett.102.057403.
- Khutsishvili [1966] G R Khutsishvili. Spin diffusion. Soviet Physics Uspekhi, 8:743, 1966. 10.1070/PU1966v008n05ABEH003035.
- King et al. [2010] Jonathan P. King, Patrick J. Coles, and Jeffrey A. Reimer. Optical polarization of 13C nuclei in diamond through nitrogen vacancy centers. Phys. Rev. B, 81:073201, 2010. 10.1103/PhysRevB.81.073201.
- Levitt [2009] Malcolm H. Levitt. Spin Dynamics - Basics of Nuclaer Magnetic Resonace. Wiley, 2009.
- Mugler and Altes [2013] John P. Mugler and Talissa A. Altes. Hyperpolarized 129-Xe MRI of the human lung. Journal of Magnetic Resonance Imaging, 37:313–331, 2013. 10.1002/jmri.23844.
- Neumann et al. [2009] P. Neumann, R Kolesov, V. Jacques, J. Beck, J. Tisler, A. Batalov, L Rogers, N-B. Manson, G. Balasubramanian, F. Jelezko, and J Wrachtrup. Excited-state spectroscopy of single NV defects in diamond using optically detected magnetic resonance. New Journal of Physics, 2009. 10.1088/1367-2630/11/1/013017.
- Overhauser [1952] Albert W. Overhauser. Polarization of nuclei in metals. Phys. Rev., page 411, 1952. 10.1103/PhysRev.92.411.
- Scheuer et al. [2016] Jochen Scheuer, Ilai Schwartz, Qiong Chen, David Schulze-Sünninghausen, Patrick Carl, Peter Höfer, Alexander Retzker, Hitoshi Sumiya, Junichi Isoya, Burkhard Luy, M. B.Martin B Plenio, Boris Naydenov, and Fedor Jelezko. Optically induced dynamic nuclear spin polarisation in diamond. New Journal of Physics, 2016. 10.1088/1367-2630/18/1/013040.
- Scott et al. [2016] Eric Scott, Melanie Drake, and Jeffrey A. Reimer. The phenomenology of optically pumped 13C NMR in diamond at 7.05 T: Room temperature polarization, orientation dependence, and the effect of defect concentration on polarization dynamics. Journal of Magnetic Resonance, 264:154–162, 2016. 10.1016/j.jmr.2016.01.001.
- Slichter [1990] C. P. Slichter. Principles of Magnetic Resonance. Springer-Verlag Berlin Heidelberg, 1990. 10.1007/978-3-662-09441-9.
- Smith et al. [1959] W. V. Smith, P. P. Sorokin, I. L. Gelles, and G. J. Lasher. Electron-spin resonance of nitrogen donors in diamond. Phys. Rev., 115:1546–1552, 1959. 10.1103/PhysRev.115.1546.
- Wang et al. [2013] Hai-Jing Wang, Chang S. Shin, Claudia E. Avalos, Scott J. Seltzer, Dmitry Budker, Alexander Pines, and Vikram S. Bajaj. Sensitive magnetic control of ensemble nuclear spin hyperpolarization in diamond. Nat. Commun., 4, 2013. 10.1038/ncomms2930.
- Wang et al. [2014] Hai-Jing Wang, Chang S. Shin, Scott J. Seltzer, Claudia E. Avalos, Alexander Pines, and Vikram S. Bajaj. Optically detected cross-relaxation spectroscopy of electron spins in diamond. Nat. Commun., 5, 2014. 10.1038/ncomms5135.
- Yang et al. [2016] Pengcheng Yang, Martin B Plenio, and Jianming Cai. Dynamical nuclear polarization using multi-colour control of color centers in diamond. EPJ Quantum Technology, 3, 2016. 10.1140/epjqt/s40507-015-0039-8.
- Zaitsev [2001] A. M. Zaitsev. Optical Properties of Diamond. Springer, 2001. 10.1007/978-3-662-04548-0.