Distance to the Low-velocity Cloud in the Direction of the High-velocity Compact Cloud CO–0.40–0.22
Abstract
CO–0.40–0.22 is a peculiar molecular cloud that is compact and has an extraordinary broad velocity width. It is found in the central molecular zone of our Galaxy. In this direction, there is another cloud with an H2O maser spot at a lower velocity. Collision with this low-velocity cloud could be responsible for the broad velocity width of CO–0.40–0.22. We performed phase-referencing VLBI astrometry with VERA and detected the annual parallax of the H2O maser spot in the low-velocity cloud to be mas, which corresponds to a distance of kpc from the Sun. This implies that the low-velocity cloud is located in the Galactic disk on the near side of the central molecular zone.
1 Introduction
Large-scale CO surveys of the central molecular zone (CMZ) of our Galaxy have detected a peculiar population of molecular clouds, namely, high-velocity compact clouds (HVCCs; Oka et al., 1998, 2007, 2012). HVCCs are characterized by their compact appearance ( pc) and unusually large velocity width ( km s-1). Some of energetic HVCCs contain small expanding arcs and shells, indicating that local explosive events, such as supernova explosions, may be responsible for the origin of HVCCs (Oka et al., 1999, 2001, 2008; Tanaka et al., 2007).
However, a majority of HVCCs do not have any expanding features or counterparts at other wavelengths. CO–0.40–0.22 is such a featureless, energetic HVCC centered at . It has a small size ( pc; Figure 1a) and an extremely broad velocity width ( km s-1; Figure 1b). Intensive studies based on single-dish observations of molecular lines revealed that CO–0.40–0.22 consists of an intense component with a shallow velocity gradient and a less intense high-velocity wing. This behavior is interpreted as a gravitational kick to the molecular cloud caused by an invisible compact object with a mass of (Oka et al., 2016). This massive object could be an intermediate-mass black hole (IMBH), which would contribute to the evolution of the central supermassive black hole (SMBH; Ebisuzaki et al., 2001).
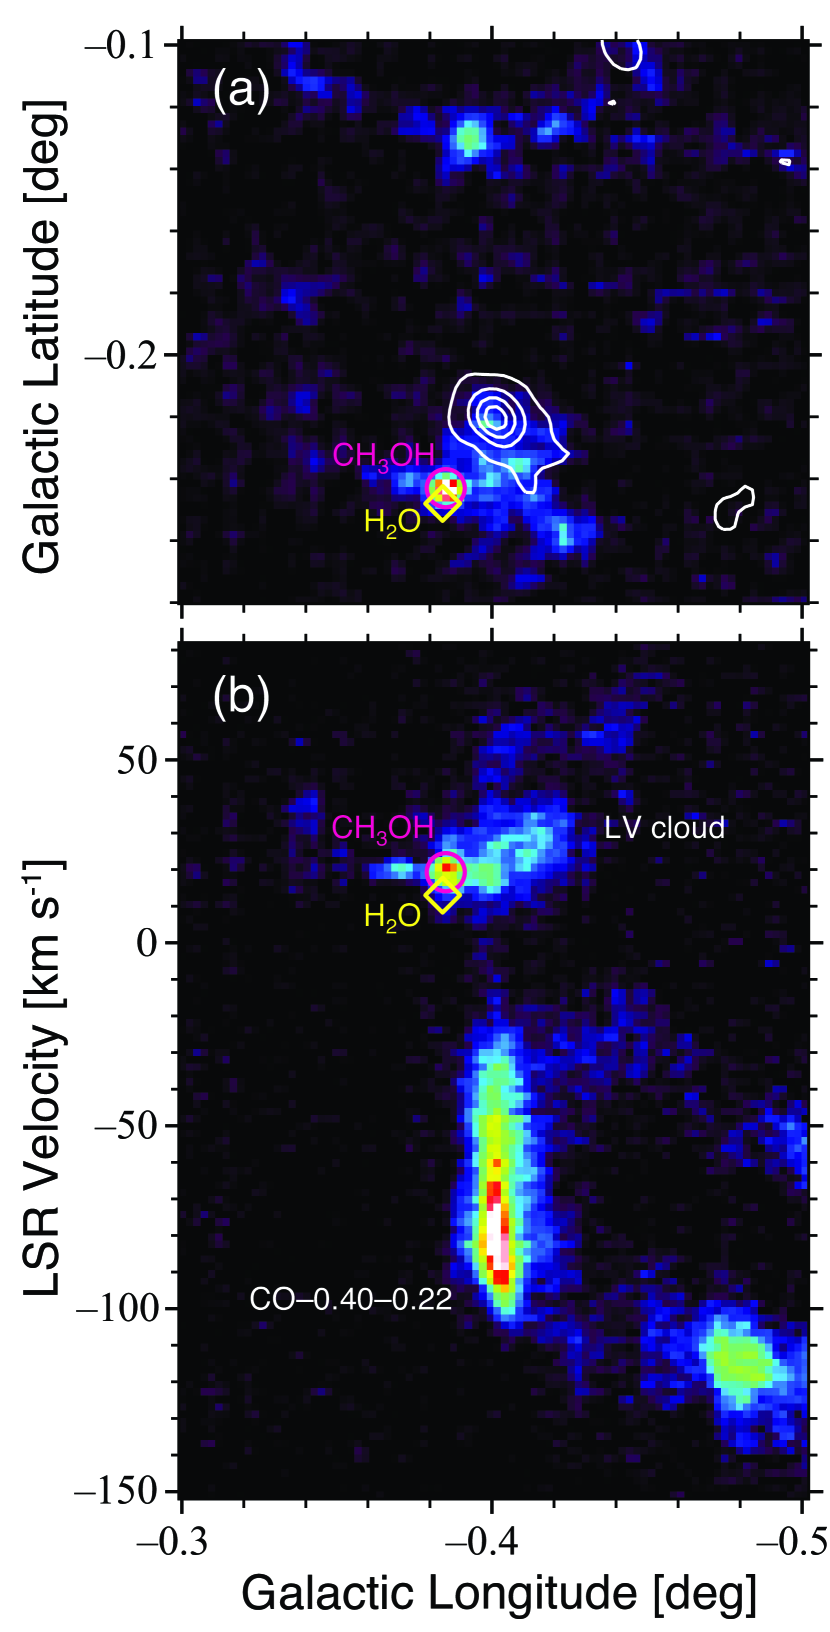
In the direction of CO–0.40–0.22, there is another molecular cloud at km s-1 (Figure 1b). This low-velocity cloud (LV cloud) is associated with a bright nebula of infrared emission, 22 GHz H2O maser emission, and 6.7 GHz CH3OH maser emission (Caswell et al., 1983; Chambers et al., 2014), indicating that massive star formation is taking place. Its physical relation to CO–0.40–0.22 is unclear. If the LV cloud is physically associated with CO–0.40–0.22, collision between these clouds with significantly different velocities induces intense shock, resulting in a broad velocity width feature, which bridges colliding clouds in the position-velocity space (e.g., Matsumura et al., 2012). To examine the cloud-cloud collision scenario for CO–0.40–0.22, the distance to the LV cloud should be determined directly.
2 Observations and analysis
Observations of H2O 616–523 (22.235080 GHz) maser in H2O 359.62–0.25 were carried out in 12 epochs from November 2015 to January 2017 with VERA 111VLBI Exploration of Radio Astrometry (VERA) is a Japanese VLBI array for phase-referencing astrometry, consisting of four domestic stations equipped with dual-beamed radio telescopes.. Observational details are summarized in Table 1. The interval of the observations was 1 month. All four stations of VERA were utilized except for epochs 4 and 5. H2O 359.62–0.25 and position reference source J1745–2820 were observed simultaneously in the dual-beam mode. The tracking center position of H2O 359.62–0.25 was set to . The separation angle between them was 105. NRAO530 was also observed as a bandpass and delay calibrator every 40 min. The observation sequence in each day spanned 3 h.
| Epoch | Code | Date | Antennas AvailableaaAntenna codes are MZ: at Mizusawa, Iwate, IR: at Iriki, Kagoshima, OG: at Ogasawara Islands, Tokyo, and IS: at Ishigakijima, Okinawa. |
|---|---|---|---|
| 1 | r15332a | 2015 Nov 28 | MZ, IR, OG, IS |
| 2 | r15360a | 2015 Dec 26 | MZ, IR, OG, IS |
| 3 | r16026b | 2016 Jan 26 | MZ, IR, OG, IS |
| 4 | r16061e | 2016 Mar 1 | IR, OG, IS |
| 5 | r16084c | 2016 Mar 24 | IR, OG, IS |
| 6 | r16114b | 2016 Apr 23 | MZ, IR, OG, IS |
| 7 | r16142b | 2016 May 21 | MZ, IR, OG, IS |
| 8 | r16166a | 2016 Jun 14 | MZ, IR, OG, IS |
| 9 | r16236a | 2016 Aug 23 | MZ, IR, OG, IS |
| 10 | r16262a | 2016 Sep 18 | MZ, IR, OG, IS |
| 11 | r16327a | 2016 Nov 22 | MZ, IR, OG, IS |
| 12 | r17017a | 2017 Jan 17 | MZ, IR, OG, IS |
Left-handed circular polarization was received, sampled with 2-bit quantization. The signals were filtered using the VERA digital filter unit (Iguchi et al., 2005) to obtain 16 IF channels each with a bandwidth of 16 MHz. One IF channel was assigned to H2O 359.62–0.25 and 15 IF channels to J1745–2820. The data were recorded onto magnetic tapes at a rate of 1024 Mbps. The system temperatures including atmospheric loss were measured to be 100–1000 K, depending on the stations and weather conditions. Correlation processing was conducted on the Mizusawa software correlator at the National Astronomical Observatory of Japan (NAOJ). The correlator accumulation period was 1 s. For the J1745–2820 data, the spectral resolution was 64 points per each 16 MHz channel. For the H2O 359.62–0.25 data, the frequency resolution was 15.625 kHz, which corresponds to a velocity resolution of 0.21 km s-1.
Data reductions were performed by using the NRAO Astronomical Image Processing System (AIPS). The amplitude was calibrated by the system noise temperatures, and bandpass calibration was made with the NRAO530 data. The dual-beam phase-calibration data and the modified delay-tracking model were applied for accurate measurements. For phase-referencing, we calibrated the clock parameters using NRAO530 and performed a fringe fitting on the maser spot in H2O 359.62–0.25 because of the low intensity of J1745–2820 ( 70 mJy). The solutions were applied to the J1745–2820 data. We obtained the image of J1745–2820 by using task IMAGR. The position of J1745–2820 with respect to the H2O maser spot was determined by elliptical Gaussian fitting to the brightness peak of the image. Since the position of J1745–2820 should be stable, we can regard the positional change of J1745–2820 as that of the H2O maser spot.
3 Results
H2O 616–523 maser line was detected from H2O 359.62–0.25 at km s-1 in the first eight epochs (Figure 2). Only one spot (named ‘A’) was visible during epochs 1–5, while another spot (named ‘B’) appears at northeast of spot A during epochs 6–8 (Figure 3). We traced the position of spot A with respect to J1745–2820. Since spot B was more intense than A during epochs 6–8, we traced it with respect to J1745–2820. This was because we used the H2O 359.62–0.25 data for the fringe fitting process. For this reason, we added the positional offset between spots A and B to obtain the accurate position of spot A.
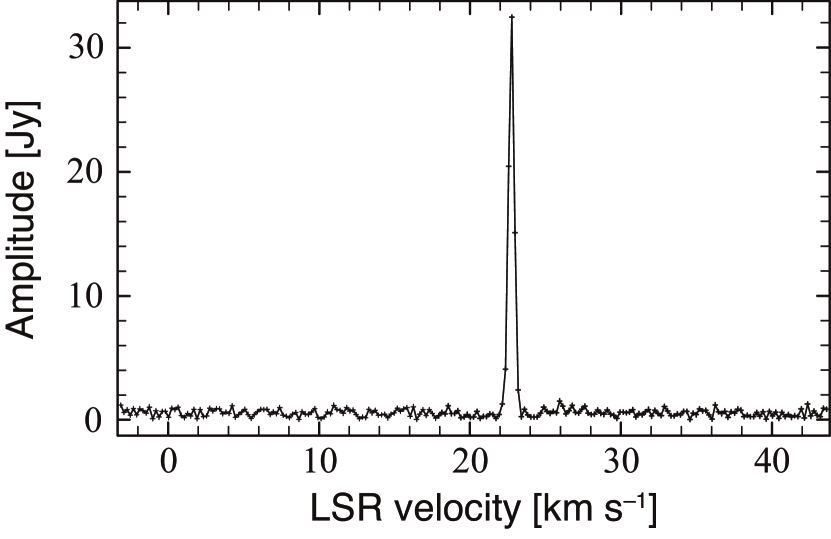
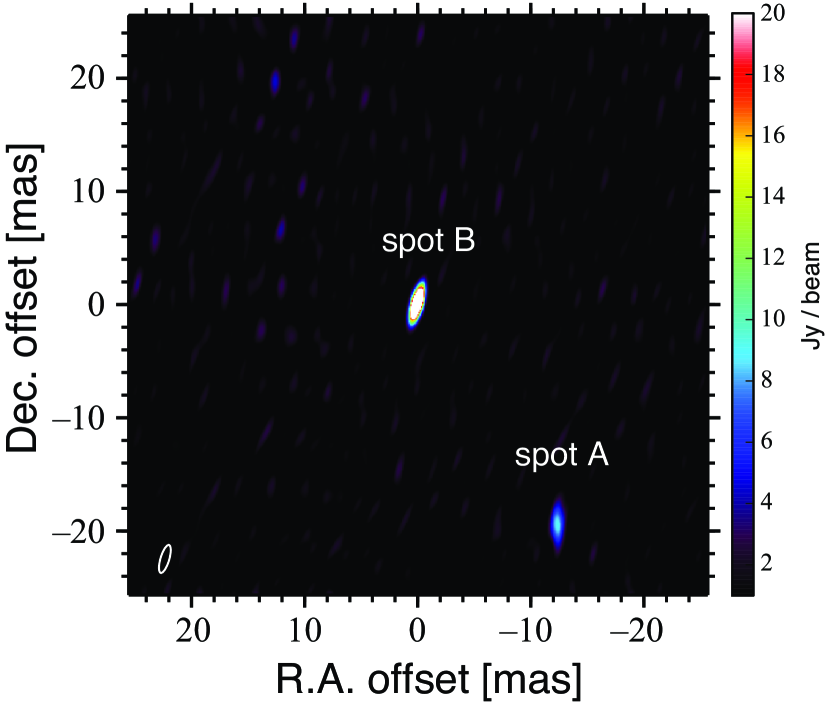
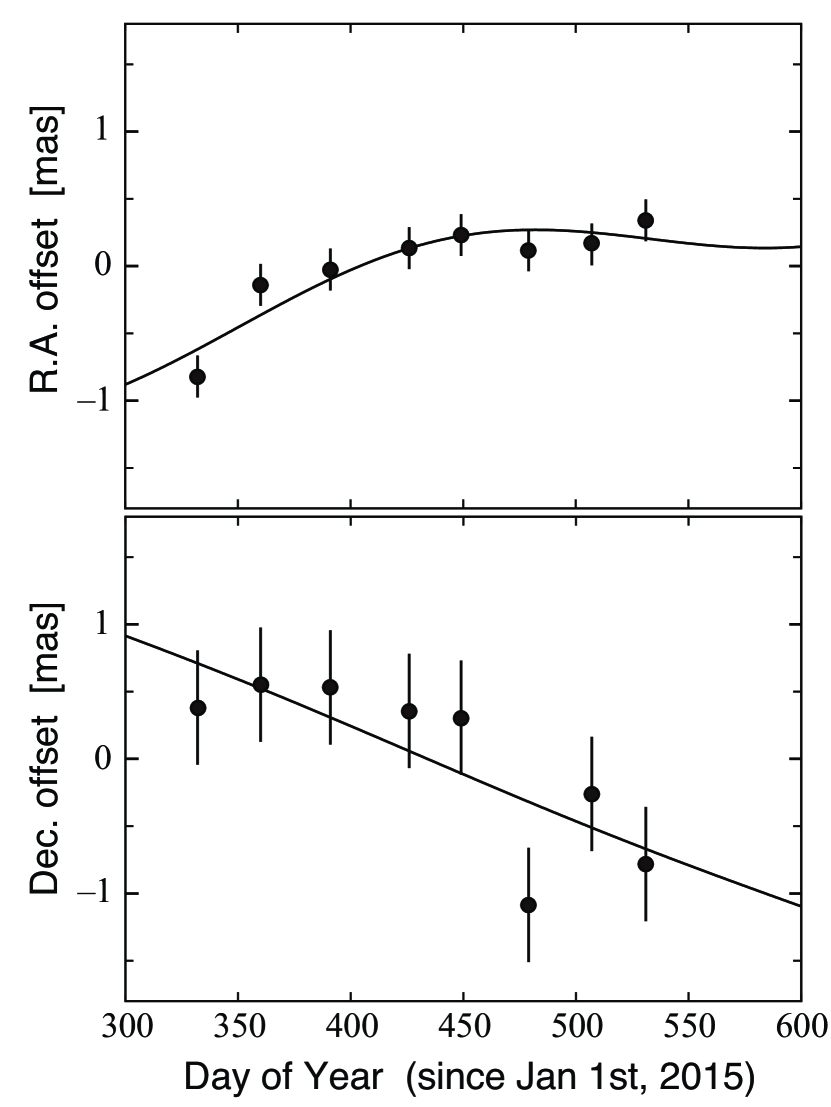
Figure 4 shows the results of the position measurements of maser spot A. The position offsets are with respect to the average position of epochs 1–8. As shown in Figure 4, we detected the movement of spot A, particularly in the R.A. plot, which certainly deviates from a linear motion. The deviation seems to be a sinusoidal, annual modulation. This must be due to the annual parallax of the maser spot. We derived the annual parallax and proper motions using both the R.A. and Dec. data simultaneously. Table 2 summarizes the best-fitting result. The obtained annual parallax and proper motions are mas and mas yr-1 for R.A. and mas yr-1 for Dec., respectively. We employed a uniform weighting in the fitting procedure, because systematic errors are considerably larger than the statistical errors in the VLBI observations. We evaluated the systematic errors to be 0.16 mas in R.A. and 0.43 mas in Dec. A worse astrometric accuracy in Dec. can be seen in low-elevation angle sources, such as Galactic center sources, caused by an atmospheric zenith delay residual (Honma et al., 2008). The derived parallax corresponds to a distance of kpc from the Sun.
| (km s-1) | (mas) | Distance (kpc) | (mas yr-1) | (mas yr-1) |
|---|---|---|---|---|
| +22.7 |
4 Discussion and Summary
The derived distance from the Sun corresponds to a Galactocentric distance of kpc if we assume kpc (Gillessen et al., 2009). This shows that H2O 359.62–0.25, as well as the LV cloud, is not in the CMZ. Assuming the normal distribution of the observed parallax, we obtained the probability that H2O 359.62–0.25 is located further than 8 kpc to be 6.3%. Thus, the LV cloud is not in the CMZ with a confidence level of greater than 93.7%.
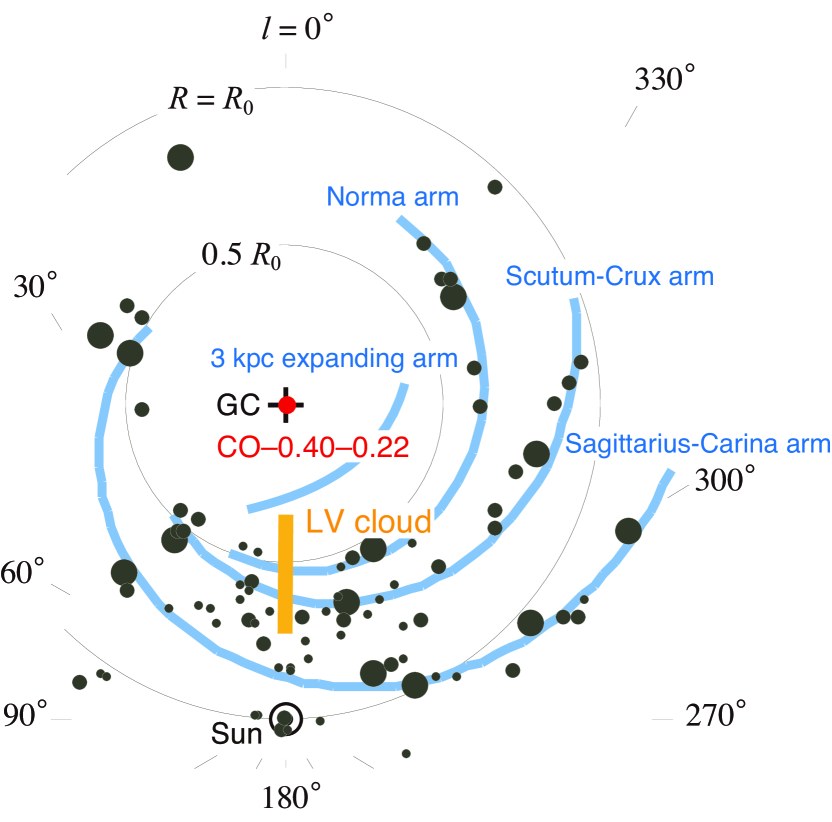
Figure 5 shows the line-of-sight location of the LV cloud. The most likelihood value kpc falls on the Scutum-Crux arm. On the other hand, the velocity of the LV cloud ( km s-1) implies that the LV cloud may belong to the 4 kpc molecular ring (Sofue, 2006), which is also within the uncertainty range. The LV cloud could be a member of the OB association responsible for RCW 137, which is a large (diameter ) Hii region centered at (Rodgers et al., 1960). RCW 137 is visible in the optical wavelength, indicating a distance of kpc from the Sun. All these facts support the near distance of the LV cloud.
Our parallax measurement of H2O 359.62–0.25 concludes that the LV cloud is in the Galactic disk on the near side of the CMZ. On the other hand, CO–0.40–0.22 is supposed to be in the CMZ by its extraordinary broad velocity width. An absorption feature in CO lines at km s-1 (Oka et al., 2012) indicates that CO–0.40–0.22 is certainly behind the 3 kpc expanding arm (Sofue, 2006). Therefore, the LV cloud is irrelevant to CO–0.40–0.22. The cloud-cloud collision scenario seems to be not applicable to the CO–0.40–0.22 case. We supposed another formation scenario for CO–0.40–0.22, a gravitational kick by a massive, point-like object, which could be an IMBH (Oka et al., 2016). In summary, this annual parallax study ruled out at least one formation scenario other than the gravitational kick scenario.
References
- Caswell et al. (1983) Caswell, J. L., Batchelor, R. A., Forster, J. R., & Wellington, K. J. 1983, Australian Journal of Physics, 36, 401
- Chambers et al. (2014) Chambers, E. T., Yusef-Zadeh, F., & Ott, J. 2014, A&A, 563, A68
- Ebisuzaki et al. (2001) Ebisuzaki, T., Makino, J., Tsuru, T. G., et al. 2001, ApJ, 562, L19
- Georgelin & Georgelin (1976) Georgelin, Y. M., & Georgelin, Y. P. 1976, A&A, 49, 57
- Gillessen et al. (2009) Gillessen, S., Eisenhauer, F., Trippe, S., et al. 2009, ApJ, 692, 1075
- Honma et al. (2008) Honma, M., Tamura, Y., & Reid, M. J. 2008, PASJ, 60, 951
- Iguchi et al. (2005) Iguchi, S., Kurayama, T., Kawaguchi, N., & Kawakami, K. 2005, PASJ, 57, 259
- Matsumura et al. (2012) Matsumura, S., Oka, T., Tanaka, K., et al. 2012, ApJ, 756, 87
- Oka et al. (1998) Oka, T., Hasegawa, T., Sato, F., Tsuboi, M., & Miyazaki, A. 1998, ApJS, 118, 455
- Oka et al. (2001) Oka, T., Hasegawa, T., Sato, F., Tsuboi, M., & Miyazaki, A. 2001, PASJ, 53, 787
- Oka et al. (2008) Oka, T., Hasegawa, T., White, G. J., et al. 2008, PASJ, 60, 429
- Oka et al. (2016) Oka, T., Mizuno, R., Miura, K., & Takekawa, S. 2016, ApJ, 816, L7
- Oka et al. (2007) Oka, T., Nagai, M., Kamegai, K., Tanaka, K., & Kuboi, N. 2007, PASJ, 59, 15
- Oka et al. (2012) Oka, T., Onodera, Y., Nagai, M., et al. 2012, ApJS, 201, 14
- Oka et al. (1999) Oka, T., White, G. J., Hasegawa, T., et al. 1999, ApJ, 515, 249
- Rodgers et al. (1960) Rodgers, A. W., Campbell, C. T., & Whiteoak, J. B. 1960, MNRAS, 121, 103
- Sofue (2006) Sofue, Y. 2006, PASJ, 58, 335
- Tanaka et al. (2007) Tanaka, K., Kamegai, K., Nagai, M., & Oka, T. 2007, PASJ, 59, 323