Mass content of UGC 6446 and UGC 7524 through HI rotation curves: deriving the stellar discs from stellar population synthesis models
Abstract
In this work we study the mass distribution of two irregular galaxies, UGC 6446 and UGC 7524, by means of HI rotation curves derived from high resolution HI velocity fields obtained through the Westerbork Synthesis Radio Telescope data archive. We constrain the stellar and gas content of both galaxies with stellar population synthesis models and by deriving the HI+He+metals rotation curves from the total HI surface density maps, respectively. The discrepancy between the circular velocity maxima of the stellar plus the HI+He+metals rotation curves and the observed HI rotation curves of both galaxies requires the inclusion of a substantial amount of dark matter. We explore the Navarro Frenk and White, Burkert, Di Cintio, Einasto and Stadel dark matter halo models. We obtain acceptable fits to the observed HI rotation curves of UGC 6446 and UGC 7524 with the cored Burkert, Einasto and Stadel dark matter halos. In particular, Einasto and Stadel models prove to be an appropriate alternative to the Burkert dark matter halo. This result should increase the empirical basis that justify the usage of dark matter exponential models to adjust the observed rotation curves of real galaxies.
keywords:
galaxies:irregular – galaxies:individual:UGC 6446 – galaxies:individual:UGC 75241 Introduction
The rotation curves (RCs) of galaxies trace the circular velocities of the total galactic density distribution as a function of radius. Assuming centrifugal equilibrium it is possible to gather information about the mass of the most important components rotating under the influence of the central gravitational potential. The principal gravitating constituents in a galaxy are stars, gas, baryonic dark matter (BDM) (mainly stellar remnants, substellar objects (with masses between 0.01 and 0.08 solar masses (Fukugita & Peebles, 2004)), cold and warm molecular gas and cold neutral gas), and non-baryonic dark matter (DM). According to Read (2014) the current amount of stars, gas and BDM in the Galaxy within a radius of 8 kpc is Mb M⊙, considering the stellar mass M∗ M⊙ estimated by Bovy et al. (2012), gas mass MHI+H2 M⊙ and BDM MBDM M⊙ (Flynn et al., 2006). In external low redshift galaxies of morphological types from E to dE, stars constitute of baryons, neutral and molecular gas form the remaining . Other components such as halo stars, massive compact halo objects, hot ionized gas and dust represent a negligible fraction of the total baryons budget (Read & Trentham, 2005). On the basis of these considerations, in the present work, we concentrate exclusively on the stellar and gaseous parts of the total baryonic content of galaxies.
A common approach, to derive the stellar masses of observed galaxies, relies on the stellar population synthesis (SPS) technique that reproduces a galaxy spectrum through the sum of the spectra of the stellar populations residing in the galaxy disc considering groups of stars of diverse age and distinct chemical content (Walcher et al., 2011). In the current literature one commonly used procedure to estimate the spectrum of a stellar population is the ‘isochrone synthesis‘ method introduced by Charlot & Bruzual (1991) (CB91), whose principal ingredients are stellar evolutionary tracks, libraries of stellar spectra, an initial mass function (IMF) and a prescription for the star formation history. The CB91 strategy interpolates the stellar evolutionary tracks to generate stellar isochrones and produce (from an IMF) the stellar mass distribution, for a given chemistry. The spectrum of a stellar population is obtained integrating over a certain mass range the spectra of the individual stars weighted for the determined stellar mass function. A galaxy spectrum is computed as a time integral of all stellar population spectra weighted for a particular star formation rate (SFR) recipe (Courteau et al., 2014).
There are a number of uncertainties associated with each constituent of the SPS strategy that we concisely report here in order to properly address the limitations and shortcomings of SPS methods. Isochrones are principally affected by errors connected to the modelling of delicate phases of stellar evolution, namely convection, rotation, mass-loss, binary evolution and thermal pulses of stars in the asymptotic giant branch (Charlot et al., 1996; Conroy et al., 2009; Conroy, 2013). Stars from 1.1 to 7 M⊙ have convective cores that develop a certain degree of overshooting due to fluid elements with non zero velocity moving from the radiative to the convective regions. Core convective overshooting produces bluer stellar colors of 0.1 mag for stars in the age interval 0.1-1 Gyr, a brighter main sequence turnover and an increase of 25 of the main sequence lifetime (Conroy & Gunn, 2010). Stellar rotation augments of a 25 the permanence of stars in the main sequence strip (Maeder & Meynet, 2012). SPS colors are bluer ( 0.1-1.0 mag for different age and wavelength intervals) and stars luminosity is higher due to stellar rotation according to the analysis of Vázquez et al. (2007). Mass-loss drastically changes the luminosity, mass, metallicity and lifetime of massive stars (> 40 M) (Conroy, 2013). Binary evolution produces bluer SPS colors and increases the age and metallicity of stars (Zhang et al., 2005). However, Hernández-Pérez & Bruzual (2013) pointed out that the inclusion of binary stars in SPS models only affects the spectra of early-type galaxies in the ultraviolet (UV). Thermally pulsing asymptotic giant branch (TP-AGB) stars are moderately cold high luminosity stars with masses between 1.5 and 8 M⊙ that undergo a thin shell instability during the helium burning phase (Schwarzschild & Harm, 1968). The modelling of these stars is crucial for SPS application to correctly derive mass-to-light ratios (M/L) and metallicities of intermediate age stars (Walcher et al., 2011). The most important drawbacks of theoretical libraries of stellar spectra are the following: incorrect input of atomic and molecular parameters, inadequate treatment of convection, non local thermodynamic equilibrium and non plane parallel geometries and, last but not least, faulty and fragmentary atomic and molecular line lists (Kurucz, 2011). On the other hand the problems of the empirical stellar libraries originate from atmospheric absorption, flux calibration, poor spectral resolution and limited wavelength range and the modest span of the parameter space. The uncertainties related to the IMF could affect the spectral energy distribution of SPS and the global normalization of the stellar M/L. Estimates of SFRs through spectral energy distribution fitting are problematic due to the age-dust-metallicity degeneracy, the adopted dust model and star formation history libraries (Conroy, 2013). Salim et al. (2007) showed that the SFRs derived from UV-optical spectral energy distributions have systematic uncertainties of 0.3 dex. Some of the issues connected to critical phases of stellar evolution such as core convective overshooting, mass-loss and TP-AGB have been addressed and included in the state of the art SPS models. In general the SPS method is considered a cautious approach to determine the stellar masses of galactic systems, regardless of the downsides reported above.
The massive gaseous part of a galaxy is primarily composed of neutral (HI) and molecular hydrogen (H2). The proportion of these two gas phases in a galaxy disc depends mostly on redshift, SFR and the total stellar mass as outlined by some theoretical and observational studies whose principal findings we briefly summarize below. Lagos et al. (2014, LG14) analysed the look-back time dependence of the HI and H2 spatial densities using the semi-analytic, CDM (Blumenthal et al., 1984) scenario, galaxy formation and evolution code GALFORM (Cole et al., 2000). The authors found that the HI volume density is nearly constant for z 2 and diminishes at higher z. The H2 spatial density correlates with the SFR volume density, augments up to z 3 and shows a gradual decrease for z > 3. In addition the GALFORM study determined that HI is predominant in galaxies with SFR < 1 M⊙ yr-1 and stellar masses M⋆ < 109 M⊙, whereas H2 is more abundant in galaxies with SFR > 10 M⊙ yr-1 and M⋆ > 1010 M⊙. The results of other semi-analytic models with similar physical recipes are consistent with the conclusions of LG14 (Popping et al., 2014; Fu et al., 2012). Contrasted with observations, the results of LG14 at z 0 are congruent with estimates of the current overall HI and H2 densities performed respectively by Martin et al. (2010) using data from the Arecibo Legacy Fast ALFA survey (ALFALFA, Giovanelli et al. 2005) and by Keres et al. (2003) employing data from the Five College Radio Astronomy Observatory Extragalactic CO Survey (Young et al., 1995). At z 3 measures of the HI volume density of damped Lyman- systems in the optical waveband detected a small variation of the HI mass density with increasing redshift in accordance with the LG14 conclusions (Noterdaeme et al., 2012). At z 2 estimations of the H2 mass density of Berta et al. (2013) are concordant with the predictions of LG14. The hot and warm ionized hydrogen, helium, metals and dust constitute a negligible mass portion of the total baryonic fraction of a galaxy as indicated by the study of Read & Trentham (2005) and we omit the discussion about these components accordingly.
In the next paragraphs we concisely recapitulate the most important observational and theoretical evidences of the existence of the DM, both on cosmological and astrophysical scales. From a cosmological perspective, the CDM theory predicts with very high accuracy the cosmological parameters originated by the cosmic microwave background anisotropies in temperature and density, the baryonic acoustic oscillation and the formation and evolution of large scale structures (Planck Collaboration et al., 2014). Some concerns arise on galactic scale from the comparison between the simulated and the observed DM profile. The cored DM profile measured from observations contrasts with the theoretical prediction of a cuspy profile. On the theoretical ground some solutions have been proposed to lessen this discrepancy. In the following we recapitulate solely the most relevant hypothesis. Governato et al. (2012) investigated a scenario at different redshifts, previously devised by Governato et al. (2010), in which several gas outflows originated by winds from supernova convey energy to the DM particles smoothening the originally simulated cuspy DM profile into a cored one with an inner slope concordant with that observed in dwarf galaxies. Nipoti & Binney (2015) proposed a mechanism where a galactic disc (formed by the gas infall into the DM halo) disrupts into large compact masses that transfer their energy through dynamical friction to the DM particles and consequently softens the initial DM cusp into a core with an inner slope close to zero. Macciò et al. (2015) examined a coupling between cold DM and dark energy with an additional separated warm dark matter component. The authors found the usual cuspy DM profile on galactic mass scales (1012 M⊙), whereas on satellite mass scales (109 M⊙) their simulations develop DM cored profiles with radii of hundreds of parsecs as observed for the Galaxy satellites. From an observational perspective de Blok (2010) reviewed, among other things, possible effects related to the observation process that could affect the determination of the DM density profile. In particular low resolution HI and H long-slit observations suffer low spectral resolution, telescope pointing problems and difficult to quantify non-circular motions that could bias the actual slope of the DM density profile. The author concludes that high resolution H and HI velocity fields, nowadays largely available, substantially decrease the consequences of the observational downsides of the earliest RCs observations leading to a correct determination of the DM profile slope. Regardless the copious theoretical and observational efforts in the last decades, the cuspy/core problem is outstanding and seems hard to address in its totality.
In this paper we continue the study of the total mass distribution in irregular galaxies that we begin in Repetto et al. (2015, RP15) (see also Repetto et al. 2013, RP13 for a more extensive presentation of the adopted methodology), analysing the total mass distribution of the two irregular galaxies UGC 6446 and UGC 7524 performing a stellar population synthesis study to obtain the stellar contribution to the total mass of these two galaxies and deriving the gaseous part of the total mass from the observed HI distribution. We use optical, near infrared photometry and HI surface brightness to account for the stellar and gas mass of UGC 6446 and UGC 7524, respectively. The observed HI RCs provide the total gravitating mass. The election of these two galaxies is dictated by the fact that the velocity fields present negligible deviations from circular motions, as determined by the analysis of the observed radial velocity maps reported in section 4. The corresponding observed HI RCs derived in the same section are consequently suitable to obtain the DM halo and total masses of UGC 6446 and UGC 7524. We test five DM models in an attempt to determine which kind of DM velocity profile adequately fits the DM RCs of UGC 6446 and UGC 7524. Our strategy parametrizes the DM component alone because the stellar and gaseous velocity profiles are derived directly from observations, independently from the fitting procedure of the DM velocity profile. The determination of the DM amount is then reduced to the subtraction of the baryonic circular velocity components form the observed RC.
This work is structured in the following manner: in section 2 we perform 2D isophotal analysis of the photometric discs of UGC 6446 and UGC 7524 to obtain the number and type of stellar components present in their discs. In section 3 we estimate the stellar and neutral gas plus helium plus metals RCs. In section 4 we derive the observed HI RCs and DM mass content of the two irregular galaxies subject of this article. In section 5 we analyse the fits to various DM halo models. Section 6 is dedicated to discuss possible issues related to our DM estimates. The conclusions are highlighted in section 7
2 UGC 6446 and UGC 7524 Galfit 2D isophotal analysis
UGC 6446 is morphologically classified in the EFIGI catalogue (Baillard et al., 2011) as a transition between spiral and irregular with very weak bulge and no obvious sign of an ordered spiral structure. The NED and HYPERLEDA111http://leda.univ-lyon1.fr/ (Makarov et al., 2014) morphological types of UGC 6446 are respectively Sd and Scd concordant with the EFIGI catalogue. McDonald et al. (2009, MCD09 hereafter) performed 1D bulge-disc decomposition of UGC 6446 , among other 65 spiral galaxies in the Ursa Major cluster of galaxies, using K′ band photometry from Tully et al. (1996), finding that UGC 6446 has a very faint bulge fitted by a Sersic profile (Sersic, 1968). We accomplished the 2D bulge-disc decomposition of UGC 6446 with the GALFIT software (Peng et al., 2002, 2010) considering a Sersic profile for both bulge and disc. We performed the 2D Sersic disc fit on the Hubble Space Telescope (HST) F606W image, and the 2D Sersic bulge fit on the 2MASS J band image (Skrutskie et al., 2006). The resultant parameters are listed in Table 1.
| UGC 6446 | mag(1) | rs(2) | ns(3) | q(4) | pa(5) |
|---|---|---|---|---|---|
| Disc | 18.81 | 1.70 | 0.8 | 0.76 | 22.44 |
| Bulge | 17.22 | 0.58 | 0.44 | 0.53 | 25.77 |
| UGC 7524 | mag | rs | ns | q | pa |
| Disc | 19.76 | 3.93 | 2.56 | 0.61 | -42.71 |
| (6) | rout(7) | (8) | q | pa | |
| Bar | 25.3 | 3.1 | 2.26 | 0.12 | -59.75 |
-
1
Apparent magnitude
-
2
Disc scale length (kpc)
-
3
Sersic index
-
4
Axis ratio
-
5
Position angle (degrees)
-
6
Central Surface Brightness (mag arcsec-2)
-
7
Outer truncation radius (kpc)
-
8
Outer truncation sharpness (Central slope =0)
The morphological classification of UGC 7524 (NGC 4395) is SA(s)m in the NED database, SABdm (Ann et al., 2015) in the HYPERLEDA and SIMBAD (Wenger et al., 2000) database. We accomplished the GALFIT 2D disc isophotal analysis of UGC 7524 employing a Sersic profile for the disc. The Sersic function was adjusted to the SDSS DR7 (Frieman et al., 2008) g band image. We fit the bar component with a Ferrers profile (Ferrers, 1877) adjusted to the 3.6m IRAC image of the Spitzer infrared satellite. The results of the 2D disc and bar fits are tabulated in Table 1. The stellar components detected in this section for UGC 6446 and UGC 7524 are included in the stellar mass models presented in the next sections.
3 Baryonic RCs estimates
3.1 Stellar RCs
The use of stellar population synthesis (SPS) models (e.g., Bruzual & Charlot, 2003, BC03), as a mean to convert stellar light into mass (through M/L) has been frequently promoted (e.g., Bell & de Jong, 2001; Bell et al., 2003). Notwithstanding its common degeneracies (e.g. age-metallicity-dust) SPS models can assess reliable mass estimates in general. Different studies have acknowledged that the main systematic uncertainty in mass estimates via SPS fitting comes from different treatments of the TP-AGB phase (Maraston et al., 2006; Bruzual, 2007; Kannappan & Gawiser, 2007; Conroy et al., 2009). For instance, the BC03 models adopt the physical properties of TP-AGB stars from Vassiliadis & Wood (1993), while the 2007 version of Bruzual & Charlot SPS models (CB07) uses the Marigo & Girardi (2007) prescription. The CB07 models produce brighter near infrared (NIR) magnitudes, in consequence the CB07 mass estimates are lower, by a factor of , when compared to BC03.
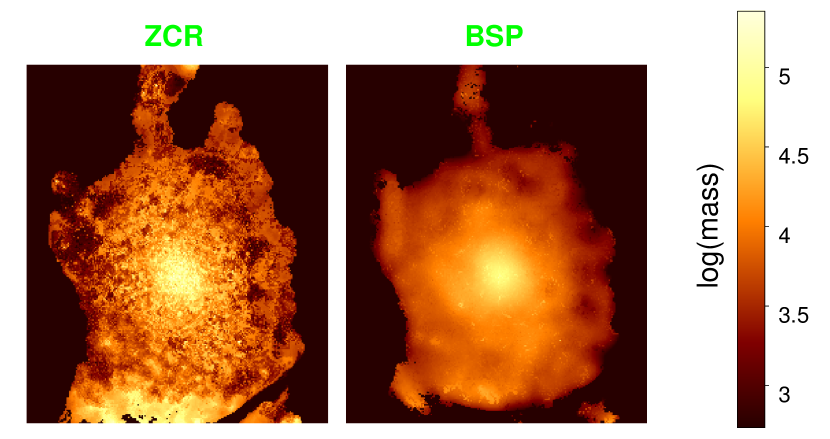
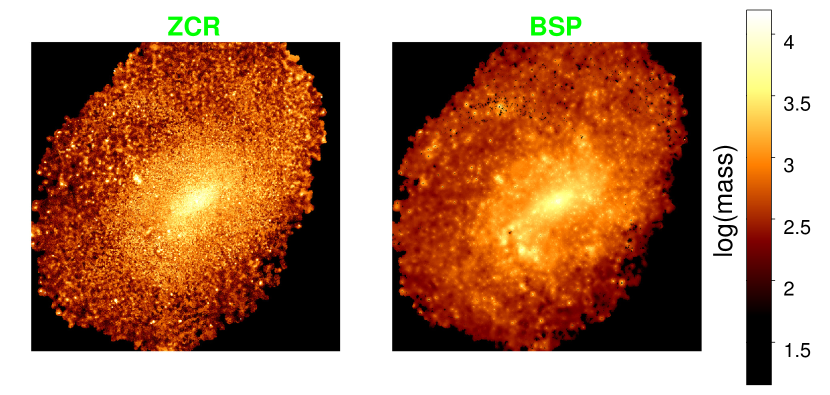
One innovative technique in mass estimates is the “resolved stellar mass map method” (Zibetti et al., 2009, ZCR), which delivers a map of the stellar mass surface density by photometric means. Galaxy masses determined by unresolved means (where galaxies are treated as point sources) are subject to underestimations, thus the need for resolved structures (Zibetti et al., 2009; Sorba & Sawicki, 2015). Despite its potential, the ZCR method produces biased spatial structures which contradict the expectations from NIR imaging. The bias consists of a morphology with filaments, and a spatial coincidence between dust lanes and stellar mass surface density. The bias is due to a limited M/L accuracy ( dex) arising from uncertainties inherent to observations, and degeneracies in SPS models (Martínez-García et al., 2017).
3.1.1 The Bayesian successive priors (BSP) algorithm
The BSP algorithm (Martínez-García et al., 2017) is intended to solve for the bias in the ZCR method. The innovation consists in the use of prior information regarding the spatial distribution of the stellar surface mass density as deduced from observations. The massive older population of a galaxy is mainly traced in the NIR bands, specially the -band (Rix & Rieke, 1993).
The BSP algorithm is intended to work with surface photometry, and a Monte Carlo SPS library with several templates. Taking into account adequate probability distributions for the star formation history (SFH), the stellar metallicity, and the dust content, the SPS library is built using Montecarlo methods (e.g., da Cunha et al., 2008; Magris C. et al., 2015). The BSP algorithm is independent of the choice of the SPS library. The algorithm consists of three iterations, and is applied on a pixel-by-pixel basis by using Bayes’ theorem
| (1) |
where is the probability of having M/L for a certain stellar population if colours are observed from the photometry, i.e., the posterior M/L probability. All the M/L values in the BSP algorithm correspond to a NIR band, e.g., the -band. The prior M/L probability distribution is given by , and represents any previous knowledge we may have about the expected M/L. is a normalisation constant. The probability is usually determined by fitting the observed colours to the colours of the SPS library templates via minimisation, or maximum likelihood methods. In these cases the prior probability distribution, , is assumed to be flat, i.e., each template in the SPS library has the same probability to be fitted. This does not considers the probability distributions of the SFH, metallicity, or dust content inherent to the construction of the SPS library. The novelty in the BSP algorithm consists of using a non-flat prior probability distribution, , when fitting the observed colours to the SPS library templates. The three iterations in the BSP algorithm are as follows.
-
1.
In the first iteration we use a flat prior probability distribution, i.e., constant. Then we fit the observed colours to the templates in the SPS library via a maximum likelihood estimate, i.e., maximising the probability
(2) Until this point the algorithm is similar to the ZCR method. Then we identify all the pixels where the difference between the observed colours, and the SPS library colours, is less than , where is the uncertainty in the observed photometry. This guarantees that each pixel can be described by at least one template in our SPS library. Next we use the posterior NIR M/L from all the fitted pixels and calculate the statistical median.
-
2.
In the second iteration the median NIR M/L from iteration number 1 is used as a constant parameter, i.e., , throughout the disc. The probability distribution function (PDF) is now assumed to be a Gaussian of the form
(3) where M/L is determined from the fitted templates, and is the photometric uncertainty in M/L. Under these new assumptions we fit all the pixels by using
(4) Subsequently, we identify the pixels where the difference between the observed colours, and the SPS library colours is less than . In this case, is estimated from the resulting “colour differences” between the observed colours of the pixels, and the colours of the fitted templates. We compute the 16th and 84th percentiles222The number where a certain percentage of values fall below that percentile. belonging to the distribution of values obtained from these “colour differences”, arising from all the adopted pixels. Then we estimate as the difference between the 84th percentile and the 16th percentile, divided by 2. The identified pixels whose “colour differences” fulfill the condition will be the “backbone” of our mass map. The rest of the pixels belong mainly to relatively young luminous red stars, low surface brightness regions in the outskirts of the disc, and high extinction regions. For these pixels we used the information from the “backbone” pixels to interpolate the stellar mass surface density, and obtain new NIR M/L ratios. The interpolation is done with the purpose that the resolved mass map resembles the NIR spatial distribution of the old stellar disc.
-
3.
The third and last iteration is intended to deal only with the interpolated pixels in iteration number 2. We apply Bayes’ theorem with the new NIR mass-to-light ratios which are used as independent parameters, , in equation 3. We adopt a pixel-by-pixel treatment, and after fitting via equation 4, we obtain a bias-free stellar mass surface density map.
In this paper we apply the BSP algorithm to UGC 6446 and UGC 7524. We used SDSS DR12 (Alam et al., 2015), , and -band photometry, as well as IRAC channel 1 imaging from “The Spitzer Survey of Stellar Structure in Galaxies” (S4G, Sheth et al., 2010). SDSS data were registered and resampled to the S4G data. The Adaptsmooth (Zibetti, 2009) code was used to increase the S/N ratio in the outskirts of the discs. We adopt the optical-NIR branch of the MAGPHYS333http://www.iap.fr/magphys/magphys/MAGPHYS.html library (da Cunha et al., 2008), which includes the CB07 SPS models. The resulting resolved mass maps are shown in Figures 1 and 2, for UGC 6446 and UGC 7524 respectively. In these figures we also compare the results obtained by applying the ZCR method where we notice a bias in the spatial structure. This bias is even more evident for normal spirals with prominent dust lanes (see, e.g., Martínez-García et al., 2017). For the objects analysed, we found that by applying ZCR, instead of the BSP algorithm, the integrated stellar masses are overestimated by a factor of . In Figures 3 and 4 we show the azimuthal averages of the stellar mass surface density, , and the stellar mass-to-light ratio, , as a function of radius, for UGC 6446 and UGC 7524 respectively. We assume a distance of 121 Mpc and 3.50.4 Mpc for UGC 6446 and UGC 7524, respectively. The deprojection parameters are those presented in Table 2 (present work).
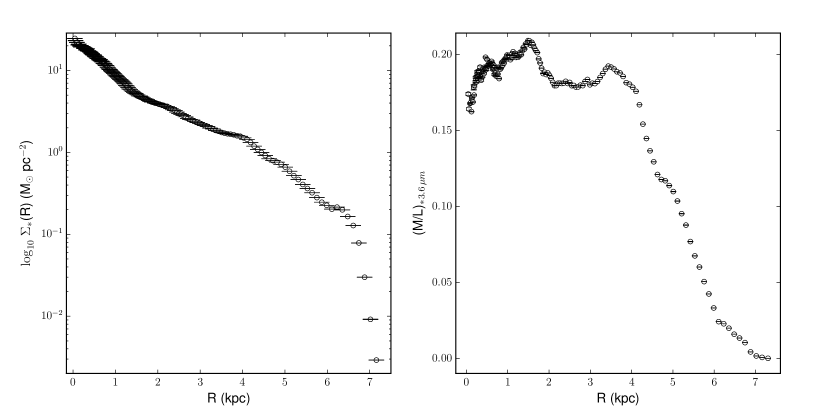
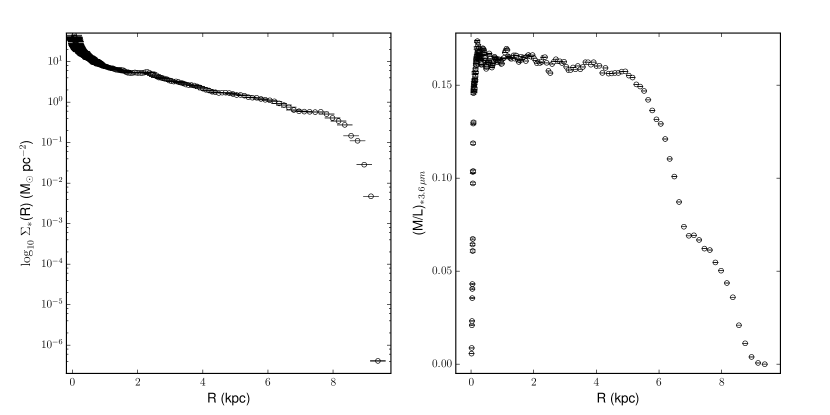
At this point, it is important to stress that in order to produce the stellar mass surface densities curves displayed in the left panels of Figure 3 and 4 we used the whole M/L curves showed in the right panels of the same figures. In addition we compute the total stellar mass and luminosity at 3.6m of UGC 6446 and UGC 7524 from the corresponding 2D maps adding the contribution of each single pixel. We obtain a total stellar mass of 2.22108 M⊙ and a total luminosity at 3.6m of 1.14109 L⊙ for UGC 6446. For UGC 7524 the total stellar mass is 3.82108 M⊙ and the total stellar luminosity at 3.6m is 2.41109 L⊙. From these estimations we derive an average of 0.19 and 0.16 for UGC 6446 and UGC 7524 respectively.
The stellar RCs of UGC 6446 and UGC 7524 (see Figure 6) are obtained from the stellar mass surface densities of Figures 3 and 4 following the recipe of Casertano (1983) as implemented in the ROTMOD procedure of the Groningen Imaging Processing System (GIPSY444http://www.astro.rug.nl/gipsy/) (Allen et al., 1985; van der Hulst et al., 1992), that calculates the RC for a certain density law.
3.2 HI+He+metals RCs
We obtain the HI full resolution ( ) total density maps (as well as velocity fields) of UGC 6446 and UGC 7524 from the WHISP555http://wow.astron.nl (Westerbork HI Study of Spirals) survey database (Swaters et al., 2002). We derive the neutral gas surface density of UGC 6446 and UGC 7524 from the HI total density maps of both galaxies by means of the ELLINT task of the GIPSY package, using the deprojection parameters of van Eymeren et al. (2011a, see Table 2).
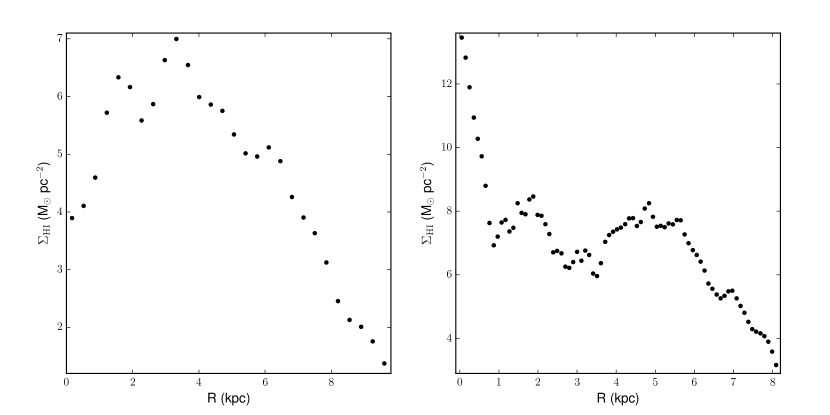
The ELLINT procedure computes the HI surface density profile dividing the HI total density map into elliptical concentric rings, computing the mean surface density in each ring, and summing the latter quantity over the total number of annuli. The mean surface density is the azimuthal average of the flux in each pixel of a given ring under the supposition of a linear relation between flux and mass. The gas circular velocities are built from the surface density profiles of both galaxies with the ROTMOD routine. The HI+He+metals RCs of UGC 6446 and UGC 7524 are atomic hydrogen RCs multiplied by a factor . The HI surface density profiles of UGC 6446 and UGC 7524 are displayed in Figures 5. The HI+He+metals RCs for both galaxies are shown in Figure 6.
4 Observed HI and DM RCs
We employ a tilted rings fitting method through the GIPSY routine ROTCUR to generate the observed HI RCs of UGC 6446 and UGC 7524 from the full resolution velocity fields of both galaxies, using the kinematic parameters of van Eymeren et al. (2011a) as first guess values for the ROTCUR fit.
We assume pure circular motion for both galaxies and fit the approaching and receding sides of both velocity fields keeping fixed the rotation velocities and allowing to vary in turn the position angle and inclination. We note no significant radial variation of the position angles and inclinations of both galaxies therefore we fixed those parameters close to their initial values. Next we let vary the rotation velocities of UGC 6446 and UGC 7524 determining the approaching and receding RCs of both galaxies. The residual velocity fields determined through the subtraction of the synthetic circular velocity fields from the observed velocity fields of both galaxies for the approaching and receding sides show velocities smaller than 15 km s-1 and the velocity difference between the approaching and receding residual velocity field of UGC 6446 is less than 1 km s-1 whereas for UGC 7524 this discrepancy is 2 km s-1.
| Present work | UGC 6446 | UGC 7524 |
|---|---|---|
| (hms)(5) | 11 26 38.2 | 12 25 51.5 |
| (dms)(5) | 53 44 51.5 | 33 32 13.7 |
| Vsys(6) | 646.4 | 318.3 |
| P.A.(7) | 191.3 | 325.1 |
| INCL.(8) | 50.6 | 47.2 |
| (9) | 0.004 | 0.003 |
| VE(10) | UGC 6446 | UGC 7524 |
| (hms)(5) | 11 26 40.7 | 12 25 50.4 |
| (dms)(5) | 53 44 51.0 | 33 32 35.0 |
| Vsys(6) | 646.0 | 317.0 |
| P.A.(7) | 191.1 | 324.9 |
| INCL.(8) | 50.5 | 46.9 |
| (9) | 0.006 | 0.002 |
The derivation of the RCs for the entire velocity fields of both galaxies proceeds with the determination of the kinematic centres and systemic velocities respectively, fixing the remaining parameters. The final step consists in the derivation of the RCs for both halves of the velocity field of UGC 6446 and UGC 7524. The corresponding RCs best fit parameters and the comparison with van Eymeren et al. (2011a) are reported in Table 2. The errors associated to the inclinations, position angles and systemic velocities derived in the present work, are less than 1∘ and 1 km s-1 respectively.
We estimate the intensity of the kinematic lopsidedness of UGC 6446 and UGC 7524 utilizing the relation of Jog (2002), that considers the kinematic lopsidedness as a perturbation induced by a lopsided DM halo gravitational potential on an initial axisymmetric galactic disc. The determined lopsidedness parameters for UGC 6446 and UGC 7524 are in good agreement with those obtained by van Eymeren et al. (2011a). From our estimates we conclude that the degree of kinematic lopsidedness of UGC 6446 and UGC 7524 is small, consequently the velocity fields and the corresponding observed HI RCs are not so much affected by the lopsided perturbation. Swaters et al. (2002) classified UGC 6446 and UGC 7524 as objects with a strong kinematic lopsidedness. This classification is based on a qualitative “by eye inspection” of the observed velocity fields of both galaxies. We use a more quantitative criterion to determine the degree of kinematic lopsidedness of UGC 6446 and UGC 7524 and we reach opposite conclusions. The comparison withSwaters et al. (2002) is complicated by the fact that they do not provide quantitative information about the degree of the detected kinematic lopsidedness, whereas with the criterion of Jog (2002), that we apply to UGC 6446 and UGC 7524, 0 reveals that the analysed galactic discs have very weak or absent kinematic lopsidedness.
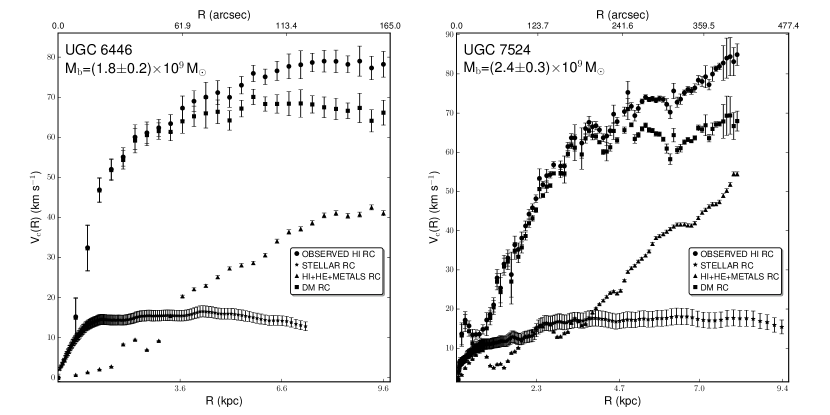
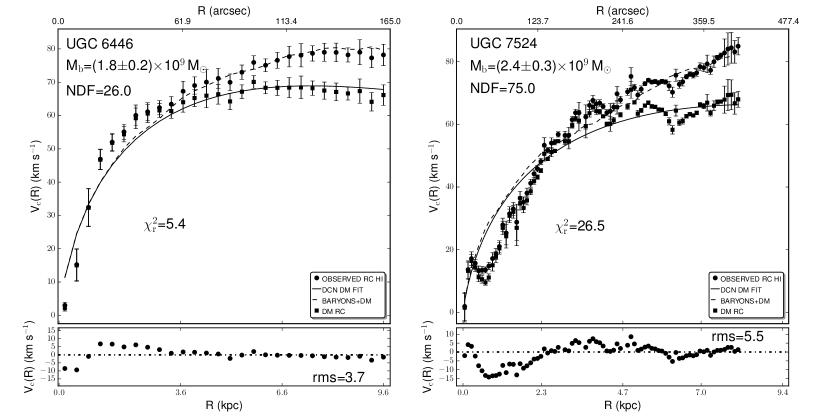
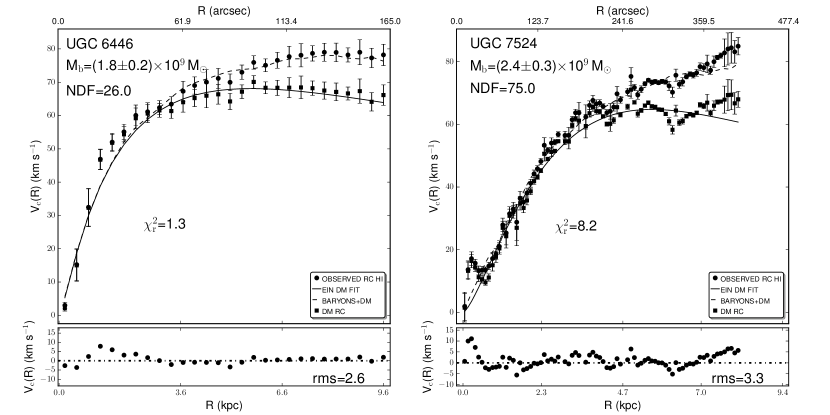
The derivation of the stellar and gas RCs is described in section 3. The DM RCs of UGC 6446 and UGC 7524 and the associated error bars are calculated by means of the relation V=V-(V+V), where Vh are the DM halo RCs, Vtot are the observed HI RCs, V⋆ and Vgas represent the stellar and HI+He+metals RCs respectively. The error bars of the stellar and gas RCs are estimated considering the uncertainties related to each components separately, being 17 and 23 for the stellar RCs of UGC 6446 and UGC 7524, respectively. For the atomic gas RC of UGC 6446 we estimate an uncertainty of 3, as established through the propagation of the errors associated to the measures of the global neutral hydrogen flux by Verheijen & Sancisi (2001). For the neutral gas RC of UGC 7524 we estimate 2 as derived by means of the propagation of the errors relative to the overall neutral hydrogen flux of this galaxy estimated by Wolfinger et al. (2013). Figure 6 displays the observed HI RCs, the baryonic RCs, and the DM RCs of UGC 6446 and UGC 7524.
We estimate the total masses of the stellar discs of UGC 6446 and UGC 7524 through the relation M(r)=2 (R) R dR, where (R) represent the stellar surface densities of both galaxies displayed in the left part of figures 3 and 4, and the upper limit of integration corresponds to 7.3 kpc and 9.4 kpc for UGC 6446 and UGC 7524 respectively. We employ the baryonic Tully-Fisher relation of McGaugh (2012) to derive the total baryonic, gas, and neutral gas masses of UGC 6446 and UGC 7524. The adopted maxima of circular velocity are 79 km s-1 and 85 km s-1 for UGC 6446 and UGC 7524, respectively. The neutral hydrogen mass is provided by the expression MHI=(Mg/1.33)-MH2 of McGaugh (2012) to correct the total gas mass Mg for the presence of helium and molecular hydrogen. Molecular hydrogen masses (see also section 6) were taken from Leroy et al. (2005), Watson et al. (2012) and Böker et al. (2011).
We obtain for UGC 6446 a stellar, total gas and neutral gas masses of (2.30.3)108 M⊙, (1.60.2)109 M⊙ and (1.20.2)109 M⊙ respectively, and a baryonic total mass of (1.80.2)109 M⊙. The stellar, total gas and neutral gas masses of UGC 7524 are (3.90.9)108 M⊙, (2.10.3)109 M⊙ and (1.30.3)109 M⊙ respectively. The baryonic total mass of UGC 7524 is (2.40.3)109 M⊙ It is important to note that the stellar masses of UGC 6446 and UGC 7524 derived in this section are completely congruent with the stellar masses estimated at the end of section 3.
5 Fits to DM halo models
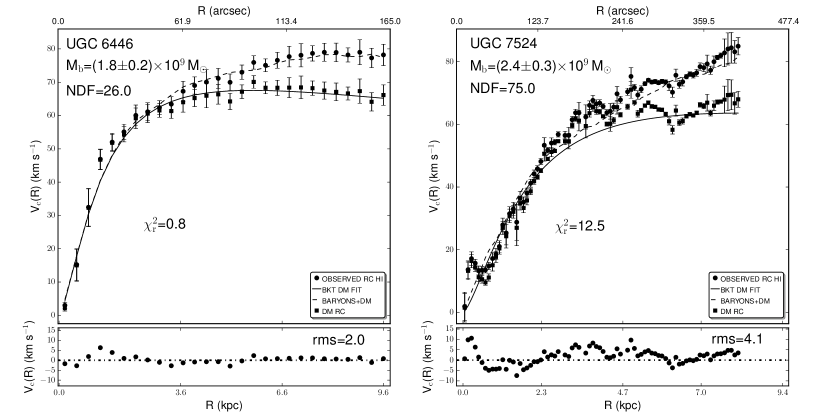
We fit the DM RCs of the two galaxies under study to obtain an estimation of the total mass of UGC 6446 and UGC 7524 which is the sum of the DM RCs fit results and the stellar and neutral gas plus helium plus metals RCs. The resulting DM halos masses and the corresponding total masses of both galaxies are presented in Table 3. It is important to emphasise that the fits to DM RCs are models with two free parameters and represent the unique parametrization applied in this work because the stellar and neutral gas RCs are processed data gathered through observations. We describe below the fitting procedure adopted in the current analysis and outline the principal findings on the mass content of UGC 6446 and UGC 7524. Following RP15 we accomplish the DM mass derivation of UGC 6446 and UGC 7524 by means of the Minuit curve fitting program within the ROOT666https://root.cern.ch software package (Brun & Rademakers, 1997). The Minuit routine provides two important tools to corroborate the validity of the DM RCs fitting solutions: an utility to scan the parameter space and a procedure to build the n-sigma contours of the final results. The n-sigma contours represent the ellipses of points describing the uncertainties of the fitted DM halo masses and radii and are an important instrument to evaluate the reliability of the solutions. The best results are expected to stay inside the innermost ellipse close to the centre. Another important quantity to validate the goodness of a certain solution is the Estimated Distance to the (global) Minimum (EDM): an EDM value closer to zero indicates a successful fitting function minimization. These features motivate our election of the Minuit curve fitting program to perform the RCs analysis of UGC 6446 and UGC 7524.

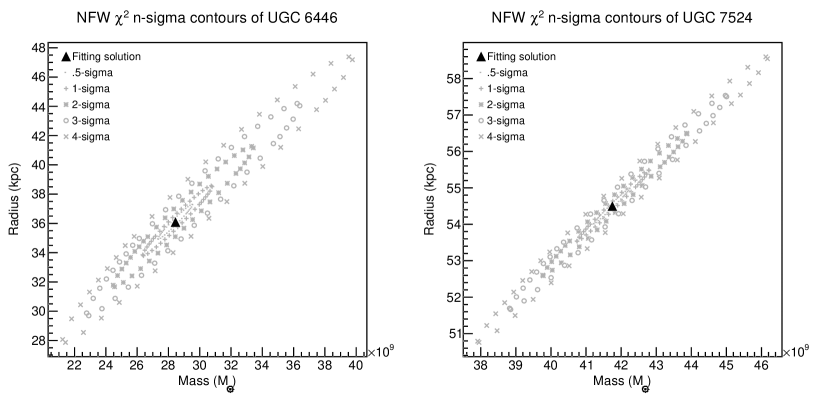
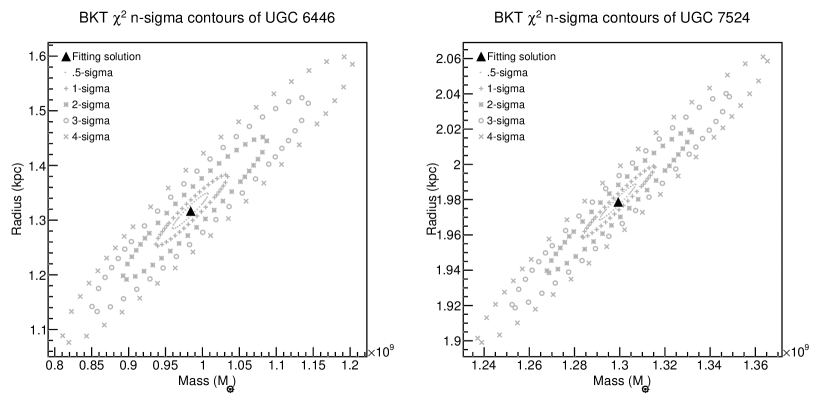
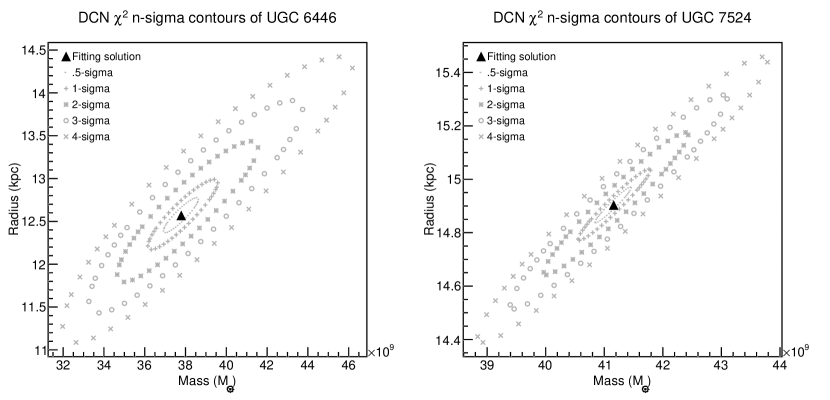
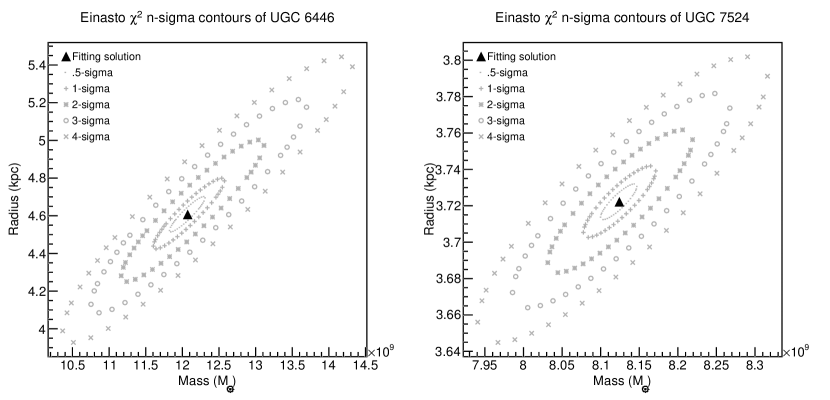

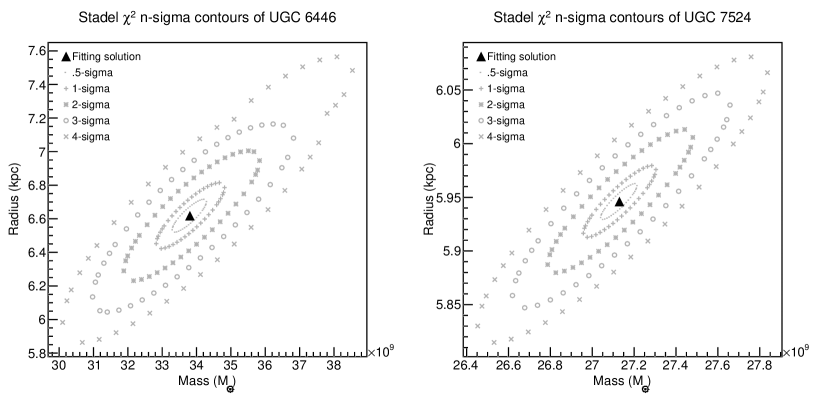
The DM models used in the present study are the same employed in RP15: the Navarro et al. (1996) DM halo (NFW), the Burkert (1995) DM halo (BKT), the Di Cintio et al. (2014) DM halo (DCN), the Einasto (1965) DM halo (EIN) and the Stadel et al. (2009) DM halo (STD). We use the Dutton & Macciò (2014) prescription for the concentration parameter and the approximation of MacArthur et al. (2003) where the recipe of Ciotti & Bertin (1999) is not valid for the EIN DM halo. The NFW, BKT and DCN DM halo profiles have two free parameters, namely, the halo mass and radius, whereas the EIN and STD DM halo profiles have an additional parameter characterizing the shape of the DM halos profile. As in RP15 we fix the third parameter of EIN and STD allowing solely the variation of the halo mass and radius. The EIN shape parameter was set to 1.8 and 0.72 respectively for UGC 6446 and UGC 7524, whereas the STD shape parameter was fixed to 3.7 and 3.1 separately for UGC 6446 and UGC 7524. These values are the product of an extensive test search that fixes the third parameter to a new value at each run of the two free parameters. We fix the third parameter whenever the reduced , EDM and n-sigma contours indicate that the RCs fitting process reached the expected global minimum. The range of admitted values of the DM halos masses and radii are [108, 1013] M⊙ and [0.1, 100] kpc, respectively. The main results are displayed in figures 7 – 16 and are listed in Table 3. We provide in pictorial form the solutions of NFW, BKT, DCN, EIN and STD DM models together with the corresponding n-sigma contours and the range of variation of the free parameters.
| DMMs(11) | Mtot (M⊙)(12) | Mh (M⊙)(12) | Rh(13) | (14) | EDM(15) |
| NFW | 3.00.2 | 2.80.2 | 36.02.4 | 3.6 | 2.5 |
| BKT | 0.30.03 | 0.10.005 | 1.30.07 | 0.8 | 2.6 |
| DCN | 4.00.2 | 3.80.2 | 13.00.4 | 5.4 | 7.9 |
| EIN | 1.40.07 | 1.20.05 | 4.60.2 | 1.3 | 2.4 |
| STD | 3.60.1 | 3.40.1 | 6.60.2 | 1.4 | 4.1 |
| NFW | 4.40.1 | 4.20.1 | 55.01.0 | 24.4 | 4.3 |
| BKT | 0.40.02 | 0.10.002 | 2.00.02 | 12.5 | 2.5 |
| DCN | 4.40.1 | 4.10.06 | 15.00.1 | 26.5 | 3.8 |
| EIN | 1.10.03 | 0.80.005 | 3.70.02 | 8.2 | 5.0 |
| STD | 3.00.04 | 2.70.02 | 6.00.03 | 7.1 | 1.8 |
-
(11)
DM halo models.
-
(12)
Total masses and DM halo masses normalized by .
-
(13)
DM halo radii in kpc.
-
(14)
Reduced normalized by the number of degrees of freedom.
-
(15)
Estimated distance to the minimum (see text).
From the reduced values, EDM, the n-sigma contours, the parameters scan intervals, and the fits visualisations it is evident that the NFW DM model adjusts the DM RCs of UGC 6446 and UGC 7524 better than the DCN DM halo, nevertheless EIN, BKT and STD DM models reproduce more adequately the DM RCs of UGC 6446 and UGC 7524. The BKT DM halo performs better than any other DM halo used in this analysis for UGC 6446, however for UGC 7524 the STD solution is the best. The DCN DM model does not reproduce the DM RCs of UGC 6446 and UGC 7524 properly. The inner slope of the DCN DM halo is close to a cuspy profile with values near to 0.38 and 0.36 for UGC 6446 and UGC 7524, respectively. In general the two exponential DM models used in this work, EIN and STD behave better for UGC 7524 or nearly at the same level for UGC 6446 than the BKT DM model. This trend confirms some of the conclusions attained in RP15.
| Authors | V200 (km s-1) | c200 | (M pc-3) | rh (kpc) |
|---|---|---|---|---|
| PW(16) | 58.2 | 12.0 | (100.04.0)10-3 | 1.30.07 |
| PW | 57.4 | 11.5 | (34.02.0)10-3 | 2.00.02 |
| SW11(17) | —— | —— | (120.020.0)10-3 | 0.950.1 |
| SW11 | —— | —— | (59.07.0)10-3 | 1.50.1 |
| VB01(18) | 52.0 | 17.4 | —— | —— |
| VB01 | 72.0 | 8.5 | —— | —— |
-
(16)
Present work, the first row is for UGC 6446 and the second for UGC 7524 for each authors listed in the table.
-
(17)
Pseudo-isothermal DM model.
-
(18)
NFW DM halo.
We compare the results of the BKT DM halo and the NFW DM halo for UGC 6446 and UGC 7524 with the findings of van den Bosch & Swaters (2001) (VB01) and Swaters et al. (2011) (SW11). VB01 studied 20 dwarf galaxies, including the two galaxies object of the present study, to derive the concentration parameters and the circular velocities where the contrast between the universe mean density and the DM halo average density is 200 (i.e. V200). The authors used the NFW DM model and derived the stellar and gas discs from R-band surface brightness profiles and HI profiles respectively, assuming a constant M/L. SW11 analysed the HI RCs of nearly the same group of galaxies of VB01 to determine the DM central densities and scale radii of the entire sample. The authors employed the Pseudo-Isothermal DM model and obtained the baryonic discs as in VB01. The results of SW11, VB01 and the outcomes of the present study for UGC 6446 and UGC 7524 are listed in Table 4. From the values of V200 and c200 reported in Table 4 it is apparent the concordance with VB01, even though the adopted definition of the NFW DM halo concentration in our work differs from that used in VB01. The central densities and core radii of the BKT DM model in the present study are in general concordant with the corresponding quantities of the Pseudo-isothermal DM halo employed in SW11, even though a direct comparison is difficult because of the distinct DM model used, the different assumptions on the M/L ratio and the diverse methods employed in our analysis to obtain the baryonic content.
6 Possible problems in DM content estimates
The current section addresses the principal issues related to the determination of the DM and total mass of UGC 6446 and UGC 7524 such as for instance the proper estimation of possible non circular motions, the spectral types included in the stellar RCs of UGC 6446 and UGC 7524 and the gaseous phases contained in the HI+He+metals RCs of both galaxies. These three points are of fundamental importance to appraise the reliability of the total observed HI RCs and the stellar and neutral gas plus helium plus metals RCs of UGC 6446 and UGC 7524. In the next paragraphs we discuss separately the three topics outlined above and the respective implications.
-
1.
In section 4 we estimate that the degree of kinematic lopsidedness of both galaxies is negligible consistently with the findings of van Eymeren et al. (2011a). The morphological lopsidedness of UGC 6446 and UGC 7524 as derived by van Eymeren et al. (2011b) through harmonic analysis of the total HI density map of both galaxies is comparatively higher than the kinematic lopsidedness estimated in the same paper (see their table A.1). The authors conclude that for the sample of analysed galaxies the most probable cause of the observed lopsidedness is interaction with nearby companions. In the particular case of UGC 6446 and UGC 7524, the hypothesis of tidal encounters as the generating mechanism of lopsidedness seems reasonable since both galaxies are members of two different agglomeration of galaxies. UGC 6446 belongs to the Ursa Major group of galaxies a conglomerate of 79 recognized members at a distance of 19 Mpc and with a velocity dispersion of 150 km s-1 (Verheijen & Sancisi, 2001). UGC 7524 is part of the Coma I cloud, an aggregation of 132 galaxies at a distance less than 5 Mpc and with a velocity dispersion of 307 km s-1 (Boselli & Gavazzi, 2009). The larger velocity dispersion of the Coma I cloud indicates a higher rate of interactions between the galaxies in this group with respect to the galaxies in the Ursa Major agglomerate. As a consequence, we expect that objects in groups with a high velocity dispersion manifest a considerable amount of lopsidedness when compared to agglomerations of galaxies with small velocity dispersion. This conclusion is partially confirmed by the results of van Eymeren et al. (2011b) because the morphological lopsidedness of UGC 6446 is smaller than that of UGC 7524. van Eymeren et al. (2011a) and our estimates of the kinematic lopsidedness of both galaxies clearly contradict the expected trend reported above as one can see from Table 2. Angiras et al. (2007) perform harmonic analysis of the HI total density maps and velocity fields of UGC 6446 and other 10 galaxies of the Ursa Major group. The authors find a kinematic lopsidedness for UGC 6446 of nearly a factor of ten higher with respect to van Eymeren et al. (2011a) and our estimates. We are not aware of a work similar to that of Angiras et al. (2007) for UGC 7524, however we might guess for this galaxy a difference comparable or higher to that estimated for UGC 6446 between the values of kinematic lopsidedness computed by van Eymeren et al. (2011a) and this article and an hypothetical study employing the methods of Angiras et al. (2007). The reported discrepancy is not surprising and relies on the different methods used by the quoted authors to compute the kinematic lopsidedness. The procedure of Jog (2002), applied by van Eymeren et al. (2011a) and this study, measures the intensity of the lopsided perturbation as the difference between the maximum velocities of the receding and approaching side of the RC normalized by twice the maximum of the circular velocity of both sides of the same RC. This technique is a very powerful tool to determine the degree of kinematic lopsidedness within the angular sector where the RC is derived. On the other hand, the methodology employed by Angiras et al. (2007) searches for possible deviations from circular (or projected elliptical) motions across the entire 2D velocity field and interprets these deviations as Fourier modes. This latter technique quantifies the kinematic lopsidedness of the whole radial velocity map, not only of the region near the kinematic major axis where the RC is determined. The disparity in the measured values of the kinematic lopsidedness obtained by the application of the two different approaches are well accounted by the papers quoted above at least in the case of UGC 6446. In this work we are interested in the local effect of the kinematic lopsidedness on the observed RCs of UGC 6446 and UGC 7524, consequently the application of the method of Jog (2002) seems adequate to our purpose and as a consequence the kinematic lopsidedness has a negligible effect in the derivation of the observed RCs of the two galaxies studied in this paper as established in section 4.
-
2.
The stellar discs of UGC 6446 and UGC 7524 harbour the variety of spectral types (together with gas, dust and interstellar medium) capable to produce the observed photometry available in the literature of both galaxies covering an approximate wavelength range from the far ultraviolet (0.1 m) to the far infrared (103 m). The SPS approach we employed in this work (e.g. Bruzual & Charlot (2003)) to obtain the stellar mass maps, surface densities and RCs of UGC 6446 and UGC 7524 encompasses the necessary values of temperatures, masses, ages and also some crucial phases of stellar evolution such as core convective overshooting, prescriptions for TP-AGB stars and mass-loss. As a consequence SPS models properly reproduce the stellar populations that actually inhabit the stellar disc of both galaxies. On the other hand, stellar rotation and binary evolution are not included in the SPS model we used to build the surface densities and these omissions could in principle affect the determination of the total mass. As we emphasised in the introduction stellar rotation produces bluer SPS colors and higher luminosities with respect to SPS without rotation. The net result of using SPS without rotation could lead to an overestimation of the stellar population masses by a factor of two (Vázquez et al., 2007). The authors caution that their work is preparatory and much more efforts are needed to evaluate the complete reliability of their main findings. As established by Eldridge et al. (2008) the effect on SPS from binary evolution of non rotating companions are comparable to some degree to the consequences of rotating single stars. Nevertheless, in the present investigation we do not incorporate UV observations of early-type galaxies, and therefore the effects of binary evolution should be negligible (Hernández-Pérez & Bruzual, 2013). Summarising the estimated stellar RCs of UGC 6446 and UGC 7524 should reproduce the actual stellar RCs with reasonable confidence.
-
3.
The total mass of atomic hydrogen of UGC 6446 and UGC 7524 according to Swaters et al. (2002) is 1.3109 M⊙ and 1.0109 M⊙ inside a radius of 11 kpc and 9 kpc (adopting a distance of 12 and 3.5 Mpc) respectively. Leroy et al. (2005) accomplished a CO survey of the central regions of 121 dwarf galaxies to measure the amount of H2 in these objects and reported no detection of CO emission for UGC 6446. This result is confirmed by the study of Watson et al. (2012) that analyse the molecular gas surface density of 20 galaxies of morphological types Sd-Sdm. The mass of molecular hydrogen in the central region of UGC 7524 is 2.0105 M⊙ according to the estimation of Böker et al. (2011). The global mass of atomic and molecular hydrogen of UGC 7524 as estimated by Stark et al. (1987) is 1.2109 M⊙ and 2.0108 M⊙ separately. From these data we conclude that the neutral gas plus helium plus metals RCs of UGC 6446 and UGC 7524 derived in this work represent a good approximation to the total gas mass of these two galaxies given that other gaseous phases constitute a negligible mass amount to the total gas mass budget. In addition our neutral gas mass estimates of (1.20.2)109 M⊙ and (1.30.3)109 M⊙, for UGC 6446 and UGC 7524 respectively, are concordant with those of Swaters et al. (2002).
7 Conclusions
In this article we estimate the total mass of UGC 6446 and UGC 7524 analysing high resolution HI RCs derived from full resolution HI velocity fields. The latter were observed with the Westerbork Synthesis Radio Telescope under the WHISP project. The chief findings about the total mass content of UGC 6446 and UGC 7524 are itemised below.
-
•
The sum of the stellar and neutral gas plus helium plus metals RCs of UGC 6446 and UGC 7524 is unable to reproduce the total observed HI RCs of both galaxies. This fact suggests the necessity of substantial amounts of DM.
-
•
Cored DM models adjust more satisfactory the DM RCs of the galaxies examined in this work with respect to cuspy DM halos.
-
•
The cored DM halo BKT produces the best fit of the UGC 6446 DM RC, whereas the STD cored DM halo provides the best performance for the DM RC of UGC 7524.
In general the two exponential DM models, EIN and STD, with only two free parameters give results similar or better than the cored BKT DM halo. This tendency partially supports the results of RP15 and encourages the study of these two DM models in future works to increase the statistical robustness of our conclusions.
Acknowledgements
We acknowledge the anonymous referee for constructive comments and suggestions. M. R. thanks the DGAPA-PAPIIT IN103116 from UNAM and CY-253085 from CONACYT projects for financial support during the production of this article. We have made use of the WSRT on the Web Archive. The Westerbork Synthesis Radio Telescope is operated by the Netherlands Institute for Radio Astronomy ASTRON, with support of NWO. We acknowledge the usage of the HyperLeda database (http://leda.univ-lyon1.fr). This research has made use of the NASA/IPAC Extragalactic Database (NED) which is operated by the Jet Propulsion Laboratory, California Institute of Technology, under contract with the National Aeronautics and Space Administration. This research has made use of the SIMBAD database, operated at CDS, Strasbourg, France. Based on observations made with the NASA/ESA Hubble Space Telescope, and obtained from the Hubble Legacy Archive, which is a collaboration between the Space Telescope Science Institute (STScI/NASA), the Space Telescope European Coordinating Facility (ST-ECF/ESA) and the Canadian Astronomy Data Centre (CADC/NRC/CSA). This research has made use of the NASA/ IPAC Infrared Science Archive, which is operated by the Jet Propulsion Laboratory, California Institute of Technology, under contract with the National Aeronautics and Space Administration. Funding for SDSS-III has been provided by the Alfred P. Sloan Foundation, the Participating Institutions, the National Science Foundation, and the U.S. Department of Energy Office of Science. The SDSS-III web site is http://www.sdss3.org/.
SDSS-III is managed by the Astrophysical Research Consortium for the Participating Institutions of the SDSS-III Collaboration including the University of Arizona, the Brazilian Participation Group, Brookhaven National Laboratory, Carnegie Mellon University, University of Florida, the French Participation Group, the German Participation Group, Harvard University, the Instituto de Astrofisica de Canarias, the Michigan State/Notre Dame/JINA Participation Group, Johns Hopkins University, Lawrence Berkeley National Laboratory, Max Planck Institute for Astrophysics, Max Planck Institute for Extraterrestrial Physics, New Mexico State University, New York University, Ohio State University, Pennsylvania State University, University of Portsmouth, Princeton University, the Spanish Participation Group, University of Tokyo, University of Utah, Vanderbilt University, University of Virginia, University of Washington, and Yale University.
References
- Alam et al. (2015) Alam S., Albareti F. D., Allende Prieto C. e. a., 2015, ApJS, 219, 12
- Allen et al. (1985) Allen R. J., Ekers R. D., Terlouw J. P., 1985, in di Gesu V., Scarsi L., Crane P., Friedman J. H., Levialdi S., eds, Data Analysis in Astronomy. p. 271
- Angiras et al. (2007) Angiras R. A., Jog C. J., Dwarakanath K. S., Verheijen M. A. W., 2007, MNRAS, 378, 276
- Ann et al. (2015) Ann H. B., Seo M., Ha D. K., 2015, ApJS, 217, 27
- Baillard et al. (2011) Baillard A., Bertin E., de Lapparent V., 2011, A&A, 532, A74
- Bell & de Jong (2001) Bell E. F., de Jong R. S., 2001, ApJ, 550, 212
- Bell et al. (2003) Bell E. F., McIntosh D. H., Katz N., Weinberg M. D., 2003, ApJS, 149, 289
- Berta et al. (2013) Berta S., Lutz D., Nordon R., Genzel R., 2013, A&A, 555, L8
- Blumenthal et al. (1984) Blumenthal G. R., Faber S. M., Primack J. R., Rees M. J., 1984, Natur, 311, 517
- Böker et al. (2011) Böker T., Schinnerer E., Lisenfeld U., 2011, A&A, 534, A12
- Boselli & Gavazzi (2009) Boselli A., Gavazzi G., 2009, A&A, 508, 201
- Bovy et al. (2012) Bovy J., Rix H.-W., Hogg D. W., 2012, ApJ, 751, 131
- Brun & Rademakers (1997) Brun R., Rademakers F., 1997. AIHENP’96 Workshop, Lausanne, pp 81–86
- Bruzual (2007) Bruzual A. G., 2007, in Vazdekis A., Peletier R., eds, IAU Symposium Vol. 241, Stellar Populations as Building Blocks of Galaxies. pp 125–132, doi:10.1017/S1743921307007624
- Bruzual & Charlot (2003) Bruzual G., Charlot S., 2003, MNRAS, 344, 1000
- Burkert (1995) Burkert A., 1995, ApJL, 447, L25
- Casertano (1983) Casertano S., 1983, MNRAS, 203, 735
- Charlot & Bruzual (1991) Charlot S., Bruzual A. G., 1991, ApJ, 367, 126
- Charlot et al. (1996) Charlot S., Worthey G., Bressan A., 1996, ApJ, 457, 625
- Ciotti & Bertin (1999) Ciotti L., Bertin G., 1999, A&A, 352, 447
- Cole et al. (2000) Cole S., Lacey C. G., Baugh C. M., Frenk C. S., 2000, MNRAS, 319, 168
- Conroy (2013) Conroy C., 2013, ARA&A, 51, 393
- Conroy & Gunn (2010) Conroy C., Gunn J. E., 2010, ApJ, 712, 833
- Conroy et al. (2009) Conroy C., Gunn J. E., White M., 2009, ApJ, 699, 486
- Courteau et al. (2014) Courteau S., Cappellari M., de Jong R. S., Dutton 2014, Reviews of Modern Physics, 86, 47
- Di Cintio et al. (2014) Di Cintio A., Brook C. B., Dutton A. A., Macciò A. V., Stinson G. S., Knebe A., 2014, MNRAS, 441, 2986
- Dutton & Macciò (2014) Dutton A. A., Macciò A. V., 2014, MNRAS, 441, 3359
- Einasto (1965) Einasto J., 1965, Trudy Astrofizicheskogo Instituta Alma-Ata, 5, 87
- Eldridge et al. (2008) Eldridge J. J., Izzard R. G., Tout C. A., 2008, MNRAS, 384, 1109
- Ferrers (1877) Ferrers N. M., 1877, QJPAM, 14, 1
- Flynn et al. (2006) Flynn C., Holmberg J., Portinari L., 2006, MNRAS, 372, 1149
- Frieman et al. (2008) Frieman J. A., Bassett B., Becker A., Choi C., 2008, AJ, 135, 338
- Fu et al. (2012) Fu J., Kauffmann G., Li C., Guo Q., 2012, MNRAS, 424, 2701
- Fukugita & Peebles (2004) Fukugita M., Peebles P. J. E., 2004, ApJ, 616, 643
- Giovanelli et al. (2005) Giovanelli R., Haynes M. P., Kent B. R., Perillat P., 2005, AJ, 130, 2613
- Governato et al. (2010) Governato F., Brook C., Mayer L., Brooks A., 2010, Natur, 463, 203
- Governato et al. (2012) Governato F., Zolotov A., Pontzen A., Christensen C., 2012, MNRAS, 422, 1231
- Hernández-Pérez & Bruzual (2013) Hernández-Pérez F., Bruzual G., 2013, MNRAS, 431, 2612
- Jog (2002) Jog C. J., 2002, A&A, 391, 471
- Kannappan & Gawiser (2007) Kannappan S. J., Gawiser E., 2007, ApJL, 657, L5
- Keres et al. (2003) Keres D., Yun M. S., Young J. S., 2003, ApJ, 582, 659
- Kurucz (2011) Kurucz R. L., 2011, Canadian Journal of Physics, 89, 417
- Lagos et al. (2014) Lagos C. D. P., Baugh C. M., Zwaan M. A., 2014, MNRAS, 440, 920
- Leroy et al. (2005) Leroy A., Bolatto A. D., Simon J. D., Blitz L., 2005, ApJ, 625, 763
- MacArthur et al. (2003) MacArthur L. A., Courteau S., Holtzman J. A., 2003, ApJ, 582, 689
- Macciò et al. (2015) Macciò A. V., Mainini R., Penzo C., Bonometto S. A., 2015, MNRAS, 453, 1371
- Maeder & Meynet (2012) Maeder A., Meynet G., 2012, Reviews of Modern Physics, 84, 25
- Magris C. et al. (2015) Magris C. G., Mateu P. J., Mateu C., Bruzual A. G., Cabrera-Ziri I., Mejía-Narváez A., 2015, PASP, 127, 16
- Makarov et al. (2014) Makarov D., Prugniel P., Terekhova N., 2014, A&A, 570, A13
- Maraston et al. (2006) Maraston C., Daddi E., Renzini A., Cimatti A., Dickinson M., Papovich C., Pasquali A., Pirzkal N., 2006, ApJ, 652, 85
- Marigo & Girardi (2007) Marigo P., Girardi L., 2007, A&A, 469, 239
- Martin et al. (2010) Martin A. M., Papastergis E., Giovanelli R., Haynes M. P., 2010, ApJ, 723, 1359
- Martínez-García et al. (2017) Martínez-García E. E., González-Lópezlira R. A., Magris C. G., Bruzual A G., 2017, ApJ, 835, 93
- McDonald et al. (2009) McDonald M., Courteau S., Tully R. B., 2009, MNRAS, 393, 628
- McGaugh (2012) McGaugh S. S., 2012, AJ, 143, 40
- Navarro et al. (1996) Navarro J. F., Frenk C. S., White S. D. M., 1996, ApJ, 462, 563
- Nipoti & Binney (2015) Nipoti C., Binney J., 2015, MNRAS, 446, 1820
- Noterdaeme et al. (2012) Noterdaeme P., Petitjean P., Carithers W. C., Pâris I., 2012, A&A, 547, L1
- Peng et al. (2002) Peng C. Y., Ho L. C., Impey C. D., Rix H.-W., 2002, AJ, 124, 266
- Peng et al. (2010) Peng C. Y., Ho L. C., Impey C. D., Rix H.-W., 2010, AJ, 139, 2097
- Planck Collaboration et al. (2014) Planck Collaboration Ade P. A. R., Aghanim N., 2014, A&A, 571, A16
- Popping et al. (2014) Popping G., Somerville R. S., Trager S. C., 2014, MNRAS, 442, 2398
- Read (2014) Read J. I., 2014, Journal of Physics G Nuclear Physics, 41, 063101
- Read & Trentham (2005) Read J. I., Trentham N., 2005, Philosophical Transactions of the Royal Society of London Series A, 363, 2693
- Repetto et al. (2013) Repetto P., Martínez-García E. E., Rosado M., Gabbasov R., 2013, ApJ, 765, 7 (RP13)
- Repetto et al. (2015) Repetto P., Martínez-García E. E., Rosado M., Gabbasov R., 2015, MNRAS, 451, 353 (RP15)
- Rix & Rieke (1993) Rix H.-W., Rieke M. J., 1993, ApJ, 418, 123
- Salim et al. (2007) Salim S., Rich R. M., Charlot S., Brinchmann J., 2007, ApJS, 173, 267
- Schwarzschild & Harm (1968) Schwarzschild M., Harm R., 1968, The Astronomical Journal Supplement, 73, 35
- Sersic (1968) Sersic J. L., 1968, Atlas de galaxias australes: Cordoba, Argentina: Observatorio Astronomico, 1968
- Sheth et al. (2010) Sheth K., Regan M., Hinz J. L. e. a., 2010, PASP, 122, 1397
- Skrutskie et al. (2006) Skrutskie M. F., Cutri R. M., Stiening R., 2006, AJ, 131, 1163
- Sorba & Sawicki (2015) Sorba R., Sawicki M., 2015, MNRAS, 452, 235
- Stadel et al. (2009) Stadel J., Potter D., Moore B., Diemand J., Madau P., Zemp M., Kuhlen M., Quilis V., 2009, MNRAS, 398, L21
- Stark et al. (1987) Stark A. A., Elmegreen B. G., Chance D., 1987, ApJ, 322, 64
- Swaters et al. (2002) Swaters R. A., van Albada T. S., van der Hulst J. M., Sancisi R., 2002, A&A, 390, 829
- Swaters et al. (2011) Swaters R. A., Sancisi R., van Albada T. S., van der Hulst J. M., 2011, ApJ, 729, 118
- Tully et al. (1996) Tully R. B., Verheijen M. A. W., Pierce M. J., 1996, AJ, 112, 2471
- Vassiliadis & Wood (1993) Vassiliadis E., Wood P. R., 1993, ApJ, 413, 641
- Vázquez et al. (2007) Vázquez G. A., Leitherer C., Schaerer D., 2007, ApJ, 663, 995
- Verheijen & Sancisi (2001) Verheijen M. A. W., Sancisi R., 2001, A&A, 370, 765
- Walcher et al. (2011) Walcher J., Groves B., Budavári T., Dale D., 2011, Ap&SS, 331, 1
- Watson et al. (2012) Watson L. C., Martini P., Lisenfeld U., Wong M.-H., Böker T., Schinnerer E., 2012, ApJ, 751, 123
- Wenger et al. (2000) Wenger M., Ochsenbein F., Egret D., Dubois P., 2000, A&AS, 143, 9
- Wolfinger et al. (2013) Wolfinger K., Kilborn V. A., Koribalski B. S., 2013, MNRAS, 428, 1790
- Young et al. (1995) Young J. S., Xie S., Tacconi L., Knezek P., 1995, ApJS, 98, 219
- Zhang et al. (2005) Zhang F., Han Z., Li L., Hurley J. R., 2005, MNRAS, 357, 1088
- Zibetti (2009) Zibetti S., 2009, preprint, (arXiv:0911.4956)
- Zibetti et al. (2009) Zibetti S., Charlot S., Rix H.-W., 2009, MNRAS, 400, 1181
- da Cunha et al. (2008) da Cunha E., Charlot S., Elbaz D., 2008, MNRAS, 388, 1595
- de Blok (2010) de Blok W. J. G., 2010, Advances in Astronomy, 2010, 789293
- van Eymeren et al. (2011a) van Eymeren J., Jütte E., Jog C. J., Stein Y., Dettmar R.-J., 2011a, A&A, 530, A29
- van Eymeren et al. (2011b) van Eymeren J., Jütte E., Jog C. J., Stein Y., Dettmar R.-J., 2011b, A&A, 530, A30
- van den Bosch & Swaters (2001) van den Bosch F. C., Swaters R. A., 2001, MNRAS, 325, 1017
- van der Hulst et al. (1992) van der Hulst J. M., Terlouw J. P., Begeman K. G., Zwitser W., Roelfsema P. R., 1992, in Worrall D. M., Biemesderfer C., Barnes J., eds, Astronomical Society of the Pacific Conference Series Vol. 25, Astronomical Data Analysis Software and Systems I. p. 131