Foraging patterns in online searches
Abstract
Nowadays online searches are undeniably the most common form of information gathering, as witnessed by billions of clicks generated each day on search engines. In this work we describe online searches as foraging processes that take place on the semi-infinite line. Using a variety of quantities like probability distributions and complementary cumulative distribution functions of step-length and waiting time as well as mean square displacements and entropies, we analyze three different click-through logs that contain the detailed information of millions of queries submitted to search engines. Notable differences between the different logs reveal an increased efficiency of the search engines. In the language of foraging, the newer logs indicate that online searches overwhelmingly yield local searches (i.e. on one page of links provided by the search engines), whereas for the older logs the foraging processes are a combination of local searches and relocation phases that are power law distributed. Our investigation of click logs of search engines therefore highlights the presence of intermittent search processes (where phases of local explorations are separated by power law distributed relocation jumps) in online searches. It follows that good search engines enable the users to find the information they are looking for through a local exploration of a single page with search results, whereas for poor search engines users are often forced to do a broader exploration of different pages.
pacs:
05.40.Fb,89.20.Hh,89.75.-kI Introduction
An increasingly large part of our day is devoted to online activities. It is therefore not surprising that in recent years online mobility patterns have emerged as a new interdisciplinary research area. Much attention has been given to scaling and non-Markovian features of web browsing Huberman1998 ; Fagin2001 ; Chmiel2009 ; Chierichetti2012 ; Zhao2014 ; Zhao2015 , to the features of mobility in online games Szell2012 ; Sinatra2014 as well as to emerging scaling properties in e-commerce Zhao2013 .
Each day, tens of billions of clicks are generated on search engines. Understanding human online search click-through behavior can therefore be of central importance to improve ranking algorithms, rearrange page layout for search engines, and reduce advertisement spending for enterprises. Click-through data, which are extracted from the click logs of search engines, contain information on the links clicked by a user as a result of a query submitted to a search engine. These data have been exploited in a variety of studies that aimed at optimizing web searches and at improving retrieval quality Joachims2002 ; Xue2004 ; Craswell2007 ; Radlinski2008 .
Our daily experience with web searches shows that a fully deterministic search strategy usually does not optimize the search outcome. Instead, there is often some degree of randomness involved in choosing the links to click on among those provided by a search engine. It is therefore tempting to investigate web searches from the point of view of random search strategies.
Studies of search strategies Viswanathan2011 in animal foraging Edwards2007 ; Sims2008 ; Humphries2010 ; deJaeger2011 ; Humphries2012 ; Schultheiss2015 hint at intriguing connections between movement patterns and availability of preys. Roughly speaking, one can distinguish between two different cases. If the prey is abundant, then the predator tends to perform a random walk and only explores a rather restricted territory. On the other hand, if the prey is scarce, evidence has been found that the pattern changes to a Lévy walk (or, alternatively, to an intermittent search process that includes Lévy movements Lon08 ; Ben11 ) that allows to cover much larger areas/volumes and to optimize the search efficiency when resources are sparsely distributed. It has been claimed that Lévy movement patterns also show up in human foraging Brown2007 ; Raichlen2014 as well as in the migration of bacteria Korobkova2004 ; Ariel2015 and T cells Harris2012 . Of course, the simple relationship between displacement pattern and availability of preys only prevails on large scales, and a much more complex and subtle picture emerges when going beyond such a coarse-grained description Edwards2011 ; Kolzsch2012 ; Pyke2015 ; Reynolds2015 .
Analyzing extensive click-through data sets from different search engines collected in different years, we consider in this paper online searches as foraging processes on a straight semi-infinite line and find a transition in the search patterns from a behavior that includes long-range relocations to a purely local Brownian-type motion with increasing efficiency of the search engines. A more detailed analysis reveals a behavior that is more complex than simple Lévy flights or Brownian motions.
In the next Section we describe the click-through data as trajectories on a semi-infinite line. Section III analyzes these data as foraging processes on the semi-infinite line through the study of numerous quantities, ranging from probability distributions and complementary cumulative distribution functions of displacement and waiting time to mean square displacements and entropies. Our analysis indicates that the character of online searches changes with increasing efficiency of search engines, shifting from processes that include power law distributions to a Brownian-type behavior.
II Click-through data sets
Our study of human online search patterns is based on three click-through data sets collected by different commercial search engine providers. The sets Sogou-08 and Sogou-11 were collected on the Chinese search engine Sogou in 2008 and 2011 respectively, whereas the set Yahoo-10 was collected on Yahoo in 2010. For a detailed description of the data sets and of the data preparation we refer the reader to Appendix A.

As explained in Appendix A and illustrated in Fig. 1, for each query submitted to one of the search engines we assign to every click on a search result a pair of “space”-“time” coordinates where the “time” is the time in seconds passed since the first click (i.e. for the first click, ), whereas the “space” coordinate is the rank of the search result, i.e. its position when treating all search results as points on a semi-infinite line, where the top result is assigned the rank . The th click is therefore characterized by the pair . Subsequent clicks for a given search then correspond to subsequent steps along the semi-infinite line where the rank difference is the step-length . The sign of provides us with the direction of the steps. As we will see later, the data show a strong bias in the forward direction. In a similar way we define as waiting time the time interval between two successive clicks footnote1 : .
Usually a query ends when the user finds the relevant information. In the language of foraging the relevant information is therefore the resource. We know from our own experience that users occasionally terminate a search early once they are convinced that the search term is unlikely to yield the expected result. The limitations of the data bases used in this study do not allow to identify these instances. We therefore do not try to distinguish between these cases and treat all queries in the same way, with the resource being located at the site that corresponds to the rank of the last search result clicked by the user. Of interest is also the number of clicks (steps) needed to reach the resource. As we discuss below, the resource location and the clicking number provide simple ways of evaluating the efficiency of a search engine. Both and would presumably change slightly if we would be able to identify those searches that resulted in the user finding the information they were looking for.
In the following we focus on probability distributions and on complementary cumulative distribution functions (CCDF(x) is the probability that the random variable has a value larger than ) in order to analyze the motion patterns emerging from online searches. We take a population level approach and base our analysis on population-averaged distributions. As we are dealing with millions of queries for every search engine, see Table I, we expect that distribution functions provide a very reliable characterization of the foraging patterns in online searches.
III Model selection and parameter estimation
In the following we are modeling the distributions of various quantities in the large-value limit through a variety of models and select the best model using the Akaike information criterion (AIC). As the quantities derived from the click-through data sets take on positive integers only, we are considering only discrete versions of the models.
As a power-law model we use the discrete power-law (DPL) distribution
| (1) |
where the normalizing factor is the incomplete -function Newman2005 . For the exponential model we use the “shifted” geometric (SG) distribution
| (2) | |||||
| (3) |
where .
We also included in the model selection the power law with exponential cut-off (PEC) model:
| (4) |
where is the polylogarithm function, the discrete log-normal model (DLN) Chakraborty2015 :
| (5) |
where is the standard normal cumulative distribution function, the Yule-Simon (YS) distribution Simon1955 ; Clauset2009
| (6) |
which for sufficiently large yields , and the conditional Poisson (CP) distribution Clauset2009
| (7) |
Finally, we also considered a pairwise power law (PPL) distribution, which consists of two power law regions that are connected at :
| (8) |
with the normalization factor . Due to the ceiling function this distribution does not strictly sum up to . Still, as we will see in the following, it does provide in many instances a good fit to our data.
Inspection of these distributions reveal the presence of a minimal value that determines the start of the ‘tail’ used for the modeling. In many cases can be determined as the value that minimizes the Kolmogorov-Smirnov statistics between the empirical distributions and the fitted distributions Clauset2009 .
Due to the large size of our data we directly use the formula for the Akaike information criterion. Here is number of parameters in each distribution model and is the maximum likelihood of the model (see Appendix B). The Akaike weight Burnham2002 for each model is
| (9) |
with the model with the largest Akaike weight being the most likely model.
Although we show in the following plots of the probability distribution functions (with logarithmic binning) and of the complementary cumulative distribution functions as illustration, we do not use them directly for parameter estimation. Instead we estimate parameters from the distribution models with the maximum likelihood method. The maximum likelihood estimators (MLE) for the different parameters are summarized in Appendix B.
IV Results
IV.1 Search engine efficiency
Before delving into a detailed analysis of foraging related quantities like step-lengths and waiting times, we will first briefly characterize in a straightforward way the efficiency of the different search engines (or of the same search engine in different years) through the clicking number, i.e. the number of clicks needed before the user ends the query.
| Sogou-08 | Sogou-11 | Yahoo-10 | |
|---|---|---|---|
| year | |||
| search engine provider | Sogou | Sogou | Yahoo |
| number of valid queries (in millions) | |||
From the point of view of a user submitting a query to a search engine, what matters is the number of links they have to click on before retrieving the needed information. The clicking number should therefore directly reflect the efficiency of a search engine to provide the user with the relevant information.
Table I summarizes some of our findings for the clicking number. Inspection of the table reveals immediately striking differences when comparing Sogou-08 with the other, newer, sets. Both the average clicking number and the largest clicking number found in the millions of queries forming the different sets point to an impressive increase of the efficiency when going from Sogou-08 to the newer sets. The most striking difference is provided by the probability that more than 10 clicks are needed for accessing the relevant information. Whereas for Sogou-08 around 0.63% of the queries result in more than 10 clicks on links provided by the search engine, only a very small number of searches in Sogou-11 and Yahoo-10 result in the inspection of more than 10 links.

| Set | model | AIC | most likely model | MLE | ||||
| Sogou-08 | YS | PPL | 7 | |||||
| DPL | ||||||||
| SG | ||||||||
| CP | ||||||||
| DLN | ||||||||
| PEC | ||||||||
| PPL | ||||||||
| Sogou-11 | YS | SG | ||||||
| DPL | ||||||||
| SG | ||||||||
| CP | ||||||||
| Yahoo-10 | YS | SG | ||||||
| DPL | ||||||||
| SG | ||||||||
| CP | ||||||||
| Sogou-08 | YS | PPL | 16 | |||||
| DPL | ||||||||
| SG | ||||||||
| CP | ||||||||
| DPL | ||||||||
| PEC | ||||||||
| PPL |
| Set | model | AIC | most likely model | MLE | ||||
| Sogou-08 | YS | PPL | 10 | |||||
| DPL | ||||||||
| SG | ||||||||
| CP | ||||||||
| DLN | ||||||||
| PEC | ||||||||
| PPL | ||||||||
| Sogou-11 | YS | SG | ||||||
| DPL | ||||||||
| SG | ||||||||
| CP | ||||||||
| Yahoo-10 | YS | SG | ||||||
| DPL | ||||||||
| SG | ||||||||
| CP | ||||||||
| Sogou-08 | YS | SG | ||||||
| DPL | ||||||||
| SG | ||||||||
| CP | ||||||||
| Sogou-08 | YS | PPL | 1 | |||||
| DPL | ||||||||
| SG | ||||||||
| CP | ||||||||
| DLN | ||||||||
| PEC | ||||||||
| PPL |
The distribution CCDF() shown in Fig. 2 reveals the dramatic differences between the efficiency (as measured by ) of the different search engines. As reported in Table II, we find using AIC that the probability distribution for Sogou-08 follows a pairwise power law distribution with the maximum likelihood estimations , whereas the transition happens at . For Sogou-11 and Yahoo-10, however, the distributions rapidly show an exponential decay. This exponential decay stops at for Sogou-11, indicating that with a very few exceptions all queries are finished within 10 clicks. This discontinuity does not happen in Yahoo-10 which instead shows a smooth behavior. The jump in Sogou-11 reveals that with a few exceptions users found within the links provided on the very first page with results the information they were looking for.

One also expects from an efficient search engine that the relevant result is included in the very first suggested links. Fig. 3 compares for our three data sets the probability distribution where is the rank of the final click (i.e. the position of the resource on the semi-infinite line). We first note that for Yahoo-10 75% of the searches end with a click on the very first link on the search result page provided by the search engine. For Sogou-11 this number is 47%, very similar to the 45% of searches that end with a click on the very first link for Sogou-08. For Sogou-11 and Yahoo-10 almost all resources (99.997% for Sogou-11 and 99.864% for Yahoo-10) are located on the first page with . For these two cases one also observes large changes between and , illustrating the fact that only for a negligible number of searches the resource is found for . This is different for Sogou-08 where and , resulting in a much smoother shape with a pairwise power-law tail. The probability distribution indicates that for Sogou-11 and Yahoo-10 only a local exploration on the first page is needed in order to reach the resource. As we will see in the following, this difference yields different space-time patterns during the searches.
IV.2 Step-lengths and waiting times

In the following analysis we view as a random walk on the semi-infinite line the exploration by the user of the links provided by the search engine. Focusing on the step-length and waiting time distributions, we will see that the difference in efficiency noticed in the previous subsection yields different space-time processes.
A way to distinguish between Brownian-type motion and Lévy movement is to investigate the probability distribution of the step-length , which should display a heavy tail in the form of a power-law
| (10) |
with for super-diffusive Lévy flights.
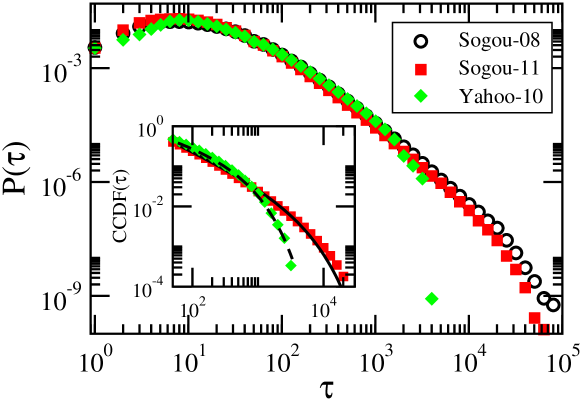
Fig. 4 shows the probability distributions for the step-length derived from the data at our disposal. Focusing first on Sogou-08, our model selection procedure shows that the pairwise power law model provides a good absolute fit, see Fig. 4a as well as Fig. 5b. From the maximum likelihood estimation we obtain that the transition between the two power laws happens at . The exponent in the first power-law region is given by , a value that is within the Lévy-flight range , i.e. between we have a long-range search pattern that is consistent with the power law distribution of a Lévy flight. This behavior does not persists for the largest values of . Instead, the exponent in the second power-law region is , which is outside the Lévy-flight range. This value guarantees a finite variance for step-lengths and suggests that the very long-range movements have the properties of normal diffusion. We believe that this change in behavior around is due to the layout of the search engine result pages, since the search engines used in our study list pages at the bottom of a result page. For Sogou-11 and Yahoo-10, 99.997% and 99.890% of steps have a length . The distributions for are exponential which points to the overwhelming predominance of local searches where only a small “area” is explored.

Interestingly, even for Sogou-08 an exponential decay is hidden in the distribution shown in Fig. 4a. Separating the jumps within a page from those between pages, we discover in Fig. 5 a more complex behavior. Restricting ourselves to jumps within a given page, where we denote by the corresponding step-length, we find for Sogou-08 an exponential decay of the step-length distribution. The difference between Sogou-08 and the other sets therefore mainly results from searches where the resource is not readily found, yielding jumps between different pages with a pairwise power-law probability distribution for the out-of-page step-length . As shown in Fig. 5b, the page difference of out-of-page jumps still yields a pairwise power law distribution.
The fact that Sogou-08 yields a switch between a local (i.e. on one page with search results) Brownian search and a relocation phase that is power law distributed is very reminiscent of an intermittent search process that includes Lévy strategies Lon08 ; Ben11 . Intermittent search processes have been proposed as search strategies in cases where the targets are hidden Ben05 ; Ben06 ; Osh09 . They are characterized by switches between two different phases: careful searches around one location, followed by rapid relocations to some other areas. The careful searches are usually described as Brownian searches whereas the relocations are often assumed to be either ballistic or Lévy distributed. The set-up of search engines queries has many obvious direct connections with an intermittent search process. This is especially true for Sogou-08 for which we observe relocations over large distances.
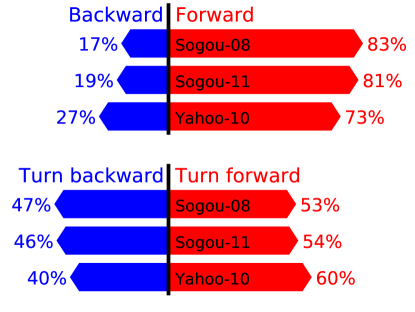
For any of the processes usually discussed in the context of foraging, one generally assumes the movement to be unbiased, i.e. that jumps are happening with a direction independent probability distribution. As we know from our own experience and as shown in Fig. 6 for the different data sets, this is not the case in online searches, where users have a tendency to start at the top of a page with research results and proceed to the bottom of the page (i.e. to move preferentially in one direction, see top of Fig. 6). While there is a clear directionality in how a user exploits search results, a much smaller bias is observed in the ’turning angles’, i.e. in the changes of direction from forward to backward and from backward to forward.
On the semi-infinite line, which provides the landscape for online foraging, moving forward usually means exploring new results, while moving backwards often means revisiting previously viewed results. The bias of foraging means that there is much more exploration of new results than revisitation of already viewed ones. Meanwhile, since most of the initial movements are forward when users start to view results from a search, the much weaker bias in turning angles indicates that a revisitation is usually followed by another exploration.
Other differences between online searches and models for foraging emerge when considering the probability distribution of the waiting time , i.e. the time elapsed between two consecutive clicks on links provided by the search engine. The time between two clicks on the links provided by the search engine is mainly the time spent by the user viewing a web site. The average time spent on selecting the next link on the search result pages is indeed small compared to the average time spent on a selected web site. Inspection of Fig. 7 reveals that is well modeled by a power law distribution with exponential cut-off, see inset. This is especially true for Yahoo-10 where our model selection indeed finds that a power law distribution with exponential cut-off provides the best fit. For Sogou-08 and Sogou-11 AIC yields the log-normal distribution as the most probable one, but the log-normal distribution does not at all capture the behavior for large , which instead is well described by a power law distribution with exponential cut-off, see the black lines in the inset of Fig. 7. This exponential cut-off in is due to upper limits for the waiting time set by the session expiration time (one hour for Yahoo-10 and one day for Sogou-08 and Sogou-11).
IV.3 Mean square displacement
For Brownian motion and Lévy flights the mean square displacement shows a characteristic behavior, increasing linearly with the number of jumps for the first case, whereas for the second case a super-diffusive behavior is expected, with a power-law increase where the exponent is larger than one.
Regarding a query again as a motion along the semi-infinite line where the rank of a click corresponds to the position whereas the clicking order counts the number of jumps and therefore serves as a proxy for “time”, we can calculate the mean square displacement as
| (11) |
where is the rank of the first clicked result. In (11) the average is over the different trajectories along the semi-infinite line.
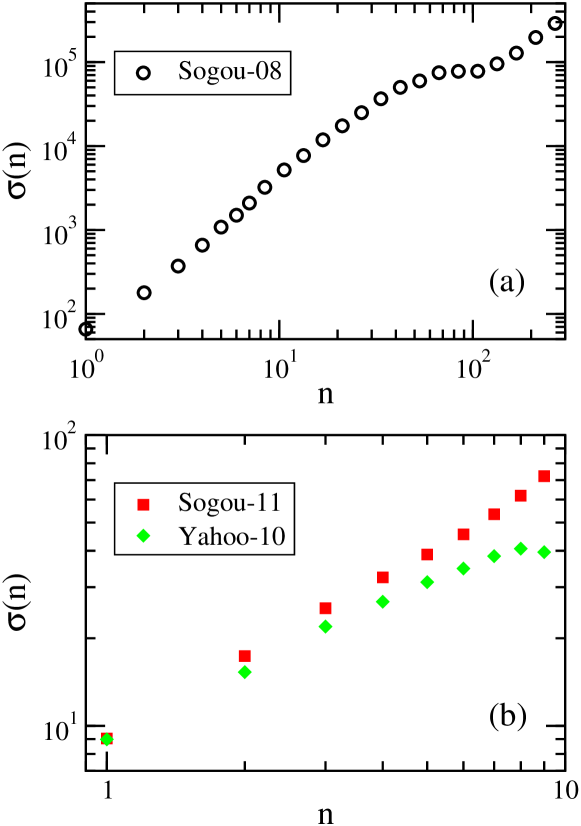
Fig. 8 shows for the different sets the variation of the mean square displacement with increasing clicking order . For Sogou-08, see Fig. 8a, we do find for the expected super-diffusive behavior, , with an exponent . For Sogou-11 and Yahoo-10 reliable data are only available for small values of due to the fact that the resource is usually found after only a few clicks. For we find for Sogou-11 an exponent , whereas for Yahoo-10 the value of the exponent is . These values, which indicate a slight sub-diffusive behavior, are rather close to the value of normal diffusion.

As we know from the click-through logs the time elapsed between any two consecutive clicks, we can also calculate the mean square displacement as a function of the real time measured since the very first click:
| (12) |
where is the rank of the first click at time . We know from Fig. 7 that for all three sets the distributions of waiting times, which are composed by the times spent on selecting the next link on the search result pages and the times spent viewing the previously selected website, are rather complicated. This will of course impact the time dependence of . Our result for Sogou-08 shown in Fig. 9a indicates that for that case the time-dependent mean square displacement varies in the time interval 100 2000 like a power law with an exponent close to 1.30. For Sogou-11 and Yahoo-10, however, roughly varies logarithmically with time in the interval 10 500 , see Fig. 9b.
IV.4 Entropy


The differences between the different sets can also be highlighted through the study of time-dependent entropies. We can for example start from the conditional probability , which is the probability that the step-length is given that the jump takes place at time . Here is the joint probability of the time elapsed since the first click and the step-length , whereas is the probability that the event happens at time . This allows us to define the time-dependent entropy
| (13) |
We could also start from a different conditional probability distribution, e.g. where is the clicking order,
| (14) |
Fig. 10 compares the joint probabilities for the different sets. We note again that for Sogou-11 and Yahoo-10 almost all displacements are local with , which is reflected by the very low or even vanishing joint probability for for these cases. We also note that for the probabilities are very similar for the different sets, which indicates that the properties of local searches are rather set independent. The probability for Sogou-08 reveals the emergence and distribution of long-range relocations. Finally, for all cases changes as a function of time, as expected for a search process that is taking place far from equilibrium.

The time dependence of the entropy defined in Eq. (13) is shown in Fig. 11a. We first note that for all three sets the entropy shows a strong increase at early times. For Sogou-11 and Yahoo-10, characterized by mostly local searches on the first page with links, this increase rapidly weakens and reaches a plateau for times seconds. For Sogou-08, where the motion is formed by a combination of local searches and long relocation jumps, the entropy keeps increasing up to seconds before reaching a plateau. is therefore another quantity that allows to easily distinguish between Brownian-like searches and searches that are characterized by power law distributions.
Fig. 11b shows the entropy defined in Eq. (14). For Sogou-08, , after an initial increase for small , rapidly reaches a plateau for . The process is therefore stationary for . In contrast to this, for Sogou-11 and Yahoo-10 the entropy does not reach a well defined plateau, and the processes therefore do not reach a stationary state.
IV.5 Correlations
Correlation coefficients allow us to gain additional insights into the relationships between different quantities (see Appendix C for the definitions of the correlation coefficients discussed in the following). This is of interest as Brownian motions and Lévy flights, which are commonly used to model human dynamics, assume that space and time are uncorrelated and that the random walks are memoryless. Studying correlation coefficients will allow us to see to what extend these assumptions are fulfilled in human online search processes.
Well suited correlation coefficients for our purpose are Kendall’s tau Ken90 , , and Spearman’s rho Tay87 , , as these two non-parametric measures are distribution-free and can handle power-law distributed quantities. Both coefficients are rank-based and measure the correspondence of two series of ordinal numbers. Series for waiting times and displacements are of course readily obtained from the original search engine click-through logs.
| Sogou-08 | Sogou-11 | Yahoo-10 | |
|---|---|---|---|
Table IV shows our results for the correlations between step-length and waiting time . Both Kendall’s tau and Spearman’s rho provide correlation coefficients close to or larger than 0.10, indicating a weak positive correlation between step-length and waiting time. We also note that the correlations for Sogou-08 are larger than for Sogou-11 and Yahoo-10, illustrating again that different mechanisms underlie the different click-through logs. The positive correlation indicates that the assumption of independence between spatial and temporal activities, valid for both Brownian motion and Lévy flights, does not hold in a strict sense for human online search processes.
| correlation | Sogou-08 | |
|---|---|---|
| 1 | ||
| 2 | ||
| 3 | ||
| 4 | ||
| 5 | ||
| 6 | ||
| 7 | ||
| 8 | ||
| 9 | ||
| 10 | ||
| 20 | ||
| 30 | ||
| 40 | ||
| 50 | ||
We can also check whether a process is memory-less or not. In order to do so we define for every step-length series sets with and calculate the correlation coefficient and . For a completely memory-less process these two coefficients should be zero. As we have previously seen that exhibits a plateau, characteristic of a stationary process, only for Sogou-08 and , we performed this analysis only for Sogou-08 and series with . The results shown in Table V and Fig. 12 reveal positive correlations even for large values of . Long-term memory effects therefore permeate online human searches.

V Discussion and conclusion
Online activities are an integral part of our daily lives. In many cases these activities involve search queries submitted to one of the search engines. In this paper we propose to view the exploration of the results (i.e. links) provided by the search engine as a foraging process on a semi-infinite line where the rank of a link corresponds to a coordinate on that line. Using a variety of space- and time-dependent quantities we investigate three different publicly available click-through logs.
Our study reveals a sharp contrast between the oldest log and the two logs obtained more recently. For the two newer sets almost all queries can be understood as local searches restricted to a single page. These local searches have many characteristics of a Brownian random walk, as for example an exponential decay of the step-length distribution or a mean-square displacement that increases almost linearly with the clicking order. However, there are also marked differences, as a power-law behavior of the waiting time distribution or the directionality of the jumps along the semi-infinite line. A very interesting behavior emerges for the oldest data set, where both local searches as well as long-range power-law distributed jumps are found. This behavior is reminiscent of intermittent processes with Lévy strategies that have been proposed to describe searches with hidden targets. Interestingly, the waiting time distributions, i.e. the distributions of the times elapsed between successive clicks, are very similar for all three click-through logs and reveal a power-law behavior with an exponential cut-off as that encountered in other areas of human activities.
The different properties of the different data sets point to the evolution of the search engines over the years. Until recently search engines were of limited efficiency and as a result a sizeable number of queries ended up with the user jumping from one page with links to another. These searches are therefore best characterized as a combination of local explorations and power law distributed relocations. The more recent logs reveal an increased efficiency of the search engines where the overwhelming part of the queries yield only local searches on the first page of results. These local searches have some characteristics of Brownian motion.
The online search behavior clearly changes as a function of the efficiency of a search engine. Whereas efficient search engines result in an overwhelmingly large number of local searches, earlier engines prompted searches where local explorations and long-range, power law distributed, relocations processes are combined. This scenario shows many common features with those of intermittent search processes which have been proposed as search strategies for finding hidden resources.
The description of online searches as foraging processes yields some interesting insights, but our results also reveal notable deviations from the simple models used to describe foraging processes. It remains a challenge to come up with a more realistic foraging model that is capable of reproducing the results we obtain from our analysis of the different click-through logs.
Acknowledgements.
This work is supported in part by the US National Science Foundation through grant DMR-1205309.Appendix A Data description and preparation
For our study we analyzed three different click-through data sets. In the following we briefly describe these sets as well as how we prepared the data and used them in our study.
Sogou-08 and Sogou-11 refer to the data sets Search Engine Click-through Log Version 2008
and Search Engine Click-through Log Version 2011 Sogou which are parts of the
“Sogou Lab Data.” These two data sets provide millions of users’ search queries and
click-through activities on Sogou (www.sogou.com), which is one of the largest Chinese
search engines. Sogou-08 has been collected in June 2008, whereas Sogou-11 contains queries
submitted from 12/30/2011 to 01/01/2012. For Sogou-08 respectively Sogou-11 we get
respectively lines of record, each corresponding to an individual click
and consisting of the following components Sogou :
| Time of click | User ID | User query | Ranking of clicked result | Order of click | URL of clicked result |
where “click” refers to the event of the user clicking on a link on the search engine result pages, whereas “time” is the calendar time of the click event.
Yahoo (YahooL18 Yahoo ) is the data set Annonymized Yahoo! Search Logs with Relevance Judgments version 1.0 provided by Yahoo! Labs yahoolabs as part of the Yahoo! Webscope program webscope (“Approval for Access” granted October 7, 2013). It provides users’ search click-through logs on Yahoo Search (search.yahoo.com) collected in July 2010. Yahoo-10 contains lines, where each line corresponds to an individual search and contains the following information (separated by “\t”) Yahoo :
| Query | Cookie | Timestamp | List of URLs | Number of “clicks” | List of time and click position/type pairs |
where the “List of URLs” is the list of weblinks on the first result page. “Click” refers to any type of click on the result pages, including clicking on a search result, clicking at the top of a result page (unspecified; this can include clicking on the “also-try” button, on a spell correction suggestion, on an advertisement located at the top of the page, etc.), clicking at the bottom of a result page (unspecified, this can include clicking on next page button, on the bottom “also-try” button, on an advertisement located at the bottom of the page, etc.). For the “time and click position/type pairs”, the “time” is the time (in seconds) since the beginning of the search. Since we do not know the specific activities done when clicking at the top or the bottom of a result page, we ignore the clicks at the top of result pages but assume that a click at the bottom of a result page is on the next page button.
From all these sets we removed entries with missing values for the first click as well as (for Sogou-08) unusual cases where a click was on a link of rank 1000 or above. For entries with successive clicks on the same link, we only kept the first click and jumped to the next click on a different link. The total number of queries retained after this procedure are listed in Table I.
After this data cleaning all clicks belonging to the same search were grouped together and the corresponding (time, rank) pairs were calculated based on the order of the clicks. Time is the time passed in seconds since the click on the first result. In this way we end up for each search with a series of (time, rank) pairs
with . These series were then used as the starting point for our study.
Appendix B Maximum likelihood estimators
Let us consider first the discrete power-law distribution
| (15) |
For a given data set , we have the likelihood
| (16) |
where is the number of data points. The log-likelihood is then given by
| (17) |
and the maximum likelihood estimator (MLE) for is obtained numerically from Bauke2007
| (18) |
We used the L-BFGS-B method for parameter optimization, see for example Ref. Zhu1997 .
For the “shifted” geometric distribution
| (19) |
the likelihood is given by
| (20) |
where is again the size of the data. The maximum likelihood estimator for is
| (21) |
where is the mean of ’s. Finally, for the exponential form
| (22) |
we obtain
| (23) |
when , since and MLE is invariant to this transformation.
The MLE for parameters in the other distributions are obtained in similar ways. For the Yule-Simon distribution the MLE for the shape parameter is
| (24) |
whereas for the conditional Poisson distribution the MLE for is
| (25) |
where is the cumulative distribution function of a Poisson distribution with rate parameter .
Finally for the distributions with more than one parameter, one has:
power-law with exponential cut-off
| (26) |
discrete log-normal
| (27) |
pairwise power law
| (28) |
Appendix C Correlation coefficients
C.1 Kendall’s tau
Kendall’s tau provides a measure of rank correlation. Assuming a set of observations , , of two joint random variables and (step-length and waiting time, for example), Kendall’s tau compares the number of concordant pairs with the number of discordant pairs:
| (29) |
Two pairs and are concordant if (1) and or (2) and . If, however, and or and , then they are discordant. In the case of data with tied ranks (which is the case for our series), Kendall’s tau can be calculated as
| (30) |
where is the signum function, whereas and are the numbers of -tied pairs and -tied pairs.
C.2 Spearman’s rho
Spearman’s rho is Pearson’s correlation coefficient between ranked variables. Denoting by the rank of and by the rank of , then Spearman’s rho can be expresses as:
| (31) |
where and . While Spearman’s rho and Kendall’s tau usually yield different numbers, they work the same way.
References
- (1) B. A. Huberman, P. L. T. Pirolli, J. E. Pitkow, and R. M. Lukose, Science 280, 95 (1998).
- (2) R. Fagin, A. R. Karlin, J. Kleinberg, P. Raghavan, S. Rajagopalan, R. Rubinfeld, M. Sudan, and A. Tomkins, Ann. Appl. Probab. 11, 810 (2001).
- (3) A. Chmiel, K. Kowalska, and J. A. Holyst, Phys. Rev. E 80, 066122 (2009).
- (4) F. Chierichetti, R. Kumar, P. Raghavan, and T. Sarlós, in WWW 2012 - Proceedings of the 21st International Conference on World Wide Web, 609 (2012).
- (5) Z.-D. Zhao, Z.-G. Huang, L. Huang, H. Liu, and Y.-C. Lai, Phys. Rev. E 90, 050802(R) (2014).
- (6) Z.-D. Zhao, S.-M. Cai, and Y. Liu, Chaos 25, 063106 (2015).
- (7) M. Szell, R. Sinatra, G. Petri, S. Thurner, and V. Latora, Sci. Rep. 2, 457 (2012).
- (8) R. Sinatra and M. Szell, Entropy 16, 543 (2014).
- (9) Z.-D. Zhao, Z. Yang, Z. Zhang, T. Zhou, Z.-G. Huang, and Y.-C. Lai, Sci. Rep. 3, 3472 (2013).
- (10) T. Joachims, in Proceedings of the Eigth ACM SIGKDD International Conference on Knowledge Discovery and Data Mining, 133 (2002).
- (11) G. R. Xue, H.-J. Zeng, Z. Chen, Y. Yu, W.-Y. Ma, W. S. Xi, and W. G. Fan, in Proceedings of the Thirteenth ACM International Conference on Information and Knowledge Management, 118 (2004).
- (12) N. Craswell and M. Szummer, in SIGIR ’07 - Proceedings of the 30th Annual International ACM SIGIR Conference on Research and Development in Information Retrieval, 239 (2007).
- (13) F. Radlinski, M. Kurup, and T. Joachims, in Proceedings of the 17th ACM Conference on Information and Knowledge Management, 43 (2008).
- (14) G. M. Viswanathan, M. G. E. da Luz, E. P. Raposo, and H. E. Stanley, The Physics of Foraging: An Introduction to Random Searches and Biological Encounters (Cambridge University Press, Cambridge, UK, 2011).
- (15) A. M. Edwards, R. A. Phillips, N. W. Watkins, M. P. Freeman, E. J. Murphy, V. Afanasyev, S. V. Buldyrev, M. G. E. da Luz, E. P. Raposo, H. E. Stanley, and G. M. Viswanathan, Nature 449, 1055 (2007).
- (16) D. W. Sims, E. J. Southall, N. E. Humphries, G. C. Hays, C. J. A. Bradshaw, J. W. Pitchford, A. James, M. Z. Ahmed, A. S. Brierley, M. A. Hindell, D. Morritt, M. K. Musyl, D. Righton, E. L. C. Shepard, V. J. Wearmouth, R. P. Wilson, M. J. Witt, and J. D. Metcalfe, Nature 451, 1098 (2008).
- (17) N. E. Humphries, N. Queiroz, J. R. M. Dyer, N. G. Pade, M. K. Musyl, K. M. Schaefer, D. W. Fuller, J. M. Brunnschweiler, T. K. Doyle, J. D. R. Houghton, G. C. Hays, C. S. Jones, L. R. Noble, V. J. Wearmouth, E. J. Southall, and D. W. Sims, Nature 465, 1066 (2010).
- (18) M. de Jaeger, F. J. Weissing, P. M. J. Herman, B. A. Nolet, and J. van de Koppel, Science 332, 1551 (2011).
- (19) N. E. Humphries, H. Weimerskirch, N. Queiroz, E. J. Southall, and D. W. Sims, Proc. Natl. Acad. Sci. 109, 7169 (2012).
- (20) P. Schultheiss, K. Cheng, and A. M. Reynolds, Learn. Motiv. 50, 59 (2015).
- (21) M. A. Lonholt, T. Koren, R. Metzler, and J. Klafter, Proc. Natl. Acad. Sci. 105, 11055 (2008).
- (22) O. Bénichou, C. Loverdo, M. Moreau, and R. Voituriez, Rev. Mod. Phys. 83, 81 (2011).
- (23) C. T. Brown, L. S. Liebovitch, and R. Glendon, Hum. Ecol. 35, 129 (2007).
- (24) D. A. Raichlen, B. M. Wood, A. D. Gordon, A. Z. P. Mabulla, F. W. Marlowe, and H. Pontzer, Proc. Natl. Acad. Sci. 111, 728 (2014).
- (25) E. Korobkova, T. Emonet, J. M. G. Vilar, T. S. Shimizy, and P. Cluzel, Nature 428, 574 (2004).
- (26) G. Ariel, A. Roboni, S. Benisty, J. D. Partridge, R. M. Harshey, and A. Be’er, Nature Commun. 6, 8396 (2015).
- (27) T. H. Harris, E. J. Banigan, D. A. Christian, C. Konradt, E. D. Tait Wojno, K. Norose, E. H. Wilson, B. John, W. Weninger, A. D. Luster, A. J. Liu, and C. A. Hunter, Nature 486, 545 (2012).
- (28) E. M. Edwards, Ecology 92, 1247 (2011).
- (29) A. Kölzsch, A. Alzate, F. Bartumeus, M. de Jager, E. J. Weerman, G. M. Hengeveld, M. Naguib, B. A. Nolet, and J. van de Koppel, Proc. Roy. Soc. B 282, 20150424 (2015).
- (30) G. H. Pyke, Methods Ecol. Evol. 6, 1 (2015).
- (31) A. Reynolds, Phys. Life Rev. 14, 59 (2015).
- (32) The waiting time consists of two parts: the time for viewing the previously clicked result and the time needed to select the next link on the search result pages. Our data do not allow us to distinguish between these two contributions.
- (33) M. Newman, Contemp. Phys. 46, 323 (2005).
- (34) S. Chakraborty, J. Stat. Distrib. Appl. 2, 6 (2015).
- (35) H. A. Simon, Biometrika 42, 425 (1955).
- (36) A. Clauset, C. Shalizi, and M. Newman, SIAM Rev. 51, 661 (2009).
- (37) K. P. Burnham and D. R. Anderson, Model Selection and Multimodel Inference: A Practical Information-Theoretic Approach, 2nd Edition (Springer, New York, 2002).
- (38) O. Bénichou, M. Coppey, M. Moreau, P.-H. Suet, and R. Voituriez, Phys. Rev. Lett. 94, 198101 (2005).
- (39) O. Bénichou, C. Loverdo, M. Moreau, and R. Voituriez, Phys. Rev. E 74, 020102(R) (2006).
- (40) G. Oshanin, K. Lindenberg, H. S. Wio, and S. Burlatsky, J. Phys. A: Math. Theor. 42, 434008 (2009).
- (41) Whereas for Sogou-08 and Sogou-11 the logs are divided into different days, yielding a cut-off of 86,400 s for the waiting time, for Yahoo-10 the longest allowed time for a search is one hour. These cut-offs are readily seen in Fig. 7.
- (42) M. Kendall and J. D. Gibbons, Rank Correlation Methods (Oxford University Press, 1990).
- (43) J. M. Taylor, Biometrics 43, 409 (1987).
- (44) Sogou Labs, Search Engine Click-through Log (SogouQ), http://www.sogou.com/labs/dl/q-e.html, accessed on 06/05/2015.
- (45) Yahoo! Webscope, Annonymized Yahoo! Search Logs with Relevance Judgments version 1.0, http://labs.yahoo.com/Academic_Relations, accessed on 06/05/2015.
- (46) Yahoo Labs, Yahoo Labs, http://labs.yahoo.com/, accessed on 06/05/2015.
- (47) Yahoo Labs, The Yahoo! Webscope™ Program, http://webscope.sandbox.yahoo.com/, accessed on 06/05/2015.
- (48) H. Bauke, Eur. Phys. J. B 58, 167 (2007).
- (49) C. Zhu, R. H. Byrd, and J. Nocedal, ACM Transactions on Mathematical Software 23, 550 (1997).
- (50) J.-F. Bonnans, J. C. Gilbert, C. Lemarechal, and C. A. Sagastizábal, Numerical Optimization: Theoretical and Practical Aspects (Springer, Berlin, Heidelberg, New York, 2003).