Doping-induced superconductivity of ZrB and HfB
Abstract
Unlike the widely studied -type two-gap superconductor MgB, the chemically similar compounds ZrB and HfB do not superconduct above 1 K. Yet, it has been shown that small amounts of self- or extrinsic doping (in particular with vanadium), can induce superconductivity in these materials. Based on results of different macro- and microscopic measurements, including magnetometry, nuclear magnetic resonance (NMR), resistivity, and muon-spin rotation (SR), we present a comparative study of ZrVB and HfVB. Their key magnetic and superconducting features are determined and the results are considered within the theoretical framework of multiband superconductivity proposed for MgB. Detailed Fermi surface (FS) and electronic structure calculations reveal the difference between MgB and transition-metal diborides.
pacs:
74.20.Fg, 74.25.-q, 75.40.Cx, 67.80.dk, 76.60.CqI Introduction
Borides, carbides, and nitrides were among the early compound superconductors discovered in the first half of the previous centuryMeissner and Franz (1930) (see, e.g., Ref. Hott et al., 2016 for a recent review). However, it was only in 2001, with the discovery of superconductivity in MgB at 39 K,Nagamatsu et al. (2001) that researchers intensified the search for superconductivity in other diborides. Based on a large number of studies, MgB was identified as a two-band two-gap superconductor. Its peculiar Fermi surface exhibits two-dimensional hole-like cylinders from the bands, a hole-like tubular network due to the bonding bands, and an electron-like tubular network due to the antibonding bands.Kortus et al. (2001) Due to this electronic configuration and to a distinct anisotropy of the electron-phonon interaction strength, the electronic excitation spectrum of MgB adopts two gaps in the superconducting phase: a large gap of 7.2 meV in the () bands, and a small gap of 2.8 meV in the bonding and antibonding () bands. At the same time, an upper critical field anisotropy has been observed, with T and T at zero temperature.Sologubenko et al. (2002)
Besides alkaline-earth metals (such as Mg), diborides of other elements have been proposed to be checked for superconductivity. Because of the presence of partially filled 3, 4, and 5 orbitals, considered as promising for superconductivity, these new attempts involved icosagens (Al) and various -type transition metals (T). The latter (TB), which are claimed to combine average coupling constants with comparable phonon frequencies to MgBHeid et al. (2003) (due to the presence of light boron atoms), were the natural candidates in this search. Unfortunately, these renewed efforts proved unsuccessful and to date there are no reports of superconductivity for the majority of TB materials.
ZrB and HfB are two such non-superconducting refractory materials with melting points of K, behaving essentially as Pauli paramagnets down to low temperatures. The electrons in the 4 shell of zirconium (Zr) and those in the 5 shell of hafnium (Hf) are less localized than those of the 3 row. In a recent study,Renosto et al. (2013) it was found that by replacing small amounts of Zr or Hf with V, the resulting compounds ZrVB and HfVB are superconductors. Maximum superconducting temperatures K and 7.31 K were reached in ZrVB and HfVB, respectively, at the upper solubility limit of V (). X-ray powder diffraction (XRD) patternsRenosto et al. (2013) indicate that an increase in V doping does not change the in-plane lattice parameter , while it reduces the inter-layer distance . At the same time, it has been shown that the structural and electronic properties of these compounds are influenced by the presence of B vacancies.Dahlqvist et al. (2015)
In Ref. Renosto et al., 2013, the properties of superconducting ZrVB were investigated by means of macroscopic techniques.Renosto et al. (2013) In this work we aimed at combining macro- and microscopic techniques (including magnetometry, NMR, resistivity, and preliminary SR experiments) on Zr-based diborides and extend our study to include the Hf-based compound. Since we succeeded in synthesizing samples with less magnetic impurities (below 10 ppm)with respect to the previous ones,Renosto et al. (2013) whenever relevant, a comparison between the two batches is included. Our extensive data sets allowed us to unravel clear analogies and differences between the T-diborides ZrVB and HfVB and the well-known MgB. In Sec. IV.1 we show that spin-lattice relaxation processes in T-diborides are two orders of magnitude slower that in MgB, indicating significantly different electronic structures. Combined magnetometry (Sec. IV.2) and resistivity (Sec. IV.3) measurements were performed to evaluate the upper and lower critical fields, respectively. These compounds prove to be extreme type-II superconductors, as reflected by the high values ( 100) of the Ginzburg-Landau parameter. The London penetration depth was evaluated through SR (Sec. IV.4) experiments and the coherence length via upper critical field measurements (Sec. IV.3). Thanks to the efficient complementarity of these four techniques, we argue that, besides the qualitatively different Fermi surfaces of MgB and transition-metal diborides, in both cases we are dealing with -wave superconductors. While the rather high of MgB is understood as a consequence of a favorable electronic structure and electron-phonon interaction, the drastic effect of V-doping in the T-diborides is still rather surprising.
II Electronic structures of ZrB and HfB
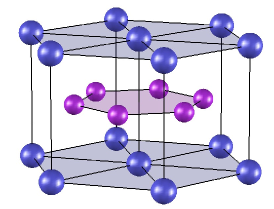
Both pure and V-doped compounds crystallize in the layered AlB structure with a hexagonal space group, where the Zr (or Hf) atoms and the B atoms occupy, respectively, the (0,0,0) and (1/3, 2/3, 1/2) positions. As in MgB, their crystal lattices are characterized by hexagonal metal layers alternating with graphite-like B layers (see Fig. I).
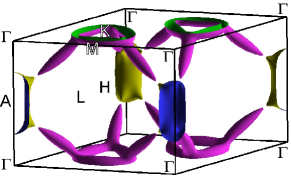
Previous results of band-structure calculationsShein and Ivanovskii (2002); Grechnev et al. (2009) and Fermi surface (FS) representationsShein and Ivanovskii (2002) are available in the literature for both ZrB and HfB. Since, however, the printed version of the published FS of ZrB suffers from low quality, we chose to present the result of our own calculation in Fig. II, intended to serve for a comparison with the published FS of Mg,Mazin and Antropov (2003) well known for its amazingly high critical temperature of the order of 40 K for the onset of superconductivity. Our density-functional calculations use an LDA approachPerdew and Wang (1992) based on the DMol band-structure modeling program.Delley (1990, 2000) The self-consistent field (SCF) was accomplished using the standard DNPDelley (1990) variational basis set and a -centered -mesh in the reciprocal cell. Pseudized scalar relativistic correctionsDelley (1998) were applied. The calculations are based on the experimental geometries published in Ref. Bsenko and Lundström, 1974. The FS plot was generated using the XCrySDen programKokalj (1999) based on the DMol output for a -mesh.
The ZrB FS consists of four short cylindrical hole-type pockets around the point and four tripod-shaped electron-type pockets, each consisting of a triangular ring around the point and three elliptic extensions near the plane. Since the FS of HfB exhibits essentially the same features, we refrained from presenting it in a separate figure. These features are really quite different from those of the FS of MgB. Most obvious is the reduction of the two almost two-dimensional hole sheets centered near the point for MgB to one much smaller and 3-D type pocket for Zr- and Hf-diboride. Likewise the 3-D parts are quite different in shape for MgB. It is therefore not surprising that the two borides investigated here are less favorably conditioned for superconductivity than MgB and indeed for both pure compounds, no superconductivity was detected above 1 K. The band-structure calculations for the T-borides considered here indicate that in both cases the density of electronic states at the Fermi energy is located in a region where exhibits a pseudo-gap, i.e., is much reduced. It is thus remarkable that a very small (4–5%) V-for-Zr or V-for-Hf substitution results in onsets of superconductivity up to approximately 8 K. More details on the crystal structure and defect-induced phase instabilities of these types of compounds are discussed in Ref. Renosto et al., 2013.
III Experimental details
Polycrystals of ZrB, HfB, ZrVB, and HfVB were synthesized via boron carbide reduction and structurally characterized as described in Ref. Renosto et al., 2013. For our magnetic measurements, the samples in form of fine powders, with masses between 50 and 100 mg, were sealed in Teflon (PTFE) tubes. The NMR investigations including line-shape and spin-lattice relaxation measurements were performed in an applied magnetic field of 3.505 T, since higher fields would reduce the possibility to resolve the quadrupolar effects. In our case, the B nucleus (spin ) proved to be the most suitable one, since it allows a direct comparison between the four samples and it is four times more abundant than B. The NMR signals were monitored by means of standard spin-echo sequences, consisting in and pulses of 2 and 4 s, respectively, with recycle delays ranging from 10 to 100 s, depending on the temperature ranging between 4 and 295 K. The NMR line-shapes were obtained via the fast Fourier Transform (FFT) of the echo signal which, due to the high sensitivity of B, could be acquired using relatively few scans (from 4 to 2048). The spin-lattice relaxation times were measured with the inversion recovery method, using a -- pulse sequence. The magnetometry measurements were performed by using a commercial Magnetic Property Measurement System (MPMS XL) from Quantum Design, equipped with a 7-T magnet and covering the temperature range from 2 to 400 K. For the resistivity measurements, the samples were densely packed in cylindrical pellets with a diameter of 1.4 mm and a thickness of 5 mm, produced by applying high external pressures. The electrical contacts with a four-probe configuration were made by means of an electrically-conducting silver epoxy.
Preliminary SR measurements were made at the GPS spectrometer of the SS facility of Paul Scherrer Institute (PSI) in Villigen, Switzerland. The available sample mass (300 mg) was sufficient to stop the 4-MeV muons without additional degraders and with a minimal background signal. To avoid pinning effects, well known for distorting the vortex lattice (VL) in the superconducting phase of MgB,Niedermayer et al. (2002) the transverse-field (TF) muon-spin rotation measurements were made at the highest field available (0.6 T).
IV Experimental results and discussion
IV.1 Nuclear Magnetic Resonance
The B NMR lines of all the samples (both pure and V-doped) were measured from 5 to 295 K; typical data are shown in Fig. IV.1. The reference B NMR frequency in an applied magnetic field of 3.505 T was evaluated to be MHz. In our case, the NMR lines exhibit peaks which are very close to the reference, with an absolute positive shift of only about 6 kHz, corresponding to a Knight shift of 120 ppm. In the covered temperature range between 5 and 295 K the B NMR lines practically coincide (see Fig. IV.1), implying temperature-independent Knight shifts for all the measured samples, compatible with the plateaux observed in the magnetometry data, measured under zero-field cooled conditions (see Fig. IV.1). The trend of the Knight shift in the superconducting phase could not be resolved because of the appreciable width of the resonance signal. As the line position, also the full width at half maximum (FWHM) is practically constant upon varying the temperature. For the Zr-based samples its value is 13 kHz (with 1 kHz of additional broadening below ), while for those containing Hf the width is 14 kHz (+1 kHz at low temperatures). The typical quadrupole splitting in ZrB and HfB is approximately the same, i.e. 54 kHz. This relatively small value implies a rather small electric-field gradient (EFG), especially if compared with MgB, for which kHz,Papavassiliou et al. (2001) which is a signature of a different electronic charge distribution, confirmed by the different orbitals involved in the bonds, i.e. only and orbitals for MgB and also orbitals for T-borides.
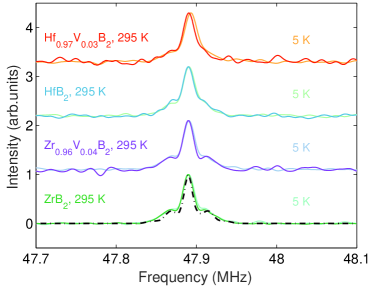
For typical powder spectra of a nucleus with a small quadrupole splitting, an analytical expression for the line-shape can be derived by considering the quadrupole term as a first-order perturbation in the main Zeeman Hamiltonian.Goc and Fiat (1987); Cohen (1954) As shown in Fig. IV.1, the experimental spectrum and the simulated line-shape (dashed line) for ZrB agree quite well. The simulation of the powder spectrum, employing a Matlab code, performs the integration according to Euler’s method over all the possible orientations of the NMR line-shape factorGoc and Fiat (1987) , i.e., the integration of the transition frequencies, derived from the quadrupolar theory and weighted using a Gaussian broadening function.Alderman et al. (1986); Hodgkinson and Emsley (2000) From a quantitative analysis, the electric-field gradient (EFG) tensor can be evaluated using
| (1) |
with the largest EFG component (parallel to the applied magnetic field), the nuclear spin, and the quadrupole moment of the nucleus. By considering the hexagonal symmetry of the AlB structure, we can assume that the in-plane anisotropy parameter and, therefore, . Since the tensor is traceless, by evaluating from the simulated data (see Eq. 1), we get Vm and Vm.
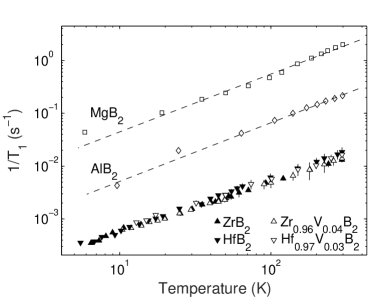
As summarized in Table IV.1, the Knight shift values are of the same order of magnitude as in MgB,Kotegawa et al. (2001); Papavassiliou et al. (2001); Baek et al. (2002); Pavarini et al. (2003) but we note a difference of two orders of magnitude (!) in the spin-lattice relaxation rates. The measured value for MgB is sK which, by considering its 70 ppm Knight shift, implies an experimental Korringa constant sK, approximately 3 times smaller than the theoretical value sK. Upon V-doping, the very slow relaxation processes in T-diborides are non significantly altered but, nevertheless, this apparently insignificant doping induces superconductivity at relatively high critical temperatures. Furthermore, due to strong covalent bonds, the largest contribution to the electronic density of states (DOS) at the Fermi level is due to itinerant electrons in the boron layers. With respect to AlB and even more so to MgB, of our compounds is drastically reduced, as clearly confirmed by the spin-lattice relaxation data, in turn in good agreement with our theoretical calculations on the electronic structure of ZrB and HfB.
| Material | Shift (ppm) | (10 s K) | (10 s K) |
|---|---|---|---|
| ZrB | 120 | 1.81 0.07 | 2.60 0.18 |
| ZrVB | 120 | 1.89 0.07 | 2.72 0.11 |
| HfB | 140 | 1.67 0.05 | 3.27 0.12 |
| HfVB | 140 | 1.56 0.07 | 3.06 0.09 |
| AlB | -10 | 0.14 0.04 | 0.009 0.001 |
| MgB | 70 | 0.018 0.006 | 0.009 0.001 |
The raw data, i.e., B NMR inverse saturation recovery curves, for the temperatures above were fitted by assuming the standard magnetization recovery formula for a single spin-lattice relaxation time.McDowell (1995) However, due to the expected high anisotropy of , and by analogy with MgB,Sologubenko et al. (2002) in powder samples we expect grains with different orientations, i.e., where the applied magnetic field lies in the plane or is parallel to the axis. A priori the orthogonal and parallel magnetic susceptibilities and the upper critical field depend on the direction of the field. The existence of nonequivalent grains, due to the anisotropy of the upper critical field, is also confirmed by magnetometry (Fig. IV.1) and resistivity (Fig. IV.3) measurements, which show a superconducting width transition K, hence suggesting the persistence of inhomogenous domains. In a first approximation and following a procedure employed in the MgB case,Baek et al. (2002); Pavarini et al. (2003), we can fit the data, by assuming two relaxation processes (see Eq. 2), related to the normal phase and to the superconducting phase, respectively:
| (2) |
Here is the time delay in the NMR pulse sequence, and the spin-lattice relaxation times of the superconducting and normal grains, respectively, the superconducting volume fraction and the stretching parameter (close to 1 in this case). We assume that is a temperature-dependent fit parameter, ranging from (in case of maximum superconducting fraction, as evaluated from magnetometry data), down to 0. In the transition region the two plateaux are connected with a sigmoidal function.
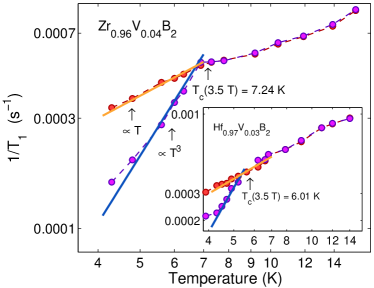
The spin-lattice relaxation data above follow the linear behavior in of a simple metal (see Fig. IV.1), where nuclear relaxation occurs mostly via interactions with the conduction electrons. On the other hand, below , the superconducting grains may exhibit two trends: a power-law with an integer exponent, typical of anisotropic superconductors, or an exponential trend, as expected for -wave superconductors. If the sample is not perfectly homogeneous, a second relaxation component could persist as a linear trend associated to normal grains, as shown in Fig. IV.1. The hypothesis of the two relaxation times is justified by the good fit results that we obtain for the evaluation of spin-lattice relaxation rates . A quantitative analysis is however hampered by a contribution to the relaxation from the flux vortex lines (i.e., their thermal motion).Jung et al. (2001); Rigamonti et al. (1998) Since we performed a field cooling (FC) measurement, the formation of a flux line lattice (FLL) with a regular arrangement of vortices, most likely with hexagonal symmetry, is expected. The geometric parameter of this lattice is the intervortex spacing , which implies nm in our case. This value is approximately 6 times the diameter of the vortices , as evaluated in Sec. IV.3, implying that the measured T values consist of the sum of a slow contribution from outside the vortex cores and a faster contribution from the normal region within the vortices.Rigamonti et al. (1998)
We speculate that the considerable anisotropy of the upper critical field of MgB,Sologubenko et al. (2002) is also a characteristic of our materials. A rigorous confirmation would be obtained by relevant experiments on single crystals as, e.g., thermal conductivity measurements. In general, -wave superconductors exhibit an exponential decrease of well below , from which the gap value can be extracted. The appearance of a Hebel-Slichter coherence peak is usually interpreted as confirming the Cooper-pairing with spherical symmetry. In our case, the absence of a coherence peak does not rule out an -wave parity, since the size of the peak can be significantly reduced by the pair-breaking mechanism in the presence of high fields.Masuda and Okubo (1969) Due to the above-mentioned complexity of the relaxation processes and the quality of our data, it is impossible to extract the gap value from the exponential decrease of the spin-lattice relaxation time. In any case a first evidence for -wave superconductivity is the increasing deviation from a power-law behavior with an exponent 3 towards lower temperatures (see Fig. IV.1). To justify the similarities between the phonon-mediated -wave superconductivity mechanism in MgB and our V-doped samples we note that vanadium, given its orbital, has one more electron, if compared to Zr () and Hf (). An analogous electron doping is confirmed in the case of MgB, where the -states of Mg are pushed up by the B orbitals and, therefore, fully donate their electrons to the boron-derived conduction band.Kortus et al. (2001) This doping mechanism occurs also in the opposite direction (reduction of the value) in MgB. In this case, both the substitution of Mg with Li (hole doping) and of boron with carbon or Al (electron doping) reduce the of the material.Karpinski et al. (2008) In this case, it is claimed that the electrons fill the band and holes occupy the band, therefore making charge compensation impossible. Furthermore, a recent paperJung et al. (2013) supports the hypothesis of two gaps in ZrVB from critical current density measurements in different fields. In fact, can suitably be fitted by the sum of two contributions and , respectively, related to the first and the second gap, following an exponential trend as a function of the applied magnetic field.
IV.2 SQUID Magnetometry
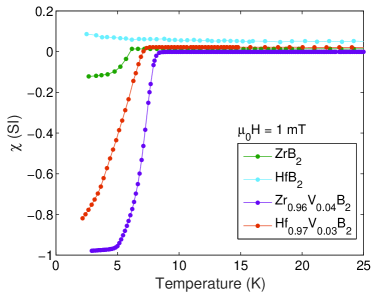
SQUID magnetometry measurements were made on all the samples (ZrB, HfB, ZrVB, and HfVB). The high sensitivity (10 Am) of the Reciprocating Sample Option (RSO) of the MPMS magnetometer allowed us to detect small impurities. In particular, in the ZrB and ZrVB samples a small mass fraction of about 0.5 % exhibits a superconducting transition at 5.5 K, the typical of ZrB impurities. Smaller impurity contributions are also visible from the plots at fields between 0.1 and 7 T, exhibiting a steady increase below 20 K. Therefore, an accurate measurements of was achieved by applying a small magnetic field of 1 mT. The obtained values of are 8.33 K for ZrVB and 7.31 K for HfVB. As shown in the inset of Fig. IV.2, the typical type-II SC cycles can be observed below ; above , a clear diamagnetic trend is confirmed with a typical mmol, a value approximately 5 times smaller than bismuth.
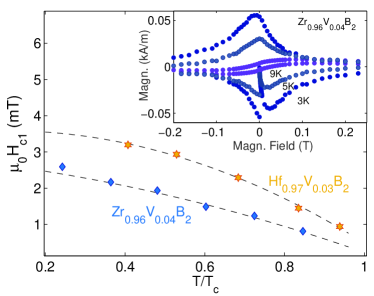
The low-field region (from 0.2 to 6 mT), exhibits an initial linear trend in . It is possible to extract an approximate value of , defining it as the field at which the deviation from the linear trend (called Meissner line) exceeds the sensitivity of the instrument. Performing this analysis, for each of the vs. curves, we obtain , as shown in Fig. IV.2 for both ZrVB and HfVB. According to the two-band Ginzburg-Landau theory applied to MgB, the lower critical field exhibits a change in concavity (from negative to positive, upon cooling) at 0.5.Askerzade et al. (2002) Since this change is scarcely distinct and the model depends upon the interband mixing of the two order parameters and of their gradients, it is difficult to interpret the trend which, as reported in the literature for MgB,Sharoni et al. (2001); Li et al. (2001) can be fitted even with a line. On the other hand, the previously reported ZrVB data,Renosto et al. (2013) show a pronounced upturn, which is not present in our case. The reason for this discrepancy is unclear at the moment.
IV.3 Resistivity
Systematic resistivity measurements were performed in zero field on all the samples (ZrB, HfB, ZrVB, and HfVB), as shown in Fig. IV.3, and on the superconducting samples ZrVB (see the inset of Fig. IV.3) and HfVB in magnetic fields up to 7 T.
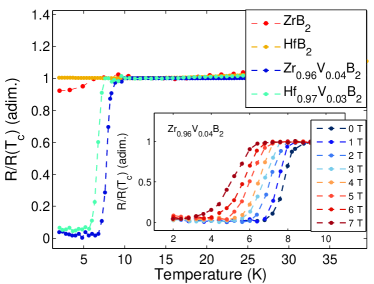
Each resistance measurements in zero field (ZF) was performed from 2 to 310 K, while in field we focused our attention on the superconducting transition region (range from 2 to 10 K). Due to the small resistivity values, i.e., 0.7 cm for ZrVB and 0.8 cm for HfVB, we argue that we can analyze our data within the clean limit approximation.
Based on the data at different fields, the values were evaluated. According to the theory of Werthamer, Helfand, and Hohenberg (WHH),Helfand and Werthamer (1966) in the clean limitKhim et al. (2011) and for small spin-orbit couplings,Werthamer et al. (1966) we have
| (3) |
Within this approximation, can be fitted with a parabolic curve:
| (4) |
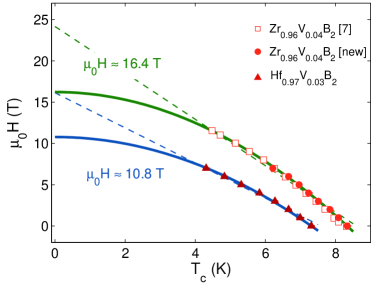
From the Ginzburg-Landau formula , our estimate of the coherence lengths in both ZrVB and HfVB are 4.5(1) and 5.5(1) nm, respectively. By numerically solving
| (5) |
we finally obtain the Ginzburg-Landau parameter, with a value of 125 for ZrVB and 80 for HfVB, respectively indicating the strong type II nature of these superconductors. From , the London penetration depth in the two materials, is 570 and 445 nm, respectively.
IV.4 Muon-spin rotation results in the SC phase
Values of similar magnitude for the magnetic field penetration depth were obtained from preliminary muon-spin rotation (SR) experiments on ZrVB (see Fig. IV.4). Once implanted in matter, spin-polarized muons act as microscopic probes of magnetism, which upon decay emit positrons preferentially along the muon-spin direction. From the spatial anisotropy of the emitted positrons (i.e., the asymmetry signal) one can reveal the distribution of the local magnetic fields. Blundell (1999); Yaouanc and de Réotier (2011) In our case, by applying of 0.6 T, a regular flux-line lattice (FLL) develops in the superconducting phase below . By uniformly sampling the FLL muons experience an additional relaxation , which is related to the absolute magnetic penetration depth via:Brandt (1988, 2003)
| (6) |
Here Tm is the magnetic flux quantum and MHz/T, the muon gyromagnetic ratio.
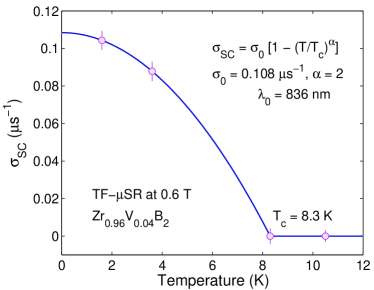
Figure IV.4 shows the temperature dependence of , proportional to the superfluid density (), together with a numerical fit with an average-field model , which gives m and . Subsequently, by using the relation , we estimate the in-plane magnetic penetration depth nm. This value is close to the one determined via macroscopic methods (see above), but it is very different from nm, also measured via SR in MgB.Niedermayer et al. (2002) This difference can be accounted for by considering the rather small electronic density of states in ZrVB compared to that in MgB, compatible with the very different NMR relaxation-rate values reported in Table IV.1.
As a final note, we recall that the choice of the applied transverse field is crucial for the correct determination of the field penetration depth. Indeed, detailed studies of the magnetic field dependence of the muon-spin depolarization rate in MgB (see, e.g., Figs. 1 and 2 in Ref.Niedermayer et al., 2002) have shown strong pinning effects in low applied fields (below 0.3 T). These imply a considerably distorted vortex lattice leading to a strong decay of the muon asymmetry and hence underestimated values. However, since in fields exceeding 0.3 T, only weak or no pinning effects were observed, we are confident that by applying a transverse field of 0.6 T, our results reflect the penetration depth.
V Summary and conclusions
From SQUID magnetometry, NMR, resistivity, and preliminary SR experiment data on ZrB, HfB, ZrVB, and HfVB, we argue that the latter two samples are -wave superconductors, resulting from electron doping via orbitals of vanadium. On the other hand, in MgB the peculiar self-doping exists thanks to the boron-like electrons at the Fermi level; at the same time also the states of Mg donate their electrons to the boron-derived conduction bands (metallic B). It is also worth mentioning that B vacancies (a common defect occurring in diborides) enhance the DOS even further (more than twice for doping of about 0.5 %).Dahlqvist et al. (2015) Besides the many similarities with MgB, the lower values (7.31 and 8.33 K instead of 39 K) are accounted for by the differences in the electronic structure and Fermi surface. The DOS per unit cell of MgB at the Fermi level (0.719 states/eV) is dominated (about 60%) by the orbitals of B atoms, while in the case of the undoped transition-metal diborides (ZrB, for instance) 80% of the DOS (0.130 states/eV)Shein and Ivanovskii (2002) derives from the orbitals of the cation. Furthermore, our data support the hypothesis that we are dealing with new two-band two-gap -wave superconductors, since the coexistence of a normal and a superconducting phase below suggests an anisotropy of the upper critical field, as well documented in the paradigmatic case of MgB. More direct evidence for this assumption could be obtained by various experiments probing single crystals of ZrVB and HfVB.
Acknowledgements.
This work was financially supported in part by the Schweizerische Nationalfonds zur Förderung der Wissenschaftlichen Forschung (SNF).References
- Meissner and Franz (1930) W. Meissner and H. Franz, “Supraleitfähigkeit von Carbiden und Nitriden,” Naturwissenschaften 18, 418–419 (1930).
- Hott et al. (2016) R. Hott, R. Kleiner, Th. Wolf, and G. Zwicknagl, “Review on superconducting materials,” (2016), appeared in Encyclopedia of Applied Physics, arXiv:1306.0429v2 [cond-mat.supr-con] .
- Nagamatsu et al. (2001) J. Nagamatsu, N. Nakagawa, T. Muranaka, Y. Zenitani, and J. Akimitsu, “Superconductivity at 39 K in magnesium diboride,” Nature 410, 63–64 (2001).
- Kortus et al. (2001) J. Kortus, I. I. Mazin, K. D. Belashchenko, V. P. Antropov, and L. L. Boyer, “Superconductivity of metallic boron in MgB,” Phys. Rev. Lett. 86, 4656–4659 (2001).
- Sologubenko et al. (2002) A. V. Sologubenko, J. Jun, S. M. Kazakov, J. Karpinski, and H.-R. Ott, “Temperature dependence and anisotropy of the bulk upper critical field of MgB,” Phys. Rev. B 65, 180505 (2002).
- Heid et al. (2003) R. Heid, B. Renker, H. Schober, P. Adelmann, D. Ernst, and K.-P. Bohnen, “Lattice dynamics and electron-phonon coupling in transition-metal diborides,” Phys. Rev. B 67, 180510 (2003).
- Renosto et al. (2013) S. T. Renosto, H. Consoline, C. A. M. dos Santos, J. Albino Aguiar, Soon-Gil Jung, J. Vanacken, V. V. Moshchalkov, Z. Fisk, and A. J. S. Machado, “Evidence of multiband behavior in the superconducting alloy ZrVB,” Phys. Rev. B 87, 174502 (2013).
- Dahlqvist et al. (2015) M. Dahlqvist, U. Jansson, and J. Rosen, “Influence of boron vacancies on phase stability, bonding and structure of MB (MTi, Zr, Hf, V, Nb, Ta, Cr, Mo, W) with AlB type structure,” J. Phys.: Condens. Matter 27, 435702 (2015).
- Shein and Ivanovskii (2002) I. R. Shein and A. L. Ivanovskii, “Band structure of ZrB, VB, NbB, and TaB hexagonal diborides: Comparison with superconducting MgB,” Phys. Solid State 44, 1833–1839 (2002).
- Grechnev et al. (2009) G.E. Grechnev, A.V. Fedorchenko, A.V. Logosha, A.S. Panfilov, I.V. Svechkarev, V.B. Filippov, A.B. Lyashchenko, and A.V. Evdokimova, “Electronic structure and magnetic properties of transition metal diborides,” J. Alloys Compd. 481, 75–80 (2009).
- Mazin and Antropov (2003) I.I. Mazin and V.P. Antropov, “Electronic structure, electron–phonon coupling, and multiband effects in MgB,” Phys. C: Supercond. 385, 49–65 (2003).
- Perdew and Wang (1992) J. P. Perdew and Y. Wang, “Accurate and simple analytic representation of the electron-gas correlation energy,” Phys. Rev. B 45, 13244–13249 (1992).
- Delley (1990) B. Delley, “An all-electron numerical method for solving the local density functional for polyatomic molecules,” J. Chem. Phys. 92, 508–517 (1990).
- Delley (2000) B. Delley, “From molecules to solids with the DMol approach,” J. Chem. Phys. 113, 7756–7764 (2000).
- Delley (1998) B. Delley, “A scattering theoretic approach to scalar relativistic corrections on bonding,” Int. J. Quant. Chem. 69, 423–433 (1998).
- Bsenko and Lundström (1974) L. Bsenko and T. Lundström, “The high-temperature hardness of ZrB and HfB,” J. Less Common Metals 34, 273 – 278 (1974).
- Kokalj (1999) A. Kokalj, “XCrySDen—a new program for displaying crystalline structures and electron densities,” J. Mol. Graph. Model. 17, 176 – 179 (1999).
- Niedermayer et al. (2002) Ch. Niedermayer, C. Bernhard, T. Holden, R. K. Kremer, and K. Ahn, “Muon spin relaxation study of the magnetic penetration depth in MgB,” Phys. Rev. B 65, 094512 (2002).
- Papavassiliou et al. (2001) G. Papavassiliou, M. Pissas, M. Fardis, M. Karayanni, and C. Christides, “ NMR detection of the magnetic field distribution in the mixed superconducting state of MgB,” Phys. Rev. B 65, 012510 (2001).
- Goc and Fiat (1987) R. Goc and D. Fiat, “NMR powder spectrum simulation for nuclei with ,” Phys. Status Solidi (B) 140, 243–250 (1987).
- Cohen (1954) M. H. Cohen, “Nuclear quadrupole spectra in solids,” Phys. Rev. 96, 1278–1284 (1954).
- Alderman et al. (1986) D. W. Alderman, M. S. Solum, and D. M. Grant, “Methods for analyzing spectroscopic line shapes. NMR solid powder patterns,” J. Chem. Phys. 84, 3717–3725 (1986).
- Hodgkinson and Emsley (2000) P. Hodgkinson and L. Emsley, “Numerical simulation of solid-state NMR experiments,” Prog. Nucl. Magn. Reson. Spectrosc. 36, 201 – 239 (2000).
- Baek et al. (2002) S. H. Baek, B. J. Suh, E. Pavarini, F. Borsa, R. G. Barnes, S. L. Bud’ko, and P. C. Canfield, “NMR spectroscopy of the normal and superconducting states of MgB and comparison to AlB,” Phys. Rev. B 66, 104510 (2002).
- McDowell (1995) A. F. McDowell, “Magnetization recovery curves for quadrupolar spins,” J. Magn. Reson., Ser. A 113, 242–245 (1995).
- Kotegawa et al. (2001) H. Kotegawa, K. Ishida, Y. Kitaoka, T. Muranaka, and J. Akimitsu, “Evidence for strong-coupling -wave superconductivity in MgB: B NMR study,” Phys. Rev. Lett. 87, 127001 (2001).
- Pavarini et al. (2003) E. Pavarini, S. H. Baek, B. J. Suh, F. Borsa, S. L. Bud’ko, and P. C. Canfield, “NMR relaxation rates and Knight shifts in MgB and AlB: theory versus experiments,” Supercond. Sci. Tech. 16, 147 (2003).
- Jung et al. (2001) J. K. Jung, S. H. Baek, F. Borsa, S. L. Bud’ko, G. Lapertot, and P. C. Canfield, “B NMR and relaxation in the MgB superconductor,” Phys. Rev. B 64, 012514 (2001).
- Rigamonti et al. (1998) A. Rigamonti, F. Borsa, and P. Carretta, “Basic aspects and main results of NMR-NQR spectroscopies in high-temperature superconductors,” Rep. Progr. Phys. 61, 1367 (1998).
- Masuda and Okubo (1969) Y. Masuda and N. Okubo, “Nuclear spin-lattice relaxation in superconducting mixed state,” J. Phys. Soc. Jpn. 26, 309–314 (1969).
- Karpinski et al. (2008) J. Karpinski, N. D. Zhigadlo, S. Katrych, K. Rogacki, B. Batlogg, M. Tortello, and R. Puzniak, “MgB single crystals substituted with Li and with Li-C: Structural and superconducting properties,” Phys. Rev. B 77, 214507 (2008).
- Jung et al. (2013) S.-G. Jung, J. Vanacken, V. V. Moshchalkov, S. T. Renosto, C. A. M. dos Santos, A. J. S. Machado, Z. Fisk, and J. Albino Aguiar, “Critical current density and flux pinning in ZrVB superconductor with AlB structure,” J. Appl. Phys. 114, 133905 (2013).
- Askerzade et al. (2002) I. N. Askerzade, A. Gencer, and N. Güçlü, “On the Ginzburg-Landau analysis of the upper critical field in MgB,” Supercond. Sci. Technol. 15, L13 (2002).
- Sharoni et al. (2001) A. Sharoni, I. Felner, and O. Millo, “Tunneling spectroscopy and magnetization measurements of the superconducting properties of MgB,” Phys. Rev. B 63, 220508 (2001).
- Li et al. (2001) S. L. Li, H. H. Wen, Z. W. Zhao, Y. M. Ni, Z. A. Ren, G. C. Che, H. P. Yang, Z. Y. Liu, and Z. X. Zhao, “Linear temperature dependence of lower critical field in MgB,” Phys. Rev. B 64, 094522 (2001).
- Helfand and Werthamer (1966) E. Helfand and N. R. Werthamer, “Temperature and purity dependence of the superconducting critical field, . II,” Phys. Rev. 147, 288–294 (1966).
- Khim et al. (2011) S. Khim, B. Lee, J. W. Kim, E. S. Choi, G. R. Stewart, and K. H. Kim, “Pauli-limiting effects in the upper critical fields of a clean LiFeAs single crystal,” Phys. Rev. B 84, 104502 (2011).
- Werthamer et al. (1966) N. R. Werthamer, E. Helfand, and P. C. Hohenberg, “Temperature and purity dependence of the superconducting critical field, . III. Electron spin and spin-orbit effects,” Phys. Rev. 147, 295–302 (1966).
- Blundell (1999) S. J. Blundell, “Spin-polarized muons in condensed matter physics,” Contemp. Physics 40, 175–192 (1999).
- Yaouanc and de Réotier (2011) A. Yaouanc and P. Dalmas de Réotier, Muon Spin Rotation, Relaxation, and Resonance: Applications to Condensed Matter (Oxford University Press, Oxford, 2011).
- Brandt (1988) E. H. Brandt, “Flux distribution and penetration depth measured by muon spin rotation in high- superconductors,” Phys. Rev. B 37, 2349–2352 (1988).
- Brandt (2003) E. H. Brandt, “Properties of the ideal Ginzburg-Landau vortex lattice,” Phys. Rev. B 68, 054506 (2003).