The ALMA-PILS survey: Detection of CH3NCO toward the low-mass protostar IRAS 16293-2422 and laboratory constraints on its formation
Abstract
Methyl isocyanate (CH3NCO) belongs to a select group of interstellar molecules considered to be relevant precursors in the formation of larger organic compounds, including those with peptide bonds. The molecule has only been detected in a couple of high-mass protostars and potentially on comets. A formation route on icy grains has been postulated for this molecule but experimental evidence is lacking. Here we extend the range of environments where methyl isocyanate is found, and unambiguously identify CH3NCO through the detection of 43 unblended transitions in the ALMA Protostellar Interferometric Line Survey (PILS) of the low mass solar-type protostellar binary IRAS 16293-2422. The molecule is detected toward both components of the binary with a ratio HNCO/CH3NCO 4–12. The isomers CH3CNO and CH3OCN are not identified, resulting in upper abundance ratios of CH3NCO/CH3CNO > 100 and CH3NCO/CH3OCN > 10. The resulting abundance ratios compare well with those found for related N-containing species toward high-mass protostars. To constrain its formation, a set of cryogenic UHV experiments is performed. VUV irradiation of CH4:HNCO mixtures at 20 K strongly indicate that methyl isocyanate can be formed in the solid-state through CH3 and (H)NCO recombinations. Combined with gas-grain models that include this reaction, the solid-state route is found to be a plausible scenario to explain the methyl isocyanate abundances found in IRAS 16293-2422.
keywords:
Astrochemistry - ISM: individual objects: IRAS 16293-2422 - ISM: molecules - Methods: laboratory: molecular - Techniques: spectroscopic - Molecular processes1 Introduction
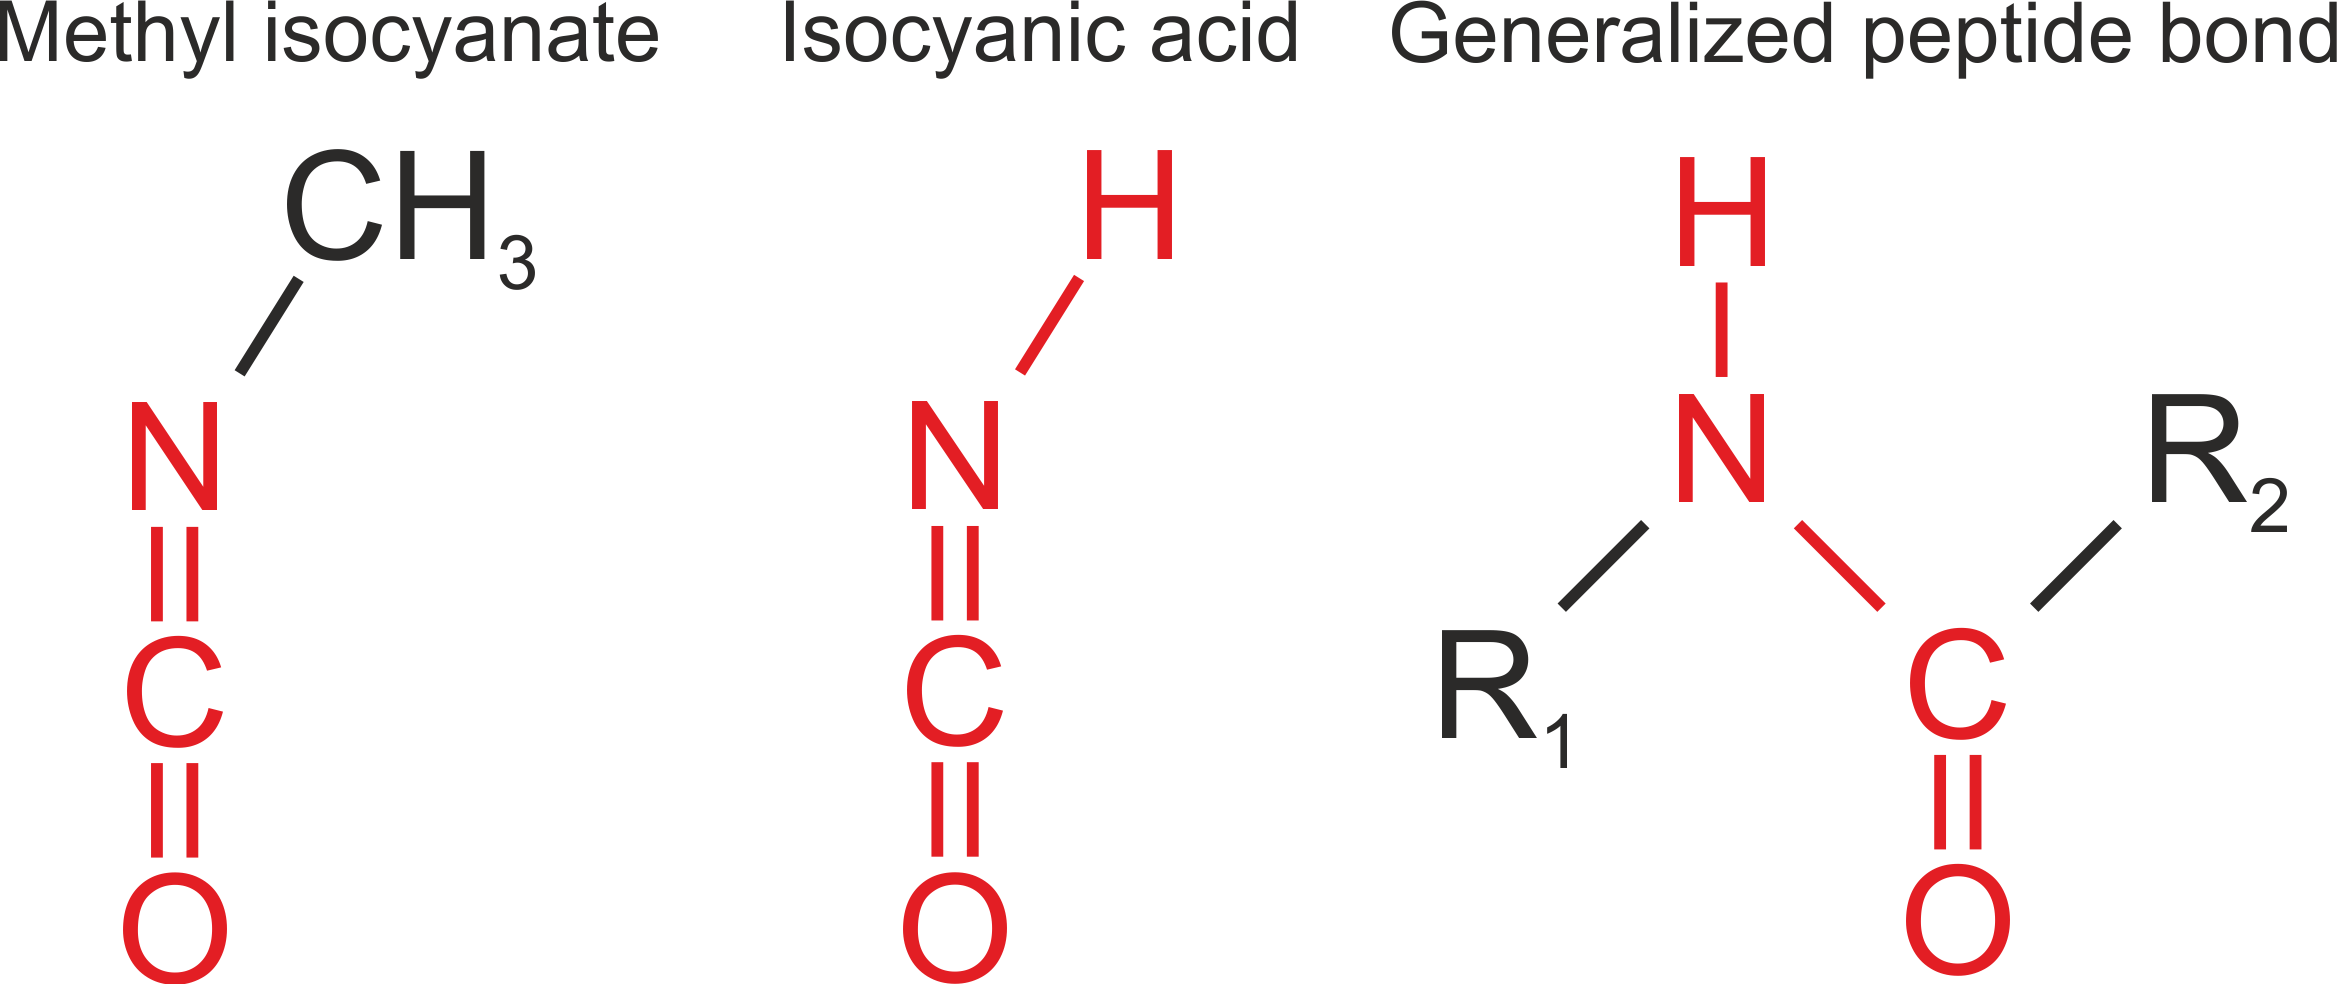
Complex organic molecules, defined in astrochemistry as molecules that consist of six or more atoms of which at least one is a carbon atom, are widely found in star-forming regions (Herbst & van Dishoeck 2009). A special category of complex molecules is that of the prebiotics, molecules that can be linked via their chemical structures or reactivity to life bearing molecules, such as amino-acids and sugars. Methyl isocyanate, CH3NCO, also known as isocyanomethane, is a molecule that falls in this category, because of its structural similarity with a peptide bond (Figure 1). This type of bond connects amino-acids to form proteins and as such is interesting because it connects to chemistry relevant to the formation of the building blocks of life.
The majority of identified complex molecules has mainly been detected toward high-mass hot cores, such as Orion KL and Sgr B2 (e.g., Blake et al. 1987, Nummelin et al. 2000, Belloche et al. 2013, 2014, Tercero et al. 2013, Neill et al. 2014, Crockett et al. 2014), but over the past decades detections toward low mass, sun-like, protostars such as IRAS 16293-2422 (hereafter IRAS16293) have been regularly reported as well. IRAS16293 (d = 120 pc) is considered as a protostellar template for low-mass sources and is particularly rich in organic molecules (van Dishoeck et al. 1995, Cazaux et al. 2003, Bottinelli et al. 2004, Kuan et al. 2004, Bisschop et al. 2008, Jaber et al. 2014). Jørgensen et al. (2012) demonstrated the capabilities of the Atacama Large Millimeter/submillimeter Array (ALMA) with the detection of the prebiotic molecule glycolaldehyde (see also Jørgensen et al. 2016, for a history of chemical studies of this source). More recently, other complex molecules (acetone, propanal, ethylene oxide) were identified in the framework of the PILS survey (Lykke et al. 2017). Even the deuterated isotopologues of several complex molecules were detected toward this source (Parise et al. 2003, Coutens et al. 2016, Jørgensen et al. 2016).
Unlike other molecules such as isocyanic acid (HNCO) and formamide (NH2CHO)(Bisschop et al. 2007, López-Sepulcre et al. 2015, Coutens et al. 2016), which have a similar peptide-like structure as methyl isocyanate, CH3NCO only recently started to attract attention in the astrochemistry community. This activity was inspired by a report from Goesmann et al. (2015) that CH3NCO may be abundantly present on the surface of comet 67P/Churyumov-Gerasimenko, as measured with the Cometary Sampler and Composition (COSAC) instrument of Rosetta’s Philae lander. Its measured high abundance of 1.3% with respect to H2O and CH3NCO/HNCO=4.3 was based on the assumption that the mass peak recorded at is dominated by CH3NCO, as COSAC’s low mass resolution does not allow discrimination of different species with nearly identical mass. Recent measurements with the Rosetta Orbiter Spectrometer for Ion and Neutral Analysis (ROSINA) at much higher mass resolution showed that the CH3NCO coma abundance is significantly lower (K. Altwegg, private communication). Nevertheless, the possibility of linking complex molecules in star- and planet-forming regions with those present in comets triggered the search for methyl isocyanate in the interstellar medium.
Interstellar CH3NCO was first detected toward Sgr B2(N) by Halfen et al. (2015) at low rotational temperatures of 25 K with a column density ratio of (HNCO)/(CH3NCO) = 35–53 depending on the specific velocity component. Cernicharo et al. (2016) detected methyl isocyanate toward Orion KL at (HNCO)/(CH3NCO) 15 and = 150 K. Their observations toward the cold prestellar core B1-b did not yield a detection of the molecule down to a upper column density limit of 1011 cm-2 or (HNCO)/(CH3NCO) > 42 (based on a HNCO detection toward the same source by López-Sepulcre et al. 2015). In the same paper, publically accessible Sgr B2 observations from Belloche et al. (2013) were re-analysed with an updated spectral line list and, interestingly, yielded a detection of warm methyl isocyanate at 200 K and (HNCO)/(CH3NCO) 40. Attempts to also identify the methyl isocyanate isomer CH3CNO were unsuccessful down to (CH3NCO)/(CH3CNO) .
The astrochemical origin of methyl isocyanate is not yet understood and this is partly due to the limited number of laboratory studies that have been performed. Henderson & Gudipati (2015) tentatively assigned a mass fragmentation peak to CH3NCO after VUV irradiating solid-state mixtures of NH3:CH3OH. In other experiments by Ruzi & Anderson (2012) UV irradiation of frozen -methylformamide (CH3NHCHO) also yielded methyl isocyanate, although it was concluded to represent a minor product channel.
A number of formation routes have been hypothesized by astrochemists. Halfen et al. (2015) postulated gas-phase formation by HNCO or HOCN methylation:
| (1) |
or reactions of HNCO or HOCN with protonated methane, followed by electron recombination:
| (2) |
| (3) |
Cernicharo et al. (2016) favoured solid-state formation mechanisms based on the detection of CH3NCO toward hot cores and its non-detection in the cold dark cloud B1-b. Particularly, the methylation of HNCO has been mentioned as a possible route to form methyl isocyanate in the solid-state, i.e., on the surface of an icy dust grain:
| (4) |
Belloche et al. (2017) used the grain-surface radical-addition reaction CH3 + NCO CH3NCO in their models, with most of the NCO formed via H-abstraction of HNCO:
| (5) |
| (6) |
These postulated routes require the reactants to be present in sufficient amounts. Gaseous HNCO is detected in high abundances in protostellar environments and has been imaged in IRAS16293, showing it to be prominent in both source A and B (Bisschop et al. 2008, Coutens et al. 2016). It likely results from sublimation of OCN-, known to be a major ice component in low-mass protostellar envelopes (van Broekhuizen et al. 2005). A significant abundance of CH3 gas is a more speculative assumption since the molecule can only be observed by infrared spectroscopy and has so far only been seen in diffuse gas toward the Galactic Center (Feuchtgruber et al. 2000). Alternatively, CH3 radicals can be produced in situ in ices by photodissociation of known abundant ice components like CH4 or CH3OH and then react with HNCO or OCN-. This is the solid-state route that is investigated here.
In this work we present the first detection of methyl isocyanate toward both components of the low mass protobinary IRAS16293 on scales of AU. An independent detection toward source B is also reported by Martín-Doménech et al. (2017). A set of systematic laboratory experiments is presented in order to validate the solid-state formation routes of CH3NCO. The observational work is presented in Section 2 and the laboratory work in Section 3. In Section 4 the results of the observations and laboratory experiments are compared and discussed in the context of recent astrochemical models. The conclusions of this paper are given in Section 5.
2 Observations
2.1 The ALMA PILS survey
We searched for methyl isocyanate in the Protostellar Interferometric Line Survey (PILS) data, an unbiased spectral survey of the low-mass protostellar binary IRAS16293 with ALMA. A full description and data reduction of the survey is presented in Jørgensen et al. (2016). Briefly, this survey covers a spectral range from 329.147 to 362.896 GHz and was obtained with both the 12m array and the Atacama Compact Array (ACA). The beam size ranges between 0.4 and 0.7 depending on the configuration at the time of the observations. The rms of the combined data sets is about 7–10 mJy beam-1 channel-1, i.e., approximately 4–5 mJy beam-1 km s-1. To facilitate the analysis, the combined data set used in this paper was produced with a circular restoring beam of 0.5 at a spectral resolution of 0.2 km s-1.
Two positions are analysed in this study. The first position is offset by one beam diameter (0.5) from the continuum peak of source B in the south west direction (=16h32m2258, =-242832.8) (see high resolution images in Baryshev et al. 2015). Source B presents narrow lines (FWHM 1 km s-1). This position is found to be optimal for line identifications, as the lines are particularly bright, do not have strong absorption features toward the bright continuum of source B, and do not suffer from high continuum optical depth (Coutens et al. 2016, Lykke et al. 2017, Jørgensen et al. 2016). In this paper, we also analyse source A, which exhibits broader lines than source B making the line identification quite challenging (Pineda et al. 2012). The linewidth varies, however, depending on the spatial separation from this source. With an average FWHM of 2.5 km s-1, the position =16h32m2290, = appears to be one of the best positions to search for new species toward source A (0.3′′ offset). At this position, the emission is centered at of 0.8 km s-1, blueshifted from the source A velocity of km s-1 (Jørgensen et al. 2011).
Bisschop et al. (2008) found HNCO and other nitrogen containing species such as CH3CN to be more prominent toward source A than source B. Consequently, it is also interesting to check whether there exists a small scale chemical differentiation among the N-bearing species for the two sources.
2.2 Results
Methyl isocyanate is detected toward both components A and B of IRAS16293. The identification is based on spectroscopic data from the Cologne Database for Molecular Spectroscopy (CDMS, Müller et al. 2001, 2005), taken from Cernicharo et al. (2016) as well as from Koput (1986). CH3NCO is an asymmetric rotor with the NCO group lying at an angle of 140o and a low-lying ( cm-1) C-N-C bending mode . Moreover, the barrier to internal rotation of the CH3 group is low, only 21 cm-1. The pure rotational spectrum therefore has and torsional states and vibrationally excited transitions can become detectable at temperatures of a few hundred K. The labelling of the states used here refers to the quantum numbers (rotational angular momentum), and (projection of angular momentum on the respective inertial axes) with internal rotation interactions indicated by the quantum number , with =0 and 3 for the states and =1, -2 and 4 for the states (Halfen et al. 2015, Cernicharo et al. 2016).
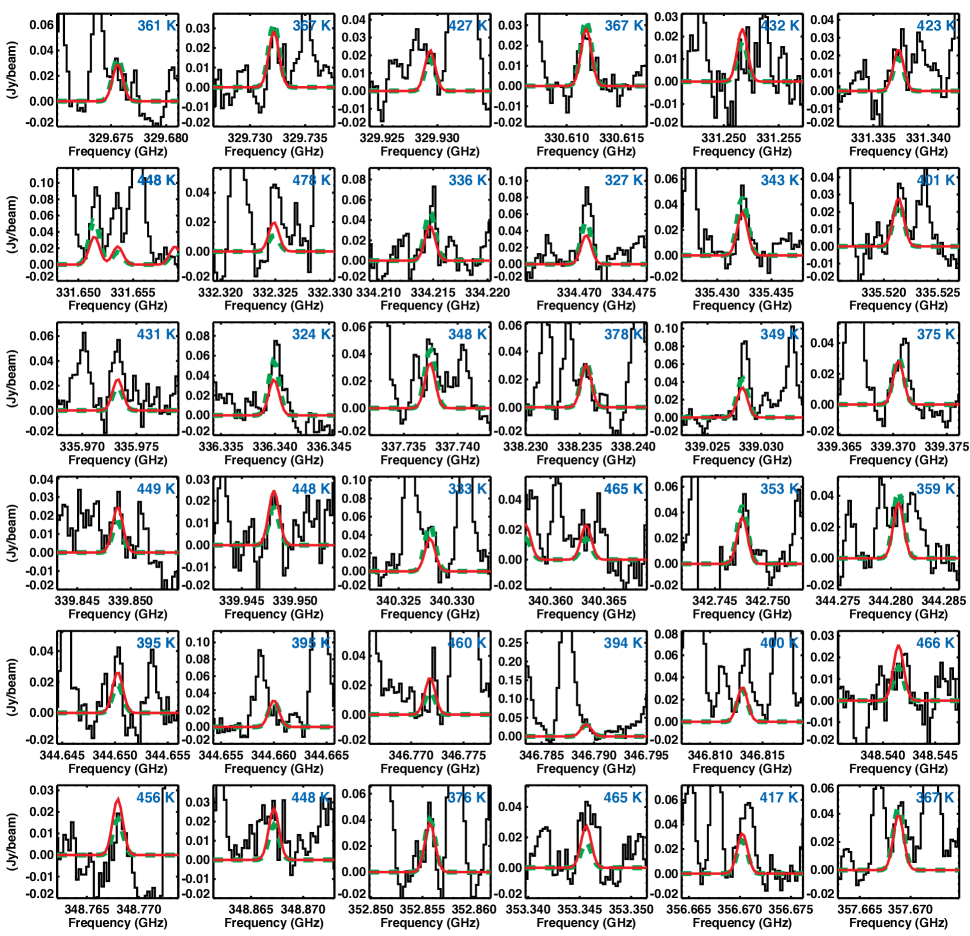
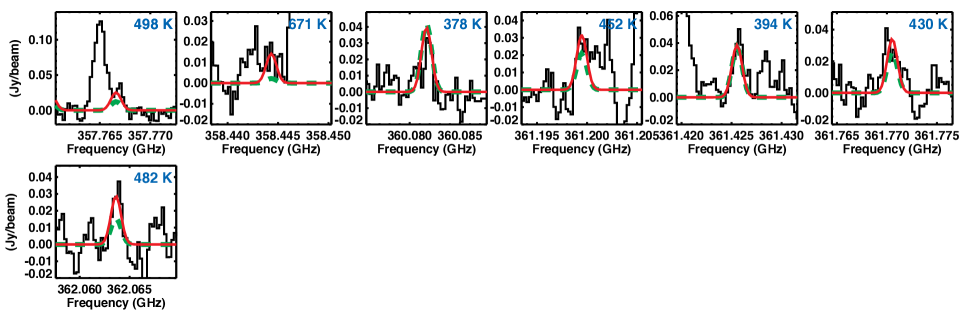
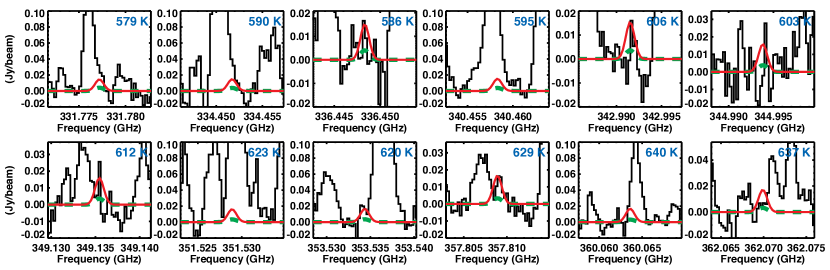
Using the CASSIS software111http://cassis.irap.omp.eu/, we have been able to identify 43 unblended lines of CH3NCO in the bending ground state ( = 0) with upper energy levels ranging from 320 to 670 K toward source B (see Table 2). Figure 3 shows the unblended lines detected toward this component as well as the LTE modeling for two different excitation temperatures at 100 and 300 K. Both excitation temperatures allow to reproduce the observations; only predicted transitions are observed. Our data are not sensitive to any cold CH3NCO component since lines with low values are missing in the spectral range of the PILS survey. Among the complex molecules that were detected and analysed towards source B, some (acetaldehyde, ethylene oxide) exhibit a relatively low excitation temperature of 125 K (Lykke et al. 2017), while others (formamide, isocyanic acid, methanol, methyl formate, glycolaldehyde, ethylene glycol) show a higher excitation temperature of 300 K (Jørgensen et al. 2012, Coutens et al. 2016, Jørgensen et al. 2016). Their spatial distribution is however rather similar and it is not possible to determine to which category CH3NCO belongs. The methyl isocyanate column density is not very sensitive to the exact value of the excitation temperature: assuming the same source size of 0.5 as used in previous PILS studies (Coutens et al. 2016, Jørgensen et al. 2016, Lykke et al. 2017), the CH3NCO column density is found to be about 3 1015 cm-2 and 4 1015 cm-2 for = 300 and 100 K, respectively. All lines are optically thin. It is expected that for the same assumptions all column densities toward source B are accurate to better than 30%.
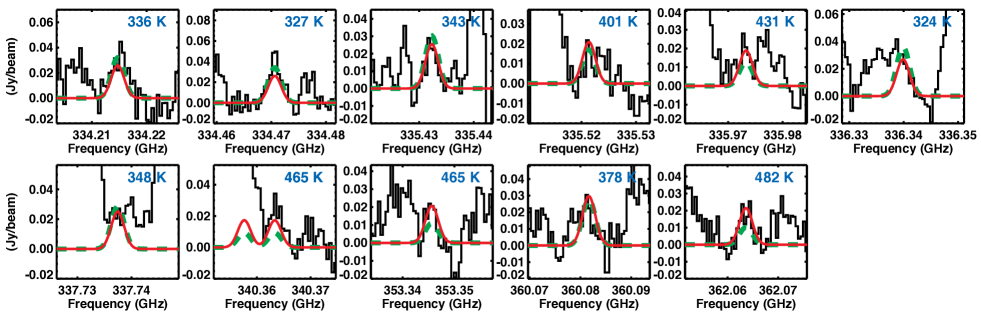
Toward source A, most of the lines are blended due to the larger linewidths ( 2.5 km s-1). We can, however, identify 11 unblended lines of CH3NCO (see Figure 4). A column density of 6 1015 cm-2 and 9 1015 cm-2 (assuming a source size of 0.5) is in good agreement with observations for excitation temperatures of 300 and 100 K, respectively, again with an uncertainty of about 30%.
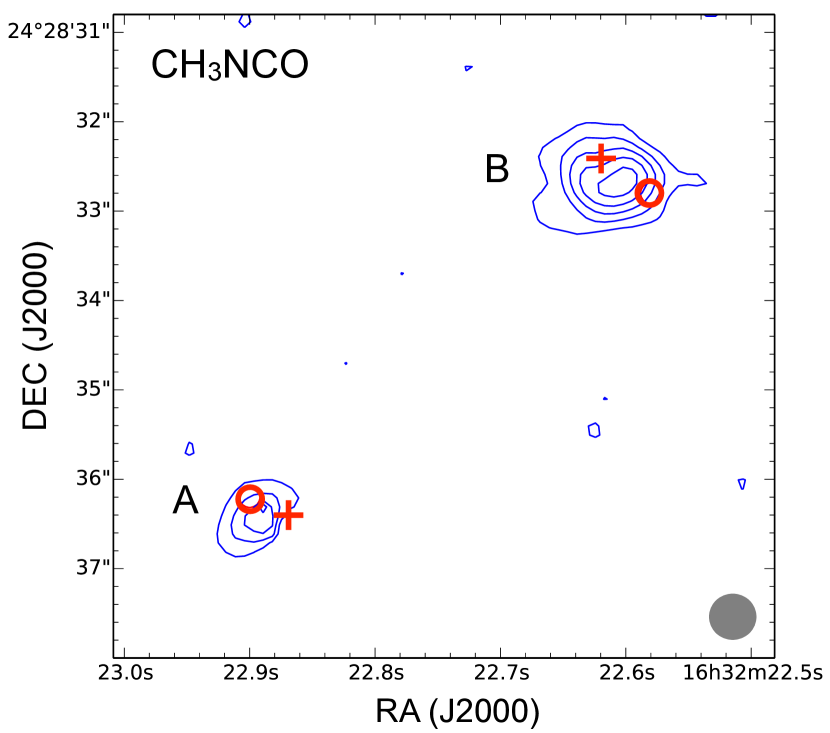
At high excitation temperatures, rotational levels in the first excited bending state (=1) may be populated as well and predictions for possible transitions are shown in Figure 7. For = 300 K, some faint lines can indeed be tentatively attributed to CH3NCO =1 transitions toward source B. An integrated intensity map of one of the brightest CH3NCO lines, the 390,39,0–380,38,0 transition at 336339.9 MHz, is presented in Figure 2. Similarly to other complex molecules, the emission is quite compact with a size of 60 AU radius and centred near the two sources, with little difference between them (Coutens et al. 2016, Jørgensen et al. 2016, Lykke et al. 2017). For source B, the emission is somewhat offset due to the continuum becoming optically thick on source.
| Source | HNCO/CH3NCO | CH3CN/CH3NCO | CH3OH/CH3NCO | Reference |
| IRAS16293 B | 12 | 8 | 3333 | This work |
| IRAS16293 A | 4 | 9 | 3200 | |
| Orion KL A | 15 | 10 | 400 | Cernicharo et al. (2016) |
| Orion KL B | 15 | 25 | 225 | |
| Sgr B2(N1) | 40 | 50 | 40 | |
| Sgr B2(N2) | 9 | 10 | 182 | Belloche et al. (2016), Belloche et al. (2017) |
| Comet 67P/C-G | >0.2 | >0.2 | – | Goesmann et al. (2015) |
| Altwegg et al. in prep. |
We also searched for spectral evidence of two isomers of methyl isocyanate - acetonitrile oxide (CH3CNO, Winnewisser et al. 1982) and methyl cyanate (CH3OCN, Sakaizumi et al. 1990, Kolesniková et al. 2016) - but the corresponding transitions were not found in the PILS data set. From this non-detection upper limits of 5 1013 cm-2 and 5 1014 cm-2 are derived, respectively (assuming an excitation temperature of 100 K). These isomers are consequently less abundant than methyl isocyanate by at least two and one orders of magnitude, in agreement with recent findings toward Orion KL (Cernicharo et al. 2016, Kolesniková et al. 2016).
In view of the important role that HNCO and HOCN may play in the formation of CH3NCO, we also searched for spectral signatures of these precursor species. The analysis of the PILS data for HNCO toward source B is presented in Coutens et al. (2016). The HNCO lines are optically thick, so lines of the isotopologue HN13CO were analysed and the HNCO column density was derived assuming a 12C/13C ratio of 68 (Milam et al. 2005). To get precise abundance ratios, we re-analysed the HN13CO data using the same dataset (with the circular restoring beam of 0.5) and obtained a HNCO column density of 3.7 1016 cm-2, which is within the 30% uncertainty range. The resulting HNCO/CH3NCO abundance ratio is about 12 toward source B with an uncertainty of less than a factor 2. Within the error margins, this is similar to the value derived in Orion KL (Cernicharo et al. 2016) or Sgr B2(N2) (Belloche et al. 2016, Belloche et al. 2017). For source A, the column density of HNCO is estimated to be about 3.4 1016 cm-2 ( = 100 K). The corresponding HNCO/CH3NCO ratio is consequently about 4 toward this component, with a somewhat larger uncertainty of a factor of 3 due to the difficulty of deriving a precise column density for HNCO because of line blending. Overall, we can conclude that the two HNCO/CH3NCO ratios are comparable toward the two components of the binary.
Whereas HNCO is readily identified, this is not the case for HOCN. No HOCN lines were detected and a upper limit of 3 1013 cm-2 is derived toward source B. HOCN is consequently less abundant than HNCO and CH3NCO by at least 3 and 2 orders of magnitude, respectively. Therefore, it is highly unlikely that the gas-phase formation pathway involving HOCN, as proposed by Halfen et al. (2015) in Eq. 1 and 2, contributes significantly to the production of methyl isocyanate in this source.
We have also determined the abundance ratios of CH3NCO with respect to CH3OH and CH3CN for comparison with other sources in which methyl isocyanate has been detected (see Table 1). The column density of CH3OH was estimated based on CHOH by Jørgensen et al. (in prep.) for the one beam offset position toward source B ( 1 1019 cm-2) using a 16O/18O ratio of 560 (Wilson & Rood 1994). With the same assumptions, we estimate a column density of CH3OH of 2 1019 cm-2 in source A. CH3CN was analysed by Calcutt et al. (in prep.) toward both source A ( 8 1016 cm-2) and source B ( 3 1016 cm-2). Similarly to the HNCO/CH3NCO ratio, the abundance ratio of CH3CN/CH3NCO is comparable to the values found in Orion KL (Cernicharo et al. 2016) and lower than toward Sgr B2(N1), but again comparable to Sgr B2(N2) (Belloche et al. 2016, Belloche et al. 2017). Methanol is, however, clearly more abundant than methyl isocyanate toward IRAS16293 than toward Orion KL and Sgr B2.
The HNCO/CH3NCO and CH3CN/CH3NCO abundance ratios derived in IRAS16293 are much larger than the lower limits found in comet 67P (0.2). A proper comparison awaits the new results derived with the ROSINA instrument (Altwegg et al. in prep.).
3 Laboratory experiments
Grain surface formation routes of complex molecules have been investigated experimentally for many years using cryogenic set-ups to mimic specific chemical processes under fully controlled laboratory conditions (see Herbst & van Dishoeck 2009, Linnartz et al. 2015, for reviews). In the present work the formation of methyl isocyanate is investigated by energetically processing solid-state CH4:HNCO mixtures with vacuum-UV radiation. VUV irradiated methane ice is known to efficiently yield methyl radicals (Bossa et al. 2015), and these radicals are expected to further react through surface diffusion with HNCO to form CH3NCO, as proposed by Goesmann et al. (2015) and Cernicharo et al. (2016), reaction 4. The Cryogenic Photoproduct Analysis Device 2 (CryoPAD2) in the Sackler Laboratory for Astrophysics is used to perform the measurements to investigate the role of methylation of HNCO in methyl isocyanate formation. A short description of this set-up, experimental procedure and reference data is given below.
Note that in these experiments CH4 is used as the parent of CH3 but in interstellar space methyl radicals active in the ice may also originate from CH3OH dissociation (Öberg et al. 2009) or from direct CH3 accretion from the gas-phase. The main aim of this section is to investigate whether or not the proposed solid-state reaction as shown in reaction 4 can proceed at temperatures typical for dark cloud conditions in the ISM, i.e., independent of the exact precursor species.
3.1 Set-up and method
CryoPAD2 consists of a central chamber operating under ultra-high vacuum conditions ( 10-10 mbar), to which various instruments are attached. On the top a cryostat is mounted which cools a gold-coated reflective surface down to 12 K. The temperature of this surface can be controlled through resistive heating and varied between 12 and 300 K, with an absolute temperature accuracy better than 1 K. Pure and mixed gases are prepared separately in a gas-mixing system which is attached to a high-precision leak valve to the main chamber and which doses the gases onto the cooled surface. The deposited ice samples are irradiated with VUV radiation from a Microwave Discharge Hydrogen-flow Lamp (MDHL), which emits radiation peaking at 121 nm and a region between 140 to 160 nm, corresponding to photon energies in the range of 7.5 to 10.2 eV (Chen et al. 2014, Ligterink et al. 2015). The total lamp flux is (1.10.1) 1014 photons s-1 that is determined using a calibrated NIST diode. CryoPAD2 possesses two diagnostic tools to monitor the VUV induced processes in the ice. The beam of a Fourier-Transform IR Spectrometer (FTIRS) is directed under grazing incidence onto the gold-coated surface, in order to perform Reflection Absorption IR Spectroscopy (RAIRS). The sample preparation and chemical changes under influence of VUV radiation are monitored by recording vibrational fingerprint spectra of molecules on the surface. To decrease the pertubing role of atmospheric CO2 and H2O, the system is purged with filtered dry air. The second instrument is a highly sensitive Quadrupole Mass Spectrometer (QMS), with an ionization element at 70 eV, which is able to trace gas-phase molecules in the chamber that are released from the ice surface upon linear heating during a Temperature Programmed Desorption (TPD) experiment. TPD is a very useful method that allows to identify desorbing species through their specific desorption temperature and mass fragmentation pattern. Unambiguous identifications become possible through the use of isotopologues and searching for the corresponding mass shifts of specific fragments. Obviously, TPD comes with the destruction of the ice.
In the experiments CH4 (Linde Gas, 99.995% purity), 13CH4 (Sigma-Aldrich, 99% purity) and HNCO are used. HNCO is produced from cyuranic acid (Sigma-Aldrich, 98% purity), the solid trimer of HNCO, following the protocol described in van Broekhuizen et al. (2004). Impurities of the HNCO production process are removed by freeze-thaw cycles to obtain a HNCO purity of >99%.
For the experiments samples of pure HNCO and methane, and mixtures of 13CH4/CH4:HNCO at 5:1 ratio are prepared. This ratio is within a factor of 2 of that observed for interstellar ices (Öberg et al. 2011) but is particularly chosen to create a large abundance of CH3 radicals to test whether reaction 4 proceeds or not. Homogeneously mixed ices are grown on the surface at 20 K and irradiated with a total fluence of 3.31017 photons. During irradiation of the sample, IR spectra are continuously recorded at 1 cm-1 resolution. After the irradiation TPD is started, while still recording IR spectra.
The strongest vibrational features of solid methyl isocyanate are found between 2320 and 2280 cm-1 (4.34 m) for the -N=C=O antisymmetric stretching vibration and overtone 2 CH3 rocking mode. Sullivan et al. (1994) lists these at 2320, 2280, 2270, 2240 and 2228 cm-1, with 2280 cm-1 being the strongest band. Zhou & Durig (2009) positioned all bands around 2300 cm-1 and Reva et al. (2010) puts the band for methyl isocyanate in a nitrogen matrix at 2334.7, 2307.9, 2288.9, 2265.2 and 2259.7 cm-1, finding the strongest transition at 2288.9 cm-1. The region around these bands is used to monitor CH3NCO formation in the ice. We focus on the region between 2400 – 2100 cm-1. From previous experiments it is known that CO2 (2340 cm-1), OCN- (2165 cm-1) and CO (2135 cm-1) are produced from HNCO (2265 cm-1) upon irradiation and these photo-products also have spectral features in the region characterizing methyl isocyanate (Raunier et al. 2004, van Broekhuizen et al. 2004). Other known products of HNCO irradiation are formamide, urea and formaldehyde, which do not have any interfering IR features in the region of interest. Energetic processing of methane does not yield products that show up in the region of interest. Products that are formed from methane are mainly ethane and to a lesser extent ethene and ethyn (Bennett et al. 2006, Bossa et al. 2015). These species are seen in our spectra at their appropriate frequencies. The abundant formation of ethane demonstrates that CH3 is indeed produced in the experiments, since ethane is the direct product of methyl-radical recombination.
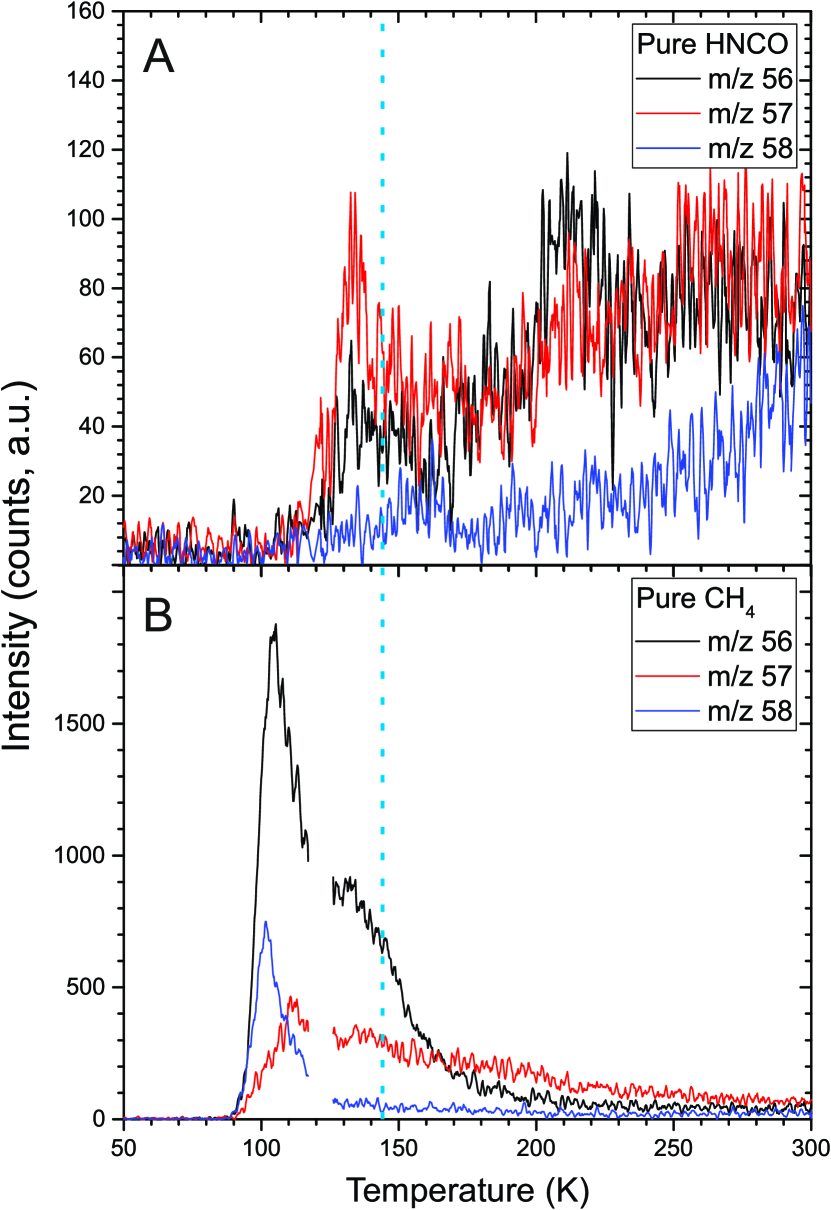
In order to identify methyl isocyanate in the gas-phase using TPD, the mass fragmentation pattern available from the NIST database222NIST Mass Spec Data Center, S.E. Stein, director, ”Mass Spectra” in NIST Chemistry WebBook, NIST Standard Reference Database Number 69, Eds. P.J. Lindstrom and W.G. Mallard, National Institute of Standards and Technology, Gaithersburg MD, 20899, http://webbook.nist.gov. is used. The fragmentation pattern at 70 eV comprises unique peaks at = 57 and 56 (hereafter also called the primary and secondary mass peak), which have a 57:56 ratio of 5:2 and these will be used as main TPD mass tracers. Known products of pure HNCO and methane irradiation does not have a mass fragmentation peak at = 57 (see also Appendix C).
It is important to mention that methyl isocyanate is severely toxic and specialised laboratories and equipment are needed to work with this substance. This complicates the extensive use of this species and for this reason additional experiments, starting from the pure precursor, have not been performed.
3.2 Results – IR Spectra
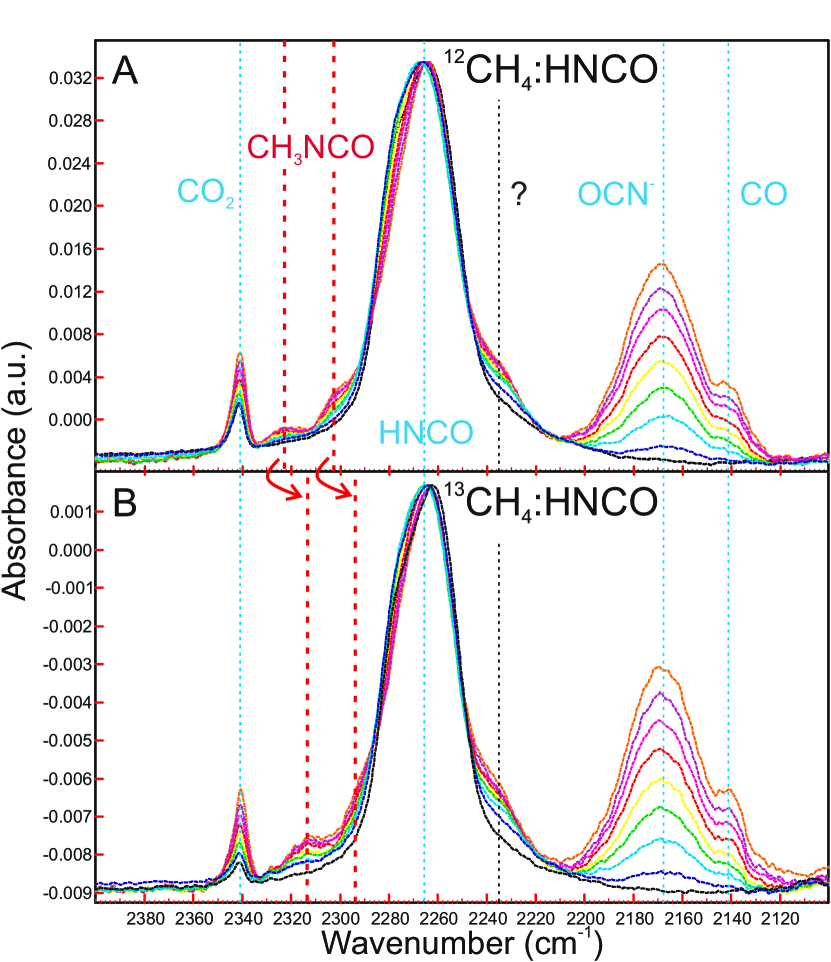
Figure 5 presents the IR spectra recorded during the first 11017 photons irradiating the 12/13CH4:HNCO samples. All spectra are normalized to the HNCO peak. Three known spectroscopic features of CO2, OCN- and CO (blue) show up during irradiation. Also, two new features become visible around 2300 cm-1 (red), which do not show up while processing samples of pure HNCO or CH4. Also a clear red shift of about 10 cm-1 of the two features is seen between the sample of 12CH4 and 13CH4, moving transitions at 2322 and 2303 cm-1 to 2313 and 2294 cm-1. These spectroscopic features are therefore the result of a product formed in the reaction between methane and isocyanic acid, and, since they are found close to known CH3NCO features (given by Sullivan et al. (1994) and Reva et al. (2010)), are plausibly identified with methyl isocyanate. Another feature is seen in the wing of the HNCO peak around 2235 cm-1, which does not clearly shift with methane isotopologues. The origin of this band is unclear.
Bandstrength values for methyl isocyanate are not available from the literature, however, a rough indication of the amount of formed methyl isocyanate versus lost HNCO can be given by making the assumption that the bandstrength of the NCO antisymmetric stretch vibration of methyl isocyanate equals that of the corresponding vibration of HNCO. To obtain the ratio, the integrated area of the 2303 cm-1 feature is divided by the integrated loss area of the 2265 cm-1 HNCO band for a number of spectra. A ratio of (HNCO)/(CH3NCO) = 100 – 200 is found, which is about an order of magnitude higher than the ratio observed toward IRAS16293. It should be noted, that it is not clear whether solid state laboratory and gas phase astronomical abundances can be directly compared (see e.g. Chuang et al. 2017). It is likely that ongoing gas phase reactions, for one or the other species, change the solid state to gas phase ratios. It is also possible that non-linear RAIRS effects can offset the column density (Teolis et al. 2007) or that the CH3NCO bandstrength is significantly different. In a same manner CH3NCO photodestruction may affect the overall abundances.
3.3 Results – temperature programmed desorption
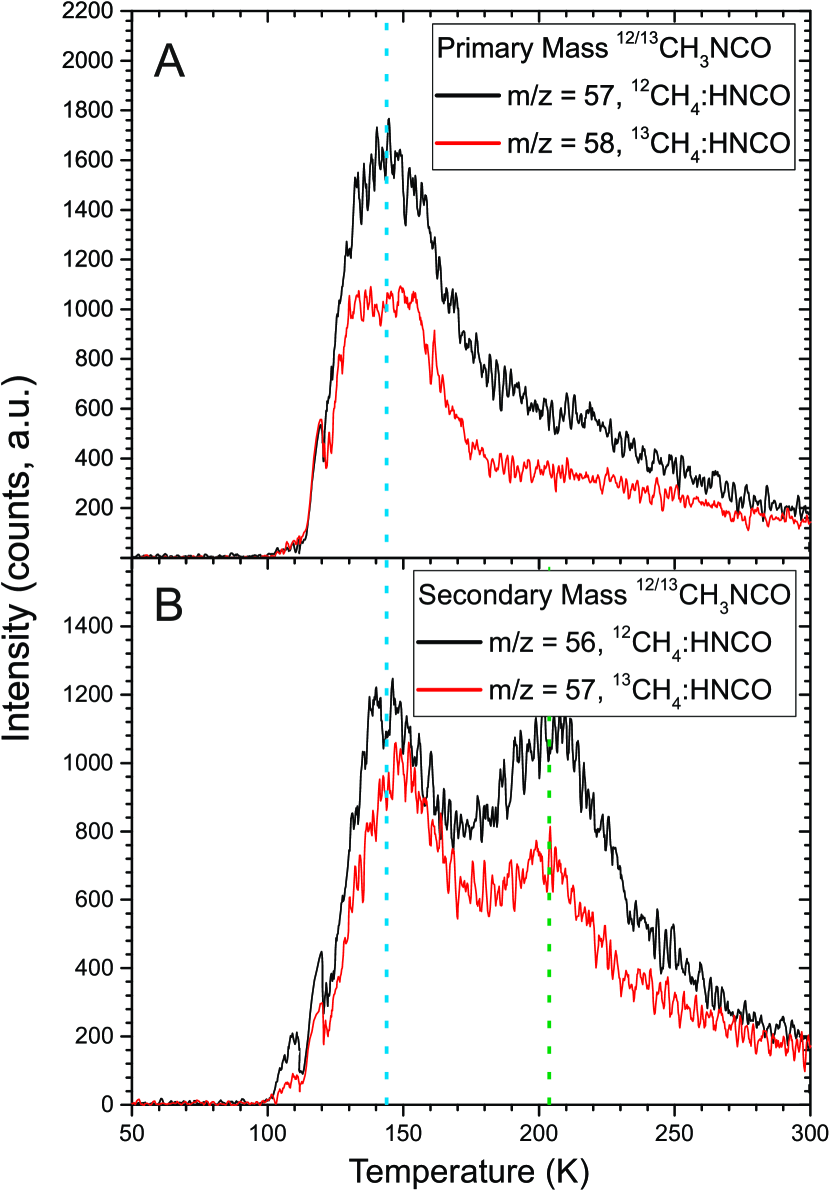
The desorption temperature of methyl isocyanate has not been reported in the literature, but the TPD traces of our experiments on UV processed CH4:HNCO ices do show the combined release of the primary and secondary masses of methyl isocyanate =57 and 56 at 145 K (Figure 6). The verification experiment of pure HNCO did not show these masses and only = 56 (and no 57) was seen after the irradiation of pure methane ice, releasing at 105 K (Figure 8 in the Appendix). At the 145 K desorption peak the primary over secondary mass ratio is around 1-1.5, lower than the value of 2.5 suggested by NIST upon 70 eV electron impact ionization. The NIST calibration values are a good indicator of the values to be expected, but are to some extent set-up specific. In such cases, the expected reactant can be deposited directly and the fragmentation pattern can be studied adapted to the set-up in use. This is unfortunately not possible here due to the aforementioned toxicity of methyl isocyanate. Moreover, contributions from other reaction products cannot be fully excluded. In Figure 6B a second desorption peak is found around 205 K, which is seen only as a shoulder in panel A. It is unlikely that this peak is associated with methyl isocyanate, instead it shows that the chemical network involves the formation of other species as well. In fact, since the additional product(s) have a mass fragmentation pattern which contributes to the secondary mass of methyl isocyanate, this could explain why the primary/secondary mass ratio does not exactly match with that given by NIST. Additionally, the unidentified product of pure methane irradiation could be trapped in the ice and contribute to other desorption peaks. Therefore the 145 K desorption peak is still consistent with methyl isocyanate. There is also no other candidate molecule with a primary mass of 57 in the NIST database that could plausibly explain the TPD spectra.
CryoPAD2 offers the unique feature to combine IR and TPD data, i.e., at the moment a specific ice feature starts thermally desorbing, the IR signal starts decreasing and simultaneously the mass signal is increasing. In the measurements presented here, this effect is not as clearly visible as in previous studies (e.g. Öberg et al. (2009)), but this may be partly due to the low final S/N of the feature, making it difficult to link RAIRS and TPD signals. The present data are as accurate as possible, but obviously their interpretation would benefit from focused experiments determining the thermal desorption peak of pure CH3NCO and the IR bandstrengths.
4 Linking observations and laboratory data
Methyl isocyanate is detected in a significant abundance toward both components of IRAS16293 with an excitation temperature of at least 100 K. The two isomers, CH3CNO and CH3OCN, are not detected. Abundance ratios with respect to HNCO and CH3CN are found to be similar to those found for Orion KL and comparable within a factor of a few to Sgr B2, making a common formation pathway in these three sources likely. Moreover, no chemical differentiation between source A and B is found. Gas-phase production of CH3NCO via HOCN (reaction 1) can be seen as insignificant due to the low upper limit on this molecule, but a gas-phase route involving HNCO cannot be excluded.
The laboratory experiments on the formation of CH3NCO strongly suggest that a solid-state formation scheme is possible, starting from two astronomically relevant precursor species, CH4 and HNCO. The proposed reaction CH3 + HNCO CH3NCO + H indeed seems to proceed, confirming a solid state reaction pathway, but other routes such as hydrogen stripping CH3 + HNCO CH4 + NCO may take place in parallel. Reactions involving the OCN- anion, which is abundantly formed in these experiments, provide alternative routes. Irradiation of a sample of OCN-:CH4, where OCN- is formed via the acid-base reaction of HNCO with NH3, will be interesting to study in future work since this anion is also a well known component of interstellar ice (Boogert et al. 2015).
Belloche et al. (2017) have incorporated reactions 5 and 6 (see Section 1) into the large gas-grain model MAGICKAL (Garrod 2013) and simulated the cold collapse + warm-up phase of a hot core region. Although tailored to the high-mass source SgrB2(N) many of the model features are also expected to be valid for the case of IRAS16293. In this model, HNCO is formed by reaction of NH + CO, a route that has been demonstrated experimentally by Fedoseev et al. (2015, 2016). Depending on assumptions about the barriers of the grain surface reactions involved in the formation of HNCO and CH3NCO, abundance ratios HNCO/CH3NCO of 3-50 following ice sublimation are readily found in the models, consistent with the IRAS16293 observations.
5 Conclusions
The main observational and experimental conclusions are listed below:
-
1.
Methyl isocyanate is detected for the first time toward a low mass protostar, IRAS16293, on solar system scales (emission radius of 60 AU). Column densities of (3–4) 1015 and (6–9) 1015 cm-2 are obtained toward source B and A, respectively, yielding (HNCO)/(CH3NCO) = 12 and 4, with no significant variation between the two sources.
-
2.
The abundance ratios of CH3NCO relative to the N-bearing species HNCO and CH3CN are similar to those found toward Orion KL and deviate by at most an order of magnitude from Sgr B2.
-
3.
The isomers of methyl isocyanate, CH3CNO and CH3OCN, are not detected. These species are less abundant than CH3NCO by at least a factor 100 and 10, respectively.
-
4.
HOCN is not found down to <3 1013 cm-2, giving (HOCN)/(HNCO) > 1000, which makes this an insignificant gas-phase precursor to methyl isocyanate in IRAS16293.
-
5.
Laboratory experiments strongly suggest that it is possible to form CH3NCO on an icy surface, irradiating CH4 and HNCO as astronomically relevant precursor species with VUV light, generating methyl radicals as reactive intermediates to form methyl isocyanate.
The detection of CH3NCO adds to the growing list of complex molecules known to be present around solar mass protostars, showing that the ingredients for prebiotic molecules are abundant. Future deeper searches for even more complex molecules relevant for the origin of life are warranted.
Acknowledgements
This paper makes use of the following ALMA data: ADS/JAO.ALMA#2013.1.00278.S. ALMA is a partnership of ESO (representing its member states), NSF (USA) and NINS (Japan), together with NRC (Canada) and NSC and ASIAA (Taiwan), in cooperation with the Republic of Chile. The Joint ALMA Observatory is operated by ESO, AUI/NRAO and NAOJ. Astrochemistry in Leiden is supported by the European Union A-ERC grant 291141 CHEMPLAN, by the Netherlands Research School for Astronomy (NOVA) and by a Royal Netherlands Academy of Arts and Sciences (KNAW) professor prize. CryoPAD2 was realized with NOVA and NWO (Netherlands Organisation for Scientific Research) grants. The work of A.C. was funded by the STFC grant ST/M001334/1. The group of J.K.J. acknowledges support from a Lundbeck Foundation Group Leader Fellowship, as well as the ERC under the European Union’s Horizon 2020 research and innovation programme through ERC Consolidator Grant S4F (grant agreement No 646908). Research at the Centre for Star and Planet Formation is funded by the Danish National Research Foundation. The authors of this paper thank A. Belloche (Max-Planck-Institut für Radioastronomie) for useful input to the paper. We would like to thank the referee for the constructive comments.
References
- Baryshev et al. (2015) Baryshev A. M., et al., 2015, A&A, 577, A129
- Belloche et al. (2013) Belloche A., Müller H. S. P., Menten K. M., Schilke P., Comito C., 2013, A&A, 559, A47
- Belloche et al. (2014) Belloche A., Garrod R. T., Müller H. S. P., Menten K. M., 2014, Science, 345, 1584
- Belloche et al. (2016) Belloche A., Müller H. S. P., Garrod R. T., Menten K. M., 2016, A&A, 587, A91
- Belloche et al. (2017) Belloche A., et al., 2017, accepted in A&A,
- Bennett et al. (2006) Bennett C. J., Jamieson C. S., Osamura Y., Kaiser R. I., 2006, ApJ, 653, 792
- Bisschop et al. (2007) Bisschop S. E., Jørgensen J. K., van Dishoeck E. F., de Wachter E. B. M., 2007, A&A, 465, 913
- Bisschop et al. (2008) Bisschop S. E., Jørgensen J. K., Bourke T. L., Bottinelli S., van Dishoeck E. F., 2008, A&A, 488, 959
- Blake et al. (1987) Blake G. A., Sutton E. C., Masson C. R., Phillips T. G., 1987, ApJ, 315, 621
- Boogert et al. (2015) Boogert A. C. A., Gerakines P. A., Whittet D. C. B., 2015, ARA&A, 53, 541
- Bossa et al. (2015) Bossa J.-B., Paardekooper D. M., Isokoski K., Linnartz H., 2015, Physical Chemistry Chemical Physics (Incorporating Faraday Transactions), 17, 17346
- Bottinelli et al. (2004) Bottinelli S., et al., 2004, ApJ, 617, L69
- Cazaux et al. (2003) Cazaux S., Tielens A. G. G. M., Ceccarelli C., Castets A., Wakelam V., Caux E., Parise B., Teyssier D., 2003, ApJ, 593, L51
- Cernicharo et al. (2016) Cernicharo J., et al., 2016, A&A, 587, L4
- Chen et al. (2014) Chen Y.-J., Chuang K.-J., Muñoz Caro G. M., Nuevo M., Chu C.-C., Yih T.-S., Ip W.-H., Wu C.-Y. R., 2014, ApJ, 781, 15
- Coutens et al. (2016) Coutens A., et al., 2016, A&A, 590, L6
- Crockett et al. (2014) Crockett N. R., et al., 2014, ApJ, 787, 112
- Fedoseev et al. (2015) Fedoseev G., Ioppolo S., Zhao D., Lamberts T., Linnartz H., 2015, MNRAS, 446, 439
- Fedoseev et al. (2016) Fedoseev G., Chuang K.-J., van Dishoeck E. F., Ioppolo S., Linnartz H., 2016, MNRAS, 460, 4297
- Feuchtgruber et al. (2000) Feuchtgruber H., Helmich F. P., van Dishoeck E. F., Wright C. M., 2000, ApJ, 535, L111
- Garrod (2013) Garrod R. T., 2013, ApJ, 778, 158
- Goesmann et al. (2015) Goesmann F., et al., 2015, Science, 349
- Halfen et al. (2015) Halfen D. T., Ilyushin V. V., Ziurys L. M., 2015, ApJ, 812, L5
- Henderson & Gudipati (2015) Henderson B. L., Gudipati M. S., 2015, ApJ, 800, 66
- Herbst & van Dishoeck (2009) Herbst E., van Dishoeck E. F., 2009, ARA&A, 47, 427
- Jaber et al. (2014) Jaber A. A., Ceccarelli C., Kahane C., Caux E., 2014, ApJ, 791, 29
- Jørgensen et al. (2011) Jørgensen J. K., Bourke T. L., Nguyen Luong Q., Takakuwa S., 2011, A&A, 534, A100
- Jørgensen et al. (2012) Jørgensen J. K., Favre C., Bisschop S. E., Bourke T. L., van Dishoeck E. F., Schmalzl M., 2012, ApJ, 757, L4
- Jørgensen et al. (2016) Jørgensen J. K., et al., 2016, A&A, 595, A117
- Kolesniková et al. (2016) Kolesniková L., Alonso J. L., Bermúdez C., Alonso E. R., Tercero B., Cernicharo J., Guillemin J.-C., 2016, A&A, 591, A75
- Koput (1986) Koput J., 1986, Journal of Molecular Spectroscopy, 115, 131
- Kuan et al. (2004) Kuan Y.-J., et al., 2004, ApJ, 616, L27
- Ligterink et al. (2015) Ligterink N. F. W., Paardekooper D. M., Chuang K.-J., Both M. L., Cruz-Diaz G. A., van Helden J. H., Linnartz H., 2015, A&A, 584, A56
- Linnartz et al. (2015) Linnartz H., Ioppolo S., Fedoseev G., 2015, International Reviews in Physical Chemistry, 34, 205
- López-Sepulcre et al. (2015) López-Sepulcre A., et al., 2015, MNRAS, 449, 2438
- Lykke et al. (2017) Lykke J. M., et al., 2017, A&A, 597, A53
- Martín-Doménech et al. (2017) Martín-Doménech R., Rivilla V., Jiménez-Serra I., Quenard D., Testi L., Martín-Pintado J., 2017, preprint, (arXiv:1701.04376)
- Milam et al. (2005) Milam S. N., Savage C., Brewster M. A., Ziurys L. M., Wyckoff S., 2005, ApJ, 634, 1126
- Müller et al. (2001) Müller H. S. P., Thorwirth S., Roth D. A., Winnewisser G., 2001, A&A, 370, L49
- Müller et al. (2005) Müller H. S. P., Schlöder F., Stutzki J., Winnewisser G., 2005, Journal of Molecular Structure, 742, 215
- Neill et al. (2014) Neill J. L., et al., 2014, ApJ, 789, 8
- Nummelin et al. (2000) Nummelin A., Bergman P., Hjalmarson Å., Friberg P., Irvine W. M., Millar T. J., Ohishi M., Saito S., 2000, ApJS, 128, 213
- Öberg et al. (2009) Öberg K. I., Garrod R. T., van Dishoeck E. F., Linnartz H., 2009, A&A, 504, 891
- Öberg et al. (2011) Öberg K. I., Boogert A. C. A., Pontoppidan K. M., van den Broek S., van Dishoeck E. F., Bottinelli S., Blake G. A., Evans II N. J., 2011, ApJ, 740, 109
- Parise et al. (2003) Parise B., Simon T., Caux E., Dartois E., Ceccarelli C., Rayner J., Tielens A. G. G. M., 2003, A&A, 410, 897
- Pineda et al. (2012) Pineda J. E., et al., 2012, A&A, 544, L7
- Raunier et al. (2004) Raunier S., Chiavassa T., Duvernay F., Borget F., Aycard J. P., Dartois E., d’Hendecourt L., 2004, A&A, 416, 165
- Reva et al. (2010) Reva I., Lapinski L., Fausto R., 2010, J. Mol. Struct., 976, 333
- Ruzi & Anderson (2012) Ruzi M., Anderson D., 2012, J. Chem. Phys., 137, 194313
- Sakaizumi et al. (1990) Sakaizumi T., Mure H., Ohashi O., Yamaguchi I., 1990, Journal of Molecular Spectroscopy, 140, 62
- Sullivan et al. (1994) Sullivan J., Heusel H., Zunic W., Durig J., 1994, Spectrochimica Acta, 50
- Teolis et al. (2007) Teolis B. D., Loeffler M. J., Raut U., Famá M., Baragiola R. A., 2007, Icarus, 190, 274
- Tercero et al. (2013) Tercero B., Kleiner I., Cernicharo J., Nguyen H. V. L., López A., Muñoz Caro G. M., 2013, ApJ, 770, L13
- Wilson & Rood (1994) Wilson T. L., Rood R., 1994, ARA&A, 32, 191
- Winnewisser et al. (1982) Winnewisser M., Pearson E. F., Galica J., Winnewisser B. P., 1982, Journal of Molecular Spectroscopy, 91, 255
- Zhou & Durig (2009) Zhou S., Durig J., 2009, JMS, 924
- van Broekhuizen et al. (2004) van Broekhuizen F. A., Keane J. V., Schutte W. A., 2004, A&A, 415, 425
- van Broekhuizen et al. (2005) van Broekhuizen F. A., Pontoppidan K. M., Fraser H. J., van Dishoeck E. F., 2005, A&A, 441, 249
- van Dishoeck et al. (1995) van Dishoeck E. F., Blake G. A., Jansen D. J., Groesbeck T. D., 1995, ApJ, 447, 760
Appendix A Line list
Table 2 contains the full list of detected CH3NCO, vb=0 transitions toward IRAS16293. A total of 43 lines are observed.
| Species | Transition | Frequency | ||||
|---|---|---|---|---|---|---|
| (MHz) | (K) | (s-1) | ||||
| CH3NCO, vb=0 | (38 0 0 2 – 37 0 0 2) | 329675.6 | 361.3 | 1.71 10-3 | 77 | |
| CH3NCO, vb=0 | (38 1 0 2 – 37 1 0 2) | 329732.1 | 367.3 | 1.71 10-3 | 77 | |
| CH3NCO, vb=0 | (38 -1 0 -3 – 37 -1 0 -3) | 329929.3 | 427.1 | 1.67 10-3 | 77 | |
| CH3NCO, vb=0 | (38 -1 0 2 – 37 -1 0 2) | 330611.8 | 367.3 | 1.71 10-3 | 77 | |
| CH3NCO, vb=0 | (38 1 0 3 – 37 1 0 3) | 331251.7 | 431.6 | 1.74 10-3 | 77 | |
| CH3NCO, vb=0 | (38 0 0 -3 – 37 0 0 -3) | 331337.3 | 423.4 | 1.70 10-3 | 77 | |
| CH3NCO, vb=0 | (38 2 0 3 – 37 2 0 3) | 331653.6 | 447.5 | 1.72 10-3 | 77 | |
| CH3NCO, vb=0 | (38 3 0 -3 – 37 3 0 -3) | 332324.9 | 477.7 | 1.71 10-3 | 77 | |
| CH3NCO, vb=0 | (39 0 0 1 – 38 0 0 1) | 334214.7 | 336.5 | 1.82 10-3 | 79 | |
| CH3NCO, vb=0 | (39 1 39 0 – 38 1 38 0) | 334470.6 | 327.3 | 1.78 10-3 | 79 | |
| CH3NCO, vb=0 | (39 -1 0 1 – 38 -1 0 1) | 335432.3 | 342.5 | 1.83 10-3 | 79 | |
| CH3NCO, vb=0 | (39 2 0 2 – 38 2 0 2) | 335521.3 | 401.3 | 1.83 10-3 | 79 | |
| CH3NCO, vb=0 | (39 3 0 2 – 38 3 0 2) | 335973.3 | 431.1 | 1.82 10-3 | 79 | |
| CH3NCO, vb=0 | (39 0 39 0 – 38 0 38 0) | 336339.9 | 323.7 | 1.82 10-3 | 79 | |
| CH3NCO, vb=0 | (39 2 38 0 – 38 2 37 0) | 337737.4 | 348.4 | 1.83 10-3 | 79 | |
| CH3NCO, vb=0 | (39 0 0 2 – 38 0 0 2) | 338235.6 | 377.6 | 1.85 10-3 | 79 | |
| CH3NCO, vb=0 | (39 2 37 0 – 38 2 36 0) | 339028.2 | 349.0 | 1.85 10-3 | 79 | |
| CH3NCO, vb=0 | (38 3 0 1 – 37 3 0 1) | 339370.5 | 374.5 | 1.75 10-3 | 77 | |
| CH3NCO, vb=0 | (39 1 0 -3 – 38 1 0 -3) | 339848.8 | 448.8 | 1.88 10-3 | 79 | |
| CH3NCO, vb=0 | (39 1 0 3 – 38 1 0 3) | 339948.0 | 448.0 | 1.88 10-3 | 79 | |
| CH3NCO, vb=0 | (39 1 38 0 – 38 1 37 0) | 340327.9 | 333.1 | 1.88 10-3 | 79 | |
| CH3NCO, vb=0 | (39 2 0 -3 – 38 2 0 -3) | 340363.3 | 464.6 | 1.87 10-3 | 79 | |
| CH3NCO, vb=0 | (40 0 0 1 – 39 0 0 1) | 342747.6 | 353.1 | 1.97 10-3 | 81 | |
| CH3NCO, vb=0 | (40 1 0 1 – 39 1 0 1) | 344280.7 | 359.2 | 1.98 10-3 | 81 | |
| CH3NCO, vb=0 | (40 3 0 2 – 39 3 0 2) | 344650.3 | 447.7 | 1.97 10-3 | 81 | |
| CH3NCO, vb=0 | (40 3 38 0 – 39 3 37 0) | 344660.0 | 395.0 | 1.97 10-3 | 81 | |
| CH3NCO, vb=0 | (40 -1 0 -3 – 39 -1 0 -3) | 346771.8 | 459.6 | 1.95 10-3 | 81 | |
| CH3NCO, vb=0 | (40 0 0 2 – 39 0 0 2) | 346789.2 | 394.2 | 1.99 10-3 | 81 | |
| CH3NCO, vb=0 | (40 1 0 2 – 39 1 0 2) | 346813.1 | 400.2 | 1.99 10-3 | 81 | |
| CH3NCO, vb=0 | (40 1 0 -3 – 39 1 0 -3) | 348541.5 | 465.6 | 2.03 10-3 | 81 | |
| CH3NCO, vb=0 | (40 0 0 -3 – 39 0 0 -3) | 348768.0 | 456.2 | 1.99 10-3 | 81 | |
| CH3NCO, vb=0 | (40 -3 0 2 – 39 -3 0 2) | 348867.2 | 447.9 | 1.99 10-3 | 81 | |
| CH3NCO, vb=0 | (41 1 0 1 – 40 1 0 1) | 352855.7 | 376.2 | 2.13 10-3 | 83 | |
| CH3NCO, vb=0 | (41 3 0 2 – 40 3 0 2) | 353345.6 | 464.8 | 2.12 10-3 | 83 | |
| CH3NCO, vb=0 | (41 -1 0 2 – 40 -1 0 2) | 356670.2 | 417.3 | 2.15 10-3 | 83 | |
| CH3NCO, vb=0 | (41 1 40 0 – 40 1 39 0) | 357668.8 | 367.0 | 2.18 10-3 | 83 | |
| CH3NCO, vb=0 | (41 2 0 -3 – 40 2 0 -3) | 357766.6 | 498.4 | 2.17 10-3 | 83 | |
| CH3NCO, vb=0 | (41 0 0 5 – 40 0 0 5) | 358444.3 | 671.4 | 2.16 10-3 | 83 | |
| CH3NCO, vb=0 | (42 1 42 0 – 41 1 41 0) | 360081.7 | 378.0 | 2.23 10-3 | 85 | |
| CH3NCO, vb=0 | (42 2 0 2 – 41 2 0 2) | 361199.5 | 452.4 | 2.28 10-3 | 85 | |
| CH3NCO, vb=0 | (42 1 0 1 – 41 1 0 1) | 361425.5 | 393.7 | 2.29 10-3 | 85 | |
| CH3NCO, vb=0 | (42 3 40 0 – 41 3 39 0) | 361770.5 | 429.5 | 2.28 10-3 | 85 | |
| CH3NCO, vb=0 | (42 3 0 2 – 41 3 0 2) | 362063.6 | 482.2 | 2.28 10-3 | 85 |
Appendix B CH3NCO vb=1
Figure 7 shows the tentative identification of the first excited state of methyl isocyanate.
Appendix C = 56, 57 and 58 upon VUV irradiation of pure CH4 and HNCO samples
Several publications address the energetic processing of pure HNCO and CH4 ice and much is known about the chemistry that can be induced in these species (Raunier et al. 2004, Bennett et al. 2006, Bossa et al. 2015). Of the known chemical products, none of them contributes to the primary and secondary masses of methyl isocyanate. To verify this, pure methane and isocyanic acid have been VUV irradiated. The HNCO sample (Figure 8A) does not show any significant release of these masses. However, after irradiation of methane a substantial amount of = 56, coinciding with a lesser amount of = 58, is seen releasing at a desorption temperature of 105 K. Some 57 is seen to be released as well, although there is no clear peak found in this case. The resulting contribution of = 56 can interfere with the = 57/56 amu mass ratio of methyl isocyanate.