©2017 International World Wide Web Conference Committee (IW3C2), published under Creative Commons CC BY 4.0 License.
Cats and Captions vs. Creators and the Clock:
Comparing Multimodal Content to Context in Predicting Relative Popularity
Abstract
The content of today’s social media is becoming more and more rich, increasingly mixing text, images, videos, and audio. It is an intriguing research question to model the interplay between these different modes in attracting user attention and engagement. But in order to pursue this study of multimodal content, we must also account for context: timing effects, community preferences, and social factors (e.g., which authors are already popular) also affect the amount of feedback and reaction that social-media posts receive. In this work, we separate out the influence of these non-content factors in several ways. First, we focus on ranking pairs of submissions posted to the same community in quick succession, e.g., within 30 seconds; this framing encourages models to focus on time-agnostic and community-specific content features. Within that setting, we determine the relative performance of author vs. content features. We find that victory usually belongs to “cats and captions,” as visual and textual features together tend to outperform identity-based features. Moreover, our experiments show that when considered in isolation, simple unigram text features and deep neural network visual features yield the highest accuracy individually, and that the combination of the two modalities generally leads to the best accuracies overall.
Keywords: multimodal; social media; image processing; language modeling; Reddit
1 Introduction
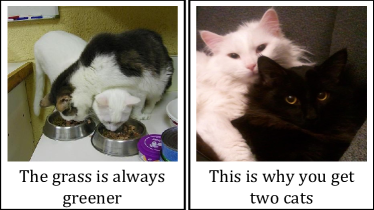
Today’s user-generated content is becoming more multimodal as users increasingly mix text, images, videos, and audio. Does one mode tend to be preferred over another — for example, on the Internet, is it indeed true that “a picture is worth a thousand words”? Or do the visual and the linguistic interact, sometimes reinforcing and sometimes counteracting each other’s individual influence? Anecdotally, at least, it seems that there is interesting interplay between these different modes. For example, Figure 1 compares two posts made to the same forum on the same site, both containing captioned images of two cats. One could argue that the leftmost one has a more clever caption111One user comments in response: “A good title! Refreshing. Better than ‘this lil guy.”’ but the second has a more attractive image. Which would more users prefer?
However, determining what multimodal content is most attractive is complicated by the fact that popularity can be strongly dependent on many non-content factors [60, 6, 31, 44, 8, 51, 39]. Posts by users that already have a large audience tend to enjoy an advantage over posts by relatively unknown people; posts that appear when users are most active are also more popular; and sometimes simply the fact that a post receives a few early clicks ensures that it gains even more popularity.
Yet to dismiss the importance of the content of a post would be wrong. From a user’s perspective, if content matters less than identity and timing, why would they bother taking better pictures or writing wittier captions? Community moderators, who would ideally like to promote high quality content even if it was submitted at a less-than-optimal time or by a non-celebrity user, would also appreciate a model of content alone. Researchers trying to understand community preferences/biases want to model users’ likes and dislikes, not the idiosyncrasies of ranking algorithms and random early upvoting patterns.
In this work, we seek to measure content preferences independent of confounding factors. We collect and analyze data from six sub-communities on reddit.com of varying size and focus. Each focuses on multimodal posts that include images and captions. Inspired by our prior work on wording effects [15, 63], we select pairs of captioned images posted at similar times (e.g., 30 seconds) to the same community and then construct models to predict which of the two eventually becomes more popular. Comparing submissions in this time-controlled setting allows us to approach an “equal footing” assumption when modeling content, and to quantify the validity of that assumption.
We choose to explicitly control for time of posting because we find that it is the most important contextual factor and because it is relatively easy to find comparable pairs. But there are other factors in play, some Reddit-specific and that are impossible for us to recover, e.g., the precise ordering of content displayed to users. However, we perform human annotation experiments that verify that these unrecoverable factors do not overwhelm the influence of content (see §3 for more details). For other factors, such as a user’s social status or experience, we take the approach of quantifying the predictive performance of such effects relative to content features, since explicitly controlling for both timing and user would leave us with too little data to work with.
When comparing “cats and captions” — that is, post content — to creator characteristics, we find that “cats and captions” are generally more important for the communities we examine. Also, while image features always outperform text features when both are considered independently (albeit only if deep learning is employed), in five of six Reddit communities, significant performance gains are observed when combining modalities.
The main contributions of this work are:
-
1.
An exploration of time-sensitive content popularity across various communities on reddit.com, and an accompanying argument for framing these investigations in a time-controlled, ranking setting.
-
2.
Several publicly available222www.cs.cornell.edu/~jhessel/cats/cats.html datasets and ranking tasks involving the prediction of community response to multimodal content, plus estimates of human performance on these tasks.
-
3.
A comparison of off-the-shelf image and language features against social and timing baselines, and a demonstration that multimodal features are worth incorporating. The models we consider can also be applied to submissions in isolation, enabling on-line scoring of novel content.
2 Datasets
Our starting point for Reddit data is Tan and Lee’s \shortcitetan+lee:15 dataset of all 106M submissions to Reddit from 2007 to 2014 and Hessel et al.’s \shortcitehessel2016science extension of this dataset to include full Reddit comment trees. Reddit, which is the most popular site on the Internet according to Alexa.com as of Fall 2016, consists of interest-centric subcommunities called subreddits. These datasets are based on the work of Jason Baumgartner of pushshift.io who scraped Reddit using their public API.
On Reddit, users are allowed to up/downvote content submitted by other users. While the exact counts of each of these votes are not made available,333The exact totals are obscured to prevent spam. Reddit computes and displays a proprietary “engagement” metric based on the number of upvotes minus the number of downvotes. This quantity, called the score of a post, has been readily used in previous work, and is the measure of engagement we will be examining.
Content on Reddit is shared with topical subreddits (e.g., politics, Art); this allows us to control for the types of content by only comparing submissions within a given subreddit. In contrast to a majority of previous work that uses general-purpose image datasets from Flickr for popularity prediction, we examine a wide variety of granularities of content, ranging from highly general to very fine. Khosla et al. [37], for example, find that objects like revolvers and women’s bathing suits are predictive of popularity, whereas spatulas, plungers, and laptops have a negative impact. In other words, while previous work has addressed which types of objects tend to become popular, here we examine what objects of a given type become popular.
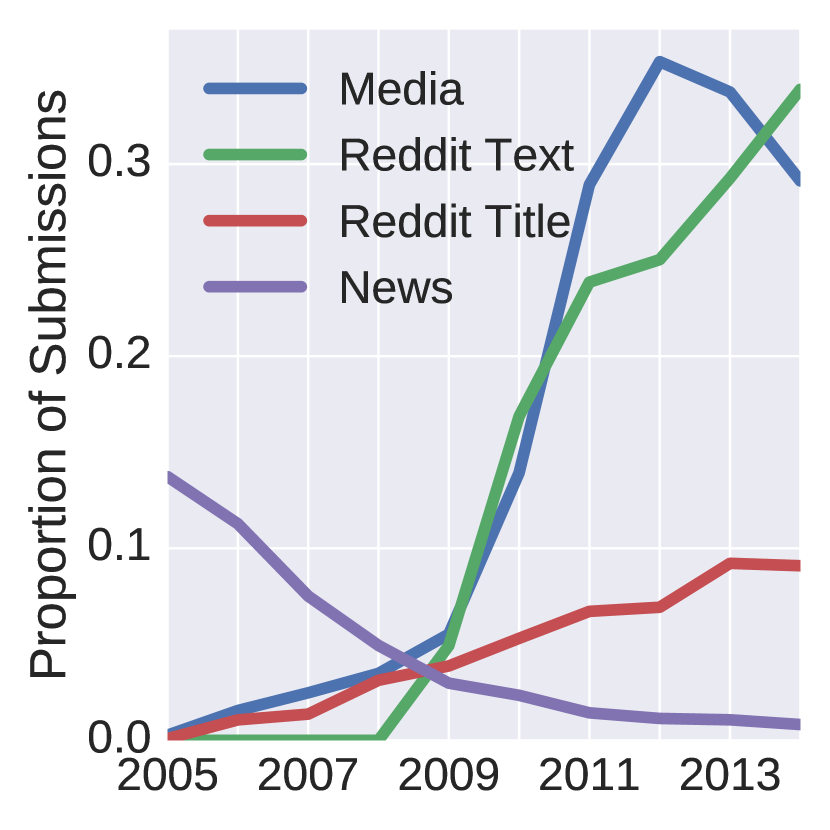
Many subreddits embody a larger growing trend towards images, video, and other media content. Nearly all major social media sites (e.g., Facebook, Twitter, Pinterest) support image and video, and some networks make multimodal content their focus (e.g., Instagram). We performed a similar analysis to Singer et al. \shortcitesinger2014evolution, and hand-categorize popular top-level domains on Reddit into “media” (e.g., imgur, youtube) “news” (e.g., cnn, bbc) and Reddit internal title-only and text posts. Figure 2 demonstrates the dramatic rise in multimedia content submitted to Reddit from 2005 to 2014. Note that this graph is proportional — the raw number of multimedia submissions to the site is still rising, even though the proportion has flattened. Roughly 30% of all submissions to Reddit are images, gifs, videos, and the like. In fact, more than 400 subreddits have each amassed more than 5,000 image submissions. If researchers frame problems carefully, these communities offer a diverse set of in-situ human and community reactions to multimedia content without the need for expensive annotations.
We focus on six image-centric subreddits of varying popularity, visual focus, and social structure. These communities range from pics,444According to the moderators: pics is “a place to share photographs and pictures.” which has millions of subscribers and offers few guidelines about what types of images are permitted, to RedditLaqueristas [sic], where users submit photographs of artistically lacquered fingernails. Typical examples of image/text submissions made to aww are shown in in Figure 1.555The left submission was the more popular of the two, receiving at least 1K more upvotes than the right. General statistics about each of these datasets are presented in Table 1. Note that some community name abbreviations are also introduced here.
While users are able to submit links from any website on the Internet to any subreddit, the most common top-level domain is imgur.com (Alexa.com rank 48, Fall 2016), a site created to be an image hosting companion site to Reddit.666https://goo.gl/2fX34m Imgur allows users to upload content which can subsequently be shared to Reddit. All images in our datasets were fetched from Imgur.
| # Users | #/% Imgur | Cap Len | |
|---|---|---|---|
| pics | 2108K | 2472K/70% | 9.84 |
| aww | 1010K | 954K/81% | 9.13 |
| cats | 109K | 100K/73% | 8.97 |
| MakeupAddiction (MA) | 77K | 58K/57% | 13.67 |
| FoodPorn (FP) | 74K | 50K/77% | 9.39 |
| RedditLaqueristas (RL) | 27K | 39K/73% | 11.12 |
We define a subreddit to be “active” if it receives more than 15 submissions on that day.777This is mostly done to filter out the unreliable feedback early in a community’s life. After the first active day, the proportion of active days thereafter varies from 96% in the case of pics to 55% in the case of RL, with an average of 83% over all datasets. We attempted to scrape all images from all active days from all six subreddits from Reddit’s inception until February 1st, 2014.
As preprocessing we remove any duplicate images, 888We filter duplicate links by matching imgur ID and duplicate images by PHash with a hand-picked hamming distance threshold of five. We attempt to discard all copies of repeat submissions to mitigate any effect of repeated submissions, though deleted posts and pathological cases prevent us from guaranteeing that there are no duplicates. and any animated or corrupted images. Imgur albums consisting of multiple images are also discarded. All images are resized to 256 pixels by 256 pixels. All datasets, including train/test splits, are available at www.cs.cornell.edu/~jhessel/cats/cats.html.
3 Time and Rich-getting-richer
Our objective is to isolate content features and predict the relative popularity of two items posted at approximately the same time. This approach has the advantage that it is relatively insensitive to two factors: the time of posting and the absolute number of positive user votes. In this section we provide arguments that these factors are significant in our data set and that previous methods for controlling for these factors are not sufficient.
Why Control for Time?
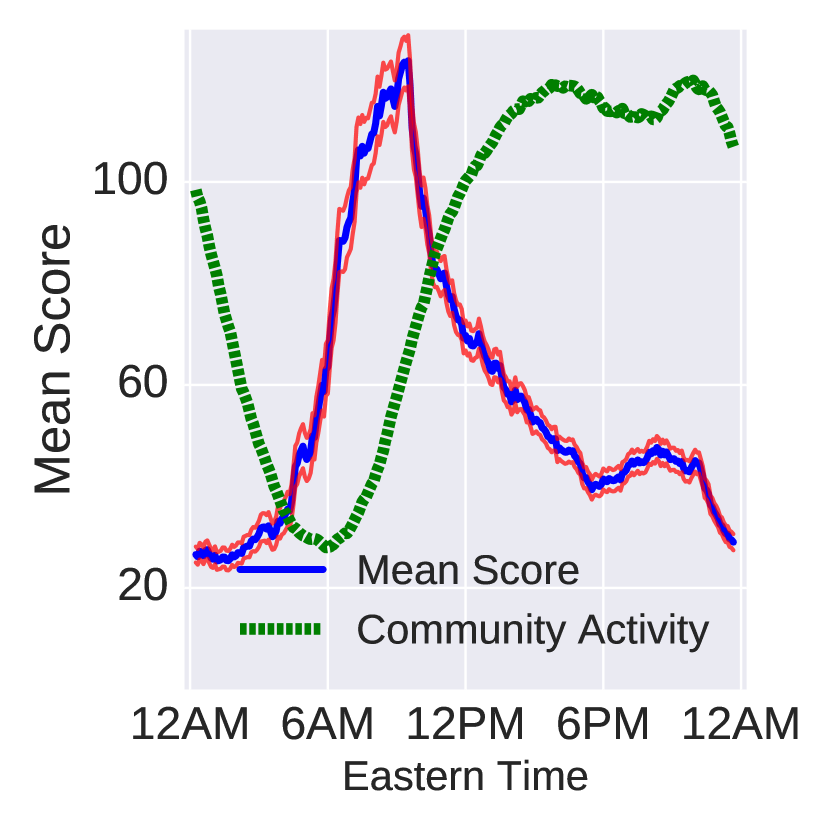
Raw post scores are influenced by timing factors in complex and difficult-to-measure ways. Reddit is a dynamic, evolving platform, so expected popularity of submissions varies across many time scales. In Figure 3, for example, we show the mean score of submissions made at various times during the day averaged over a sliding 30 minute window in aww. The figure also shows the average activity level of the community as measured by number of submissions. There is a dramatic spike in average submission score for posts submitted at 9AM when compared to posts submitted at 6AM or 12PM.
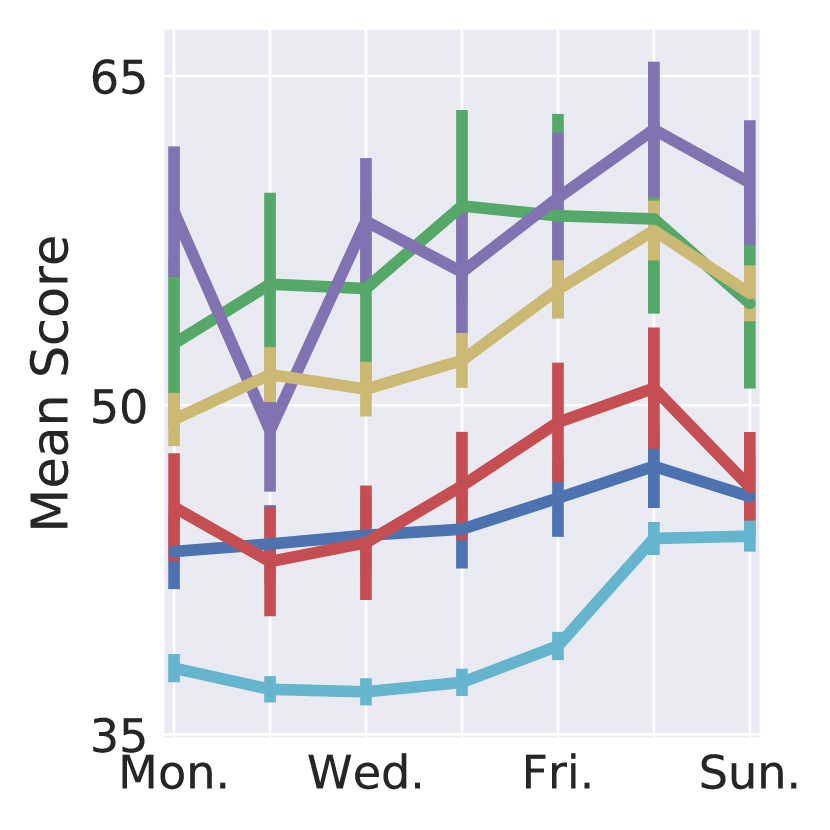
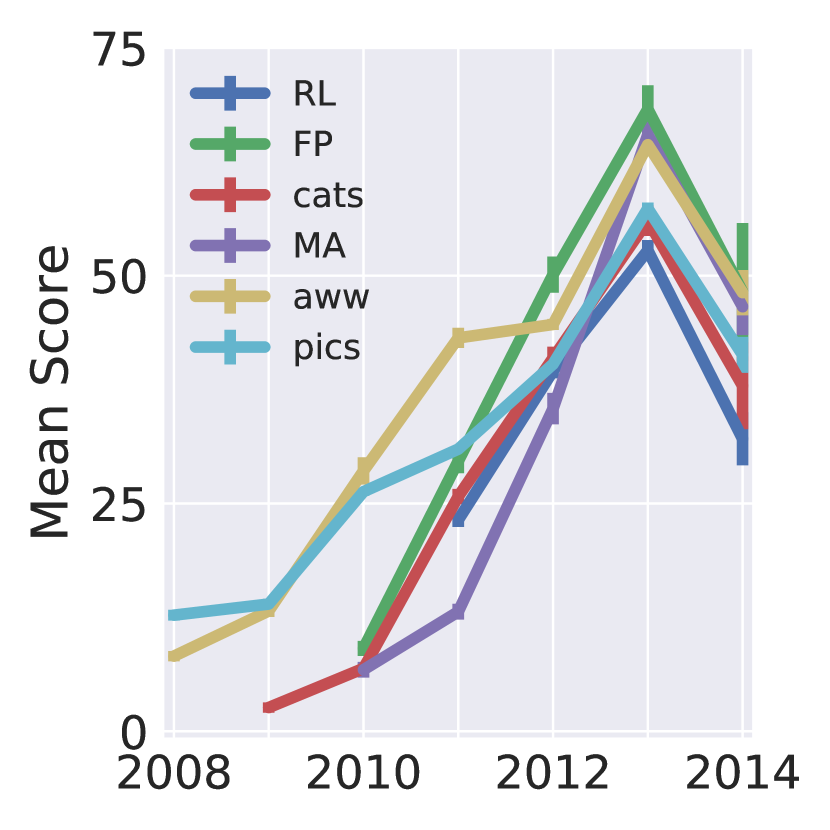
Expected popularity also varies periodically between days of the week. Figure 4(a) shows posts binned by day of the week. The average score of submissions to aww, pics, and cats seems to be greater on weekends when compared to weekdays. These patterns are not always easily modeled; the number of upvotes in MakeupAddiction falls sharply on Tuesdays, potentially as a result of the community’s “Text Tuesdays” tradition (when only text posts are allowed). We observed similar patterns in the other subreddits. Figure 4(b) illustrates binning by submission year. The average post score on Reddit seems to be increasing over time, but it is unclear whether this trend has continued in 2014, as vote totals might not have had the chance to stabilize at the time of scraping in early 2014.
Reddit communities more closely resemble time-sensitive “cultural markets” as described by Salganik et al. [52] than any of the three image-sharing settings described by Khosla et al. [37].
Mean Normalization.
Lakkaraju et al.’s \shortcitelakkaraju2013s work offers a starting point for designing a time-control mechanism. Their original goal was to control for popularity between subreddits, whereas we aim to control for time within a community.
We identified several problems when applying their time control method, which we call mean normalization (MN), to our setting. MN divides the score of a Reddit post by the average score of all posts surrounding it in an hour. Estimating a robust and accurate mean is difficult because of the dynamics of popularity. The submission distribution is skewed by rich-get-richer processes (for aww, average skew is 7.33, average kurtosis is 69.25), so average popularity as a statistic does not capture a fair notion of quality. Furthermore, submissions that are unlucky enough to posted within the same hour as a popular post are unfairly downweighted by the rich-get-richer process.
For some subreddits, a one hour time window is probably too big. Figure 3 suggests that one hour can encompass large changes in expected popularity in the fast-paced world of Reddit, e.g., the mean score for 6AM submissions is around , whereas the mean score for 7AM submissions is around .
Finally, in less popular communities, Lakkaraju et al. note that it is often difficult to get a stable estimate of the mean submission popularity within an hour. While their setting doesn’t require estimating this mean, ours does. In FoodPorn, for example, just 44% of all submissions have at least 5 in-window submissions () to take the mean over.
Raw Transformations on Reddit.
Raw post scores, even normalized for temporal effects, may be too noisy to learn accurate models. Self-reinforcing “rich get richer” dynamics in online interfaces result in complex, non-linear relationships between quality and popularity \shortcitesalganik2006experimental. Furthermore, recent work shows that these dynamics differ significantly from community to community; sometimes a small number of highly scored submissions is preferred, while in other cases, the scores are more evenly distributed [41]. The complexity of this relationship is compounded by website interface changes, ranking algorithm modifications,999In fact, between the time of submission and publication, Reddit did entirely change their method for computing post scores: goo.gl/zHcKzL and innumerable other subtle effects.
Transformations of raw votes are known to be more effective than highly-skewed raw values. Khosla et al. [37], for example, successfully use a log-transformation on Flickr view counts. In the case of Reddit, however, heuristic transformations like these enforce complex biases that are not consistent between different subreddits. Also, it is not clear how to extend these to a time-controlled setting, in general.
Our Approach: Pairwise Sampling.
Because only relative judgments need to be made, the comparison of submissions made in quick succession requires no assumptions about the skewness of the score distribution. We do not need to compute a stable estimate of average popularity, so sparse submission data can be handled. No ad-hoc transformation of raw scores is required, either. If the time difference between two posts is small we can train models using the assumption that posts start on roughly equal footing. We can then quantify the validity of those assumptions in terms of timing and user baselines, and directly compare cats and captions to creators and the clock.
While it would be ideal to design a pairing process that would control for other social effects, doing so would be substantially more difficult than accounting for time. For example, if we sample pairs of posts made by the same author in a short time window, we would lose—at the very minimum—the 75% of submissions made to pics by users who have deleted their accounts or who only submit a single time. Also, Reddit enforces a one-post-per-several-minutes submission rate on a majority of accounts, meaning our stringent time controls would need to be relaxed. We leave sophisticated user-identity controlling sampling procedures to future work, and focus on quantifying the performance of user features instead.
After scraping the images associated with each subreddit, our goal is to pair submissions to minimize differences in timing. The pairing process is controlled by several parameters. For each community we define a fixed, maximal allowed time-window so that pairs are not too far apart. We select pairs greedily to minimize this gap, so in practice the average time difference is smaller than the maximum window size. To mitigate the effects of noise, we force the score difference between members of a pair to be at least 20,101010A majority of experiments were also conducted with the minimum difference parameter set to four; results were similar to those presented here. and the eventually more popular submission must also be at least twice as popular as the other. Additionally, we ignore posts that received a score of less than two to avoid spam and other very low-quality submissions that received no upvotes.
Table 2 shows the maximum and average window sizes, along with the number of pairs that were sampled using a simple greedy algorithm. For aww and pics, the most popular communities we examine, sampled pairs are submitted 15 seconds apart on average.
| Max/Avg Win | Med/Avg Diff | # Pairs | |
|---|---|---|---|
| pics | 30/15 sec | 117/478 | 44K |
| aww | 30/15 sec | 90/393 | 33K |
| cats | 15/7 min | 69/231 | 15K |
| MA | 60/24 min | 88/227 | 10K |
| FP | 120/53 min | 62/188 | 8K |
| RL | 30/14 min | 56/118 | 9K |
| aww | pics | cats | MA | FP | RL | |
| Humans | 60.0 | 63.6 | 59.6 | 62.2 | 72.7 | 67.2 |
Human Validation.
We first consider the validity of this new task by conducting a small human study. Our goal with this study was to determine if the task of predicting relative engagement was even possible using these datasets, or whether there is no correlation between content and Reddit score. We asked annotators to predict which among two time-controlled submissions they thought would get more upvotes. For each of the six datasets we showed the same 20 pairs to annotators.111111Due to a sampling bug, pics pairs in the human experiments were sampled from 2009-2012 instead of 2009-2014. In total, we were able to gather 1400 human pairwise judgments. In addition, users were given the option of describing “why” they made the choice they did.
Annotators used a variety of techniques to make their decisions. Rationale ranged from basic aesthetic observations (“Much better photo;” submitted with a correct annotation. “Better photo;” correct annotation. “homemade + steak + picture resolution (so profesh);” correct annotation.) to comments about how unique images were (“Dude, it’s a cat with a pencil;” incorrect). Sometimes, the authors disqualified submissions based on the associated text, rather than on the images (“Less begging in the title;” incorrect.). Many annotators used their perception of the communities when making judgements (“The Internet loves meat;” correct. “Easy. Desserts always win;” correct.). Sometimes the annotators wished they were more familiar with the community, e.g., one user submitted an incorrect annotation, noting that “[they were not] sure whether FoodPorn is about the images or the food concept.” Some pairs were universally difficult. For example, 83% of annotators incorrectly selected a cute rabbit (“Dat bunny face;” +10 Reddit score) over an out-of-focus photo of a duck121212One redditor comments regarding the misfocused image: “That trashcan [in the background] is in excellent quality.” with the caption “My brother got a duck yesterday..” [sic] (+115 Reddit score).
The resulting mean accuracy for each dataset is presented in Table 3. In general, humans are able to guess pairwise rankings of submissions from images and captions, but the task is difficult.131313Because the human study only considered a small subset of image pairs, the exact values reported are less precise than for the other results: the 95% confidence intervals for the human annotations are on average Having validated that the task is neither trivial nor impossible for humans, we now move on to our machine learning experiments.
4 Model Design
For relative popularity prediction, we use a pairwise learning-to-rank model [27, 35, 11]. Specifically, our data is of the form where is a pair of Reddit submissions posted at similar times, and is an indicator variable that encodes which submission became more popular. We train a linear classifier on top of the vector difference of two entities for predicting which of the two is more highly ranked (i.e. ). As such, we experiment with models of the form
| (1) |
where is a set of regression weights and is one of a variety of Reddit submission representation functions. In all experiments, we use a hinge loss, which is minimized with respect to the coefficients of the regression itself and, if applicable, with respect to the trainable parameters of .
Note that our model implicitly learns a scoring function that can assign a quality score to unpaired examples. Specifically is a value that correlates with the model’s ranking of that submission.141414Rather than approximating the global raw Reddit score ranking, the model induces a ranking with desirable properties, e.g., it cannot be predicted from timing features. This function could be used by moderators to compute model scores of novel, incoming submissions. We use this function in a later section to interpret our results.
Cats and Captions
The textual and visual characteristics of the six communities we examine are complex and varied. For example, most images in RL are of fingernails, which are out of domain for pretrained computer vision models. Similarly, complex social patterns and tags emerge within language e.g., “CCW” meaning “constructive criticism welcome.” As a result, a dataset-by-dataset examination of specific, higher-level processes like image [38] or text [15] memorability transfer-learned from other domains is reserved for future work. The goal of this section is not to argue that these models are the best. Rather, we will use these generic feature extractors to demonstrate the importance of modeling content at all.
Image Models.
We experiment with a combination of lower-level features and deep neural network models to represent image content. This mix of models is similar to those explored by Khosla et al. \shortcitekhosla2014makes.
The most basic building blocks of the human visual system are edges and colors, and the presentation of these features might effect how appealing an image is. Previous work (e.g., [4]) has found that colors can play a role in human response to visual content. As such, we examine a set of color features Color, consisting of an normalized vector based on the RGB values of the colors in the image. We use Khan et al.’s \shortcitekhan2013discriminative 50 universal color descriptors and extraction code to compute this vector for each image.
The second feature set is histogram of oriented gradients [14]. HOG features capture localized pixel gradients in an image. We use the HOG feature extractor in OpenCV [9] with default parameters and use random projection to reduce the dimension of the resulting features to 2K from 34K.
Next, we examine the GIST image descriptors [47], which aim to capture “perceptual dimensions (naturalness, openness, roughness, expansion, ruggedness) that represent the dominant spatial structure of a scene.” We use the pyleargist151515bitbucket.org/ogrisel/pyleargist/ library to extract these 960 features.
Recently, convolutional neural networks have been used to extract high-level concepts from image data. We use the popular VGG-19 [56] and ResNet50 [26]. Both of these networks are used as feature extractors161616We found deeper residual networks and network fine-tuning to be unhelpful in early testing. by taking the final-layer activations from a set of weights trained for the ImageNet [17] ILSVRC-2014 classification task. Building a linear model over extracted features in this manner is known to offer an “astounding” baseline [55].
Text Models.
We first examine a set of Structural features of language. These include the message length (in tokens and characters), the token-to-type ratio, and a “punctuation proportion” feature to capture some signal about an author’s use of non-alpha-numeric characters (e.g., emoji).
We consider three models that do not use word order. The bag-of-words assumption is valuable both because of its relative simplicity and because of its high performance (see Hill et al. \shortcitehill2016learning for some benchmarks). First we define a set of Unigram features by mapping each caption to a vector of binary indicator variables. Second we extract topic distributions using a specialized biterm topic model [69] designed for short texts. We use 20 topics in all cases, and extract the resulting normalized Topic distributions. Third we use a variant171717We apply normalization after the averaging step, and don’t apply word-level dropout. of the deep averaging network (DAN) [33]. This model averages a set of word embeddings and feeds the result though a simple multilayer perceptron. We consider a 3-layer DAN with 128 hidden units. The model’s word embeddings are tuned from a 100D GloVe [48] pretrained set.
We also consider sequence-based features, specifically an order-sensitive recurrent neural network. We train an LSTM [30] on the sequence of words in a caption. The parameters of the RNN are learned, and the word embeddings are tuned from the same 100-dimensional starting vectors as the DAN. For completeness, we also consider a bidirectional LSTM, Bi-LSTM [24].
Creators and the Clock
User Features.
Can Reddit users get upvotes based on an attained status as on other social networks? An explicit and persistent user identity exists for some users on MakeupAddiction and RedditLaqueristas in the form of a flair that is displayed alongside a given user’s posts. Most often, the flair contains a link to a given user’s Instagram profile.
For other communities, however, a majority of users submit only a few times. Around 60% of submissions made to aww and cats, for example, are made by users who submit at most three times ever. Even if a celebrity status were earned and upvote counts were artificially inflated as a result, in these communities, this likely plays a lesser role.
Another hypothesis is that as a user gains familiarity with a community, they are better able to submit content of interest to that community. Indeed, a user who has a better sense of the types of content popular in a community might be more likely to submit high quality content than a newcomer.
Even though we cannot disentangle the effects of status and experience, we can still define features that capture aspects of a submitter’s previous behavior within a community. Such features have previously been used in studies on Reddit [2, 34] and Slashdot [40], among others.
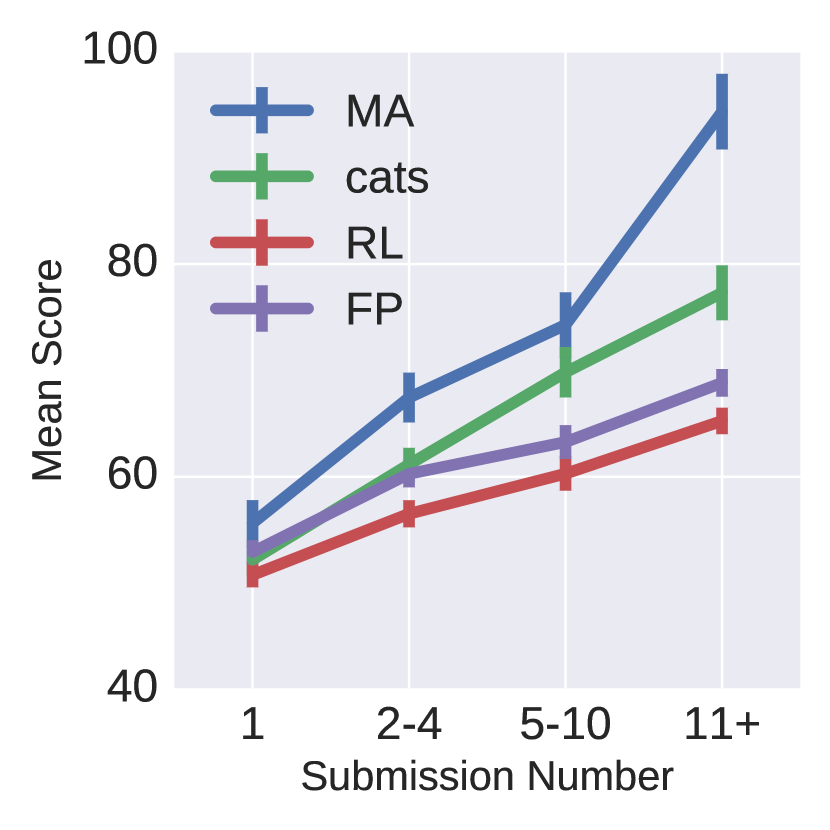
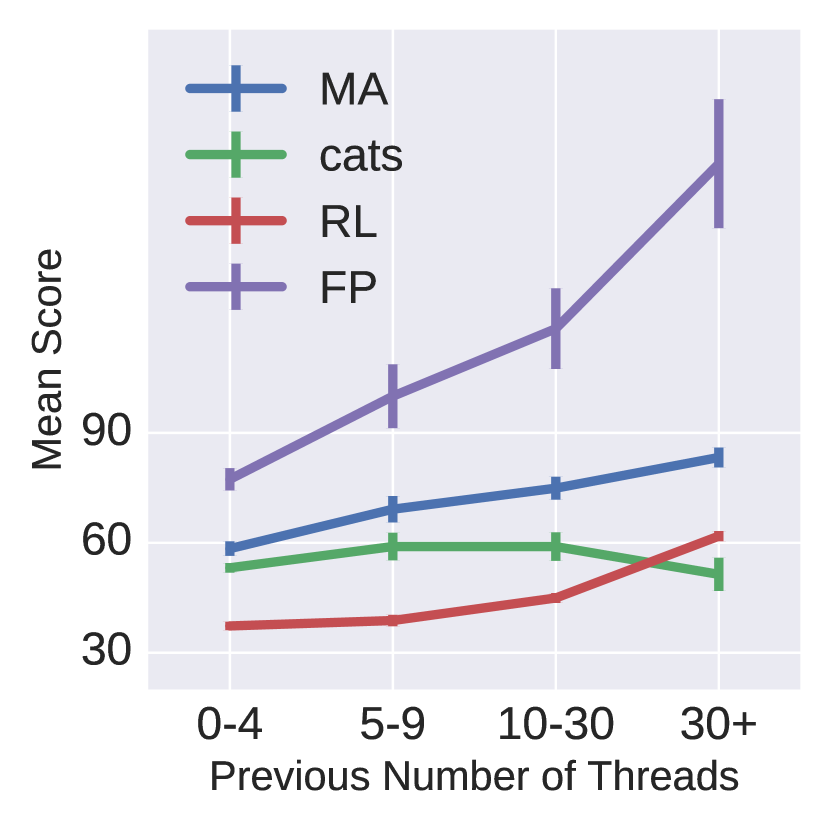
Two easily measured quantities are how many times a user has previously submitted and how many total threads a user has previously interacted with. Figure 5 and Figure 6 show that correlations exist between score and previous interactions. In redditLaqueristas, for example, if a submission is a user’s fifth to tenth, it is more likely to receive upvotes than if a submission is a user’s first. In cats, however, participating in more than 30 threads by commenting or posting seems to be associated with slightly lower average popularity.
The following set of user features are computed for each submitter at the time of their submission. When a statistic is not properly defined for a given user at a given time (e.g., average previous comment length when they have no previous comments; the submitter deleted their account, etc.) the mean value over the training set is substituted.181818We ran user experiments considering only pairs that consisted of no deleted users and no users without previous interaction data; the results were comparable.
Previous work (e.g., [19]) has found information regarding how much a user participates in a community to be a useful predictor of their future behavior. The Activity feature set includes the number of previous posts/comments, how long the user has been a member of the community, the time since previous interaction, and the ratio of posts to posts plus comments for that author.
It is possible that how a user interacts with others in a community is more important than how much they interact with a community.
The Type feature set includes average comment length, average comment token-to-type ratio, average conversation tree depth of comment, the proportion of previous comments with replies, the proportion of previous submissions wherein the user commented multiple times, and median time-to-response from thread start.
Several variables are used to quantify the community-perceived Quality of a submitter’s previous interactions. Instead of using statistics based on raw scores, which can be skewed by a small number of very popular interactions, we use Jaech et al.’s \shortcitejaech2015talking -index, which counts the number of times a user has submitted either a post or a comment that received more than upvotes. To normalize for a user’s total activity, we divide by the total number of posts/comments that user made to form a statistic we call -rate. We compute -rate for for both posts and comments. While the quality statistics might leak timing information, we would like the user baseline to be as strong as possible.
Timing Models.
In the pairwise ranking setting, a Random guess is correct half of the time. Furthermore, it is possible that the post that was created Earlier has a tendency to get more upvotes because it has existed longer, so choosing the submission in the pair that was posted first makes for a good baseline.
Finally, we include a Time baseline to quantify how well the pairing process controls for time. Instead of attempting to hand-design a set of rules, because the effects of time are complicated we choose to simply learn a time feature classifier. We use a 1-hot encoding of the minute-in-hour, hour-in-day, day-in-week, and year of the post. Instead of subtracting the resulting encodings, we concatenate to give the model access to the absolute and relative timing. The classifier we use is a one-hidden-layer neural network with 100 hidden units to capture potential non-linear relationships.
5 Results
For all experiments, we compute 15-fold cross validation accuracy in an 80/20 train/test split. We withhold 10% of training data as a validation set, which is used to optimize regularization parameters and for early stopping. Models are trained using Keras [13] with the Theano [64] backend.
5.1 Unimodal Experiments
| aww | pics | cats | MA | FP | RL | ||
| Timing | Random | 50.0 | 50.0 | 50.0 | 50.0 | 50.0 | 50.0 |
| Earlier | 51.7 | 51.1 | 49.9 | 48.9 | 48.6 | 48.7 | |
| Time | 50.2 | 50.2 | 50.7 | 50.4 | 49.7 | 50.6 | |
| User | Type | 50.6 | 51.2 | 50.7 | 52.8 | 51.8 | 56.1 |
| Activity | 51.1 | 53.6 | 52.8 | 55.0 | 53.9 | 60.6 | |
| Quality | 54.7 | 55.5 | 52.9 | 60.7 | 55.5 | 67.3 | |
| Textual | Struct | 56.2 | 54.8 | 56.5 | 50.9 | 52.3 | 52.5 |
| Topic | 55.2 | 55.8 | 56.8 | 60.4 | 55.2 | 55.5 | |
| DAN | 58.6 | 58.3 | 58.5 | 62.2 | 57.6 | 59.8 | |
| LSTM | 59.4 | 58.8 | 58.7 | 61.0 | 57.0 | 59.1 | |
| Bi-LSTM | 59.7 | 58.9 | 59.3 | 61.8 | 57.8 | 59.6 | |
| Unigram | 59.7 | 58.6 | 59.5 | 63.0 | 57.6 | 60.8 | |
| Visual | HOG | 51.7 | 52.8 | 51.9 | 53.5 | 53.5 | 53.5 |
| GIST | 52.7 | 53.0 | 53.5 | 55.9 | 56.5 | 56.3 | |
| ColorHist | 55.3 | 53.7 | 55.6 | 55.0 | 56.5 | 54.5 | |
| VGG-19 | 63.4 | 58.9 | 61.1 | 62.4 | 62.8 | 62.1 | |
| ResNet50 | 64.8 | 60.0 | 62.6 | 64.9 | 65.2 | 64.2 |
Next we assess the individual ability of each modality to predict the eventual popularity of content. The results for each dataset and feature set are given in Table 4. Because the classification problem is a balanced two class task, we only report accuracy.
Pairwise Ranking Controls for Time.
Our objective in using pairwise ranking is to reduce the effect of time-of-posting as a confounding factor. As shown in Section 3, time-based features are, in general, strongly predictive of average user engagement. But in the pairwise ranking setting, we were happy to see that neither the learned time classifier nor the “earlier” baseline were able to achieve meaningful performance above random. This suggests that we are effectively controlling for time of posting.
Previous Quality Predicts Current Quality.
Among user features, quality of previous submitted content is the best predictor of future success. The particular types of interactions (e.g., posts vs. comments, comment length) also seem to be less important than the absolute volume of previous interactions.
For Words, Simpler is Better.
Order-sensitive and deeper models models rarely outperformed the shallower, order-unaware unigram models. Interestingly, structural features performed particularly well on cats and aww; we observed that longer, story-like titles worked well in both of those communities. For all datasets, the best text-only models performed worse than the best image-only models, suggesting that visual content is more predictive of relative popularity than textual content in these communities.
For Images, More Complicated is Better.
For all datasets, the best performing image algorithm was the deep neural network ResNet50. The fact that ResNet50 outperformed its shallower counterpart VGG-19 suggests that this task is well-formulated as a computer vision task. In general, the CNN approaches performed better than the lower-level image features, though all outperformed random.
5.2 Multimodal Experiments
| aww | pics | cats | MA | FP | RL | |
|---|---|---|---|---|---|---|
| Time + User | 54.1 | 54.7 | 52.1 | 58.8 | 54.2 | 64.8 |
| All User | 56.3 | 55.3 | 54.6 | 60.9 | 56.0 | 68.4 |
| ResNet50 | 64.8 | 60.0 | 62.6 | 64.9 | 65.2 | 64.2 |
| Text + Image | 67.1 | 62.7 | 65.9 | 67.7 | 65.8 | 66.4 |
We now directly compare “cats and captions” to “creators and the clock.” In particular, given the high performance of unigram and ResNet50 features, we use Lynch et al.’s [43] elastic net regression method to jointly represent visual and textual content, and call the model Text + Image. Because timing features weren’t found to be helpful when concatenated with user features (Time + User), we also include a concatenation of all user features, All User. These results are presented in Table 5.
In five of six cases, content features outperform the user features for relative popularity prediction. In terms of relative improvement over random, the magnitude of this improvement is between 245% for cats and 62% for MakeupAddiction. In five of six cases performance significantly improves when we combine text and images, indicating that this task is well-formulated as a multimodal task. In these cases, the relative improvement over random when adding text to the best image model varies between 27% for pics and 16% for aww.
| aww | pics | cats | MA | FP | RL | |
|---|---|---|---|---|---|---|
| Time + User | 55.5 | 51.7 | 52.6 | 56.9 | 52.8 | 60.5 |
| All User | 60.4 | 51.0 | 54.3 | 63.1 | 57.9 | 66.0 |
| Text + Image | 65.5 | 66.0 | 67.3 | 62.7 | 62.6 | 65.4 |
Fully-held Out, Different Distribution Test.
One useful property of the models we consider is the unpaired scoring function implicitly learned in the ranking process. While this scoring function could be used to process novel submissions made to a community, it’s unclear how well patterns learned across training data would generalize to testing data. Changing linguistic [16] and visual [67] preferences of communities complicate this task considerably.
We selected 1000 pairs from each community sampled outside of the training data’s time span, and therefore out of the exact distribution of the training data. These pairs were fully held out meaning that we evaluated them exactly once for each model. The accuracy of the content model and the user/timing model in the fully-held-out settings are given in Table 6.
While it is difficult to extrapolate from point estimates, the fully-held out results display interesting changes in performance. In particular, while differences in performance are relatively minor (indicating that we likely didn’t overfit) we see a roughly 28% decrease in performance in MakeupAddiction. We find some evidence suggesting that the community has evolved during the 10 month heldout period. In particular, for the image + text models, the average posting time of the correctly-classified pairs is 11 days earlier (and closer in time to the training data) than the average posting time of incorrectly-classified pairs. Because only 1K held-out pairs are considered, the statistical significance of this potential difference cannot be established for all models. However, this pattern was observed across several models we considered. Collectively, these observations suggest a potentially complex relationship between training set generalizability and time.
Model Score vs. Raw Score.
Using traditional ranking metrics in this pairwise setting is difficult because, as we have argued above, there is no appropriate “gold standard” ranking to compare against. The scores received on Reddit would indeed provide a ranking, but not an appropriate ranking, because those scores are biased by precisely factors like timing we have discussed and constructed our pairwise task to mitigate. As a result, applying evaluation metrics like mean reciprocal rank (MRR) or precision-at-K (p@K) that assume a ground-truth ranking is not possible.
Found this 3 day old baby under a car in…
This is Dexter. A year 1/2 ago my friend…
My very first dog and best friend is…
This sweet girl was found on the side of…
Found this little guy getting rocks…
Every time we start the boat…
Henry is quite the lady killer
Reddit, meet Sutton! My new kitty baby!
Cloudy forgets to close his mouth…
First post! My begging English Mastiff.
Soft kitty, warm kitty, little ball of…
My sleepy kitty enjoying the sun
Happy kitty, sleepy kitty and man she…
Shih Tzu + Beagle = Adorable
GO! GO! GO! GO! GO! GO! GO!…
![[Uncaptioned image]](/html/1703.01725/assets/7.jpeg) & We were taking a family photo but our dog kept scratching on our legs trying to be in our photo. We…
& We were taking a family photo but our dog kept scratching on our legs trying to be in our photo. We…
![[Uncaptioned image]](/html/1703.01725/assets/6676.jpeg) Walter is ready for dinner.
Walter is ready for dinner.
![[Uncaptioned image]](/html/1703.01725/assets/13351.jpeg) When Hamish fits, he sits.
When Hamish fits, he sits.
However, we understand that readers may still be curious to know whether the ranking induced by our method has any correlation with the scores that appear on Reddit, since other work (e.g., Khosla et al. [37], who worked with a Flickr dataset) computes similar correlations. To satisfy the curious reader, we did go ahead and compare the Spearman correlation between raw popularity and our model’s scores. For the text + image models, the observed values averaged over cross-validation splits range between for pics and for MakeupAddiction. In general, the correlations we observe are somewhat lower than those of Khosla et al.’s [37] image-based model; whether the differences are due to the models or to the different domains is an open question.
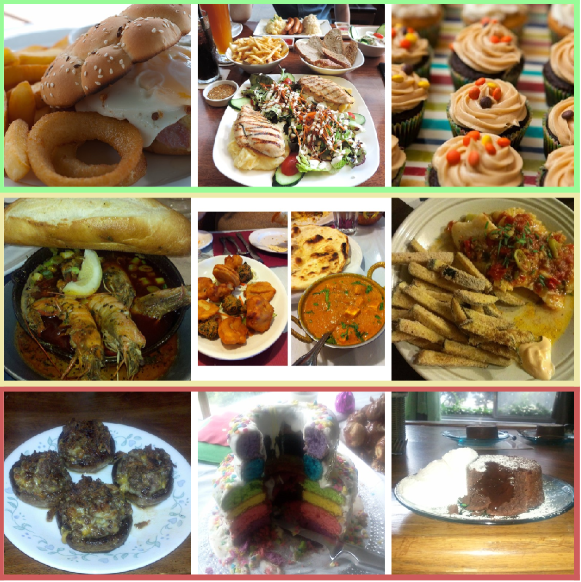
6 Analysis of aww
We now qualitatively analyze the models’ performance on aww, though a similar analysis could be performed on any community (e.g., Figure 8 shows image examples from FoodPorn). Figure 9 shows several test examples scored by the image-only, text-only, and multimodal models from one of the aww cross-validation splits.
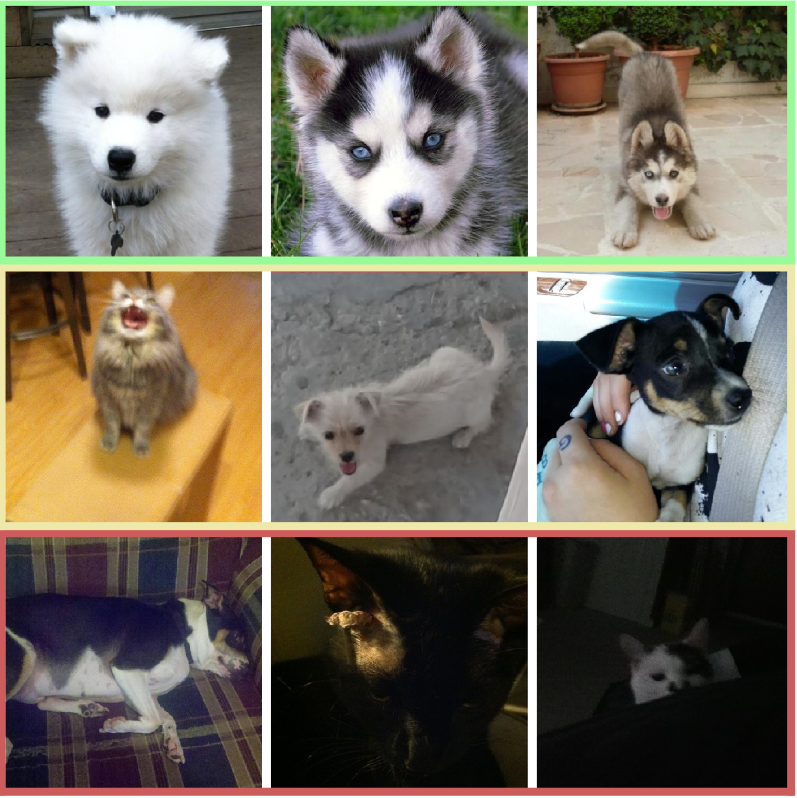
Figure 9(a), which displays good, okay, and bad images as scored by ResNet50, illustrates that lighting is important. The model tends to assign lower scores in cases where an animal’s face isn’t visible. Having the animal taking up a majority of the image also seems to be important, though this could be an artifact of our resizing procedure. Also, we noticed that a disproportionate number of highly scored images were of dogs; among the cross-validation split we considered, in fact, the top ten images were all dogs. The model, and potentially the community, might be favoring particular types of animals.
To examine this possibility, we turn our focus to more interpretable object detections. Specifically, we turn to the canonical 1K ImageNet classes, which consist of a surprisingly high number of types of animals, e.g., 120/1000 classes are different types of dogs. As such, these classes are well-suited to analyzing aww. We extracted the pre-softmax input for each ImageNet class according to ResNet50 for each image 191919Weights after the softmax transformation also produced some significant results, but the pre-softmax weights are known to contain more fine-grained information [10] These features are the un-normalized log probabilities for each of the 1K ImageNet classes. For each of the 15 cross-validation splits, we computed the average Pearson correlation between our model’s score and the object detection features.
After applying Bonferroni-correction to our confidence intervals to account for the fact that there are 1K possible correlations, we observed many significant results. Among the 250 most common detections, the object-like features most correlated with success were “golden retriever,” “dingo,” and “labrador retriever” ( .23, .21, .19, respectively, that there is a true correlation). There were also dog breed features associated with failure, including “miniature schnauzer,” “maltese dog,” and “affenpinscher” ( -.23, -.21, -.21, ). Interestingly, non-bulldog terriers fared poorly; all 15 were negatively correlated with model score, though only 12/15 were significantly so. In contrast, 5/5 retriever classes were significantly correlated with higher scores. For cats, “cheetah” and “lion” features positively correlated () while “tabby,” “egyptian cat,” and “persian cat” features were all negatively correlated ( -.1, -.11, -.17).
The story with text on aww is a simpler; Figure 9(b) shows that longer captions generally do better, and it also helps to have a story. Unigrams like saved ( = .50), wife ( = .43), roommate ( = .42), and cancer (), and are among the most predictive of success. Interestingly, sleeping animals seem to be predictive of failure, with unigrams like sleepy ( =-.58), sleeping (=-.47), laying (=-.47), and nap (=-.43) being among the most predictive of failure.
When image and text features are combined, performance improves over each by themselves, which suggests that the patterns discussed contain information orthogonal for predictive purposes. Because we simply concatenate image and text features rather than modeling interactions directly, the multimodal patterns likely mirror the unimodal patterns discussed here.
7 Additional Related Work
Content has been used to predict popularity in the past. Language [49, 31, 25, 7, 15, 3, 61, 63, 65], images [37, 18, 67], video [54, 20, 50], or a combination of multiple modalities [68, 46, 22, 32, 12] have been used for this task. Some previous work has controlled for, rather than modeled, multimodal content [8, 39]. Our work builds upon previous studies that attempt to predict or analyze crowd-level preferences [37, 21, 5, 4, 59, 53, 18, 45, 1, 70], as opposed to user-level preferences [71]. After submission, we discovered a blog post by Glenski and Stoddard202020https://goo.gl/9M6Ioh describing human experiments similar to ours. While the setting we examine is different (e.g., we apply more stringent time controls), it was interesting to see that their human trial results were similar to ours.
Noisy Rich-get-richer Processes.
Timing [8, 39], and even early random positive or negative treatments [66] can affect the popularity of social media content. Salganik et al. \shortcitesalganik2006experimental show that while content does matter to an extent, presenting different orderings of songs to users results in wildly different most and least popular music. These effects likely underpin the widespread underprovision on Reddit [23], which causes “Reddit [to overlook] 52% of the most popular links the first time they were submitted.” Undoubtedly, content can never perfectly predict community response.
Social Features for Eventual Popularity.
Social connections [42] and author identity [60] also effect the popularity of content. Solomon and Herman \shortcitesolomon1977status demonstrate that individuals with higher status are more likely to be recipients of prosocial behavior. In our case, this could mean higher status individuals in a community receive upvotes as a result of their celebrity status. Khosla et al. [37] consider a simple set of social features of their Flickr dataset, and find that social features are significantly more predictive of popularity than image features when not controlling for user identity.
8 Conclusion and Future Work
In this work, we motivated the task of relative popularity prediction as a means of controlling for time. We also demonstrated that incorporating multimodal features generally resulted in improved performance. Future work in modeling could consider more sophisticated models of textual and visual interaction. Also, it would be interesting to investigate visual trends within communities over time. Designing a model to identify “timely” or trend-setting image features is a promising avenue for future work.
Popularity prediction, too, is only one social factor of interest to moderators of multimodal communities. The text of comments, for example, offers a more fine-grained measure of community response than upvotes. Text features like sentiment could also be predicted from content in a similar time-controlled setting.
While we’ve provided evidence that there exist online communities wherein visual and textual content predict popularity more successfully than social features, it is important to point out the results presented here might not generalize to other communities, e.g., ones off of Reddit. We suspect that social connections are less salient on Reddit, which seems more centered on the content. Instagram, for example, is a social network based on image content wherein identity likely matters more. However, even on Reddit itself, we observed a case in RedditLaqueristas where our intuitions proved to be incorrect: celebrity-status/social features were more predictive than content in that subreddit.
Another caveat: while sampling pairs of posts made in quick succession provided good timing/ordering controls for us, in other settings there might not be enough posts to warrant such a sampling technique.
In the end, predicting what becomes popular in any given community requires accounting for timing, content, identity, social structure, and self-reinforcing rich-get-richer processes. While the relative predictive power of each varies on a case-by-case basis, we hope the results presented here encourage practitioners to investigate content-driven models in the face of complex confounding factors.
Acknowledgments.
This material is based upon work supported by the National Science Foundation under grant no. IIS-1526155 and a Yahoo Faculty Research and Engagement Program grant. We would like to thank Nvidia for the Titan X GPUs used in this study, and Vlad Niculae for providing the website template used in the human study. We also thank Yoav Artzi, Claire Cardie, Yiqing Hua, Vlad Niculae, Tianze Shi, and the anonymous reviews for their helpful, detailed feedback. We thank all members the Cornell NLP seminar for their helpful comments. We thank B. Adler, J. Bass, A. Callahan, G. Correa, E. Danko, M. Feldman, D. Foster, M. Grusky, S. Helman, D. Hessel, T. Hessel, A. Hirsch, L. James, V. Kern, E. Krichilsky, M. Magnusson, K. Mast, G. Pleiss, H. Rishi, L. Rosen, R. Rotabi, A. Schofield, T. Shi, A. Singh, A. Smith, A. Suhr, W. Thomason, L. Thompson, M. Zeich, and J. Zhang for participating in the human study.
References
- [1] K. Almgren, J. Lee, and M. Kim. Predicting the future popularity of images on social networks. In MISNC, 2016.
- [2] T. Althoff, C. Danescu-Niculescu-Mizil, and D. Jurafsky. How to ask for a favor: A case study on the success of altruistic requests. In ICWSM, 2014.
- [3] Y. Artzi, P. Pantel, and M. Gamon. Predicting responses to microblog posts. In NAACL, 2012.
- [4] S. Bakhshi and E. Gilbert. Red, purple and pink: The colors of diffusion on Pinterest. PloS One, 2015.
- [5] S. Bakhshi, D. A. Shamma, and E. Gilbert. Faces engage us: Photos with faces attract more likes and comments on instagram. In CHI, 2014.
- [6] E. Bakshy, J. M. Hofman, W. A. Mason, and D. J. Watts. Everyone’s an influencer: Quantifying influence on twitter. In WSDM, 2011.
- [7] R. Bandari, S. Asur, and B. A. Huberman. The pulse of news in social media: Forecasting popularity. In ICWSM, 2012.
- [8] Y. Borghol, S. Ardon, N. Carlsson, D. Eager, and A. Mahanti. The untold story of the clones: Content-agnostic factors that impact YouTube video popularity. In KDD, 2012.
- [9] G. Bradski. OpenCV library. Dr. Dobb’s Journal of Software Tools, 2000.
- [10] C. Buciluǎ, R. Caruana, and A. Niculescu-Mizil. Model compression. In KDD, pages 535–541. ACM, 2006.
- [11] C. Burges, T. Shaked, E. Renshaw, A. Lazier, M. Deeds, N. Hamilton, and G. Hullender. Learning to rank using gradient descent. In ICML, 2005.
- [12] J. Chen. Multi-modal learning: Study on a large-scale micro-video data collection. In ACM Multimedia, 2016.
- [13] F. Chollet. Keras. https://github.com/fchollet/keras, 2015.
- [14] N. Dalal and B. Triggs. Histograms of oriented gradients for human detection. In CVPR, 2005.
- [15] C. Danescu-Niculescu-Mizil, J. Cheng, J. Kleinberg, and L. Lee. You had me at hello: How phrasing affects memorability. In ACL, 2012.
- [16] C. Danescu-Niculescu-Mizil, R. West, D. Jurafsky, J. Leskovec, and C. Potts. No country for old members: User lifecycle and linguistic change in online communities. In WWW, 2013.
- [17] J. Deng, W. Dong, R. Socher, L.-J. Li, K. Li, and L. Fei-Fei. Imagenet: A large-scale hierarchical image database. In CVPR, 2009.
- [18] A. Deza and D. Parikh. Understanding image virality. In CVPR, 2015.
- [19] G. Dror, D. Pelleg, O. Rokhlenko, and I. Szpektor. Churn prediction in new users of yahoo! answers. In WWW, 2012.
- [20] F. Figueiredo. On the prediction of popularity of trends and hits for user generated videos. In WSDM, 2013.
- [21] F. Figueiredo, J. M. Almeida, F. Benevenuto, and K. P. Gummadi. Does content determine information popularity in social media?: A case study of YouTube videos’ content and their popularity. In CHI, pages 979–982. ACM, 2014.
- [22] F. Gelli, T. Uricchio, M. Bertini, A. Del Bimbo, and S.-F. Chang. Image popularity prediction in social media using sentiment and context features. In ACM Multimedia, 2015.
- [23] E. Gilbert. Widespread underprovision on Reddit. In CSCW, 2013.
- [24] A. Graves and J. Schmidhuber. Framewise phoneme classification with bidirectional LSTM and other neural network architectures. Neural Networks, 2005.
- [25] M. Guerini, C. Strapparava, and G. Özbal. Exploring text virality in social networks. In ICWSM, 2011.
- [26] K. He, X. Zhang, S. Ren, and J. Sun. Deep residual learning for image recognition. In CVPR, 2016.
- [27] R. Herbrich, T. Graepel, and K. Obermayer. Large margin rank boundaries for ordinal regression. In NIPS, 1999.
- [28] J. Hessel, C. Tan, and L. Lee. Science, AskScience, and BadScience: On the coexistence of highly related communities. In ICWSM, 2016.
- [29] F. Hill, K. Cho, and A. Korhonen. Learning distributed representations of sentences from unlabelled data. In NAACL, 2016.
- [30] S. Hochreiter and J. Schmidhuber. Long short-term memory. Neural computation, 9(8), 1997.
- [31] L. Hong, O. Dan, and B. D. Davison. Predicting popular messages in Twitter. In WWW companion volume, 2011.
- [32] J. Hu, T. Yamasaki, and K. Aizawa. Multimodal learning for image popularity prediction on social media. In Consumer Electronics-Taiwan, 2016.
- [33] M. Iyyer, V. Manjunatha, J. Boyd-Graber, and H. Daumé III. Deep unordered composition rivals syntactic methods for text classification. In ACL, 2015.
- [34] A. Jaech, V. Zayats, H. Fang, M. Ostendorf, and H. Hajishirzi. Talking to the crowd: What do people react to in online discussions? In EMNLP, 2015.
- [35] T. Joachims. Optimizing search engines using clickthrough data. In KDD, 2002.
- [36] R. Khan, J. Van de Weijer, F. Shahbaz Khan, D. Muselet, C. Ducottet, and C. Barat. Discriminative color descriptors. In CVPR, 2013.
- [37] A. Khosla, A. Das Sarma, and R. Hamid. What makes an image popular? In WWW, 2014.
- [38] A. Khosla, J. Xiao, A. Torralba, and A. Oliva. Memorability of image regions. In NIPS, 2012.
- [39] H. Lakkaraju, J. J. McAuley, and J. Leskovec. What’s in a name? understanding the interplay between titles, content, and communities in social media. In ICWSM, 2013.
- [40] C. Lampe and P. Resnick. Slash (dot) and burn: distributed moderation in a large online conversation space. In CHI, 2004.
- [41] M. Lee, S. H. Jin, and D. Mimno. Beyond exchangeability: The Chinese voting process. In NIPS, 2016.
- [42] K. Lerman and T. Hogg. Using a model of social dynamics to predict popularity of news. In WWW, 2010.
- [43] C. Lynch, K. Aryafar, and J. Attenberg. Images don’t lie: Transferring deep visual semantic features to large-scale multimodal learning to rank. In KDD, 2016.
- [44] Z. Ma, A. Sun, and G. Cong. Will this #hashtag be popular tomorrow? In SIGIR, 2012.
- [45] M. Mazloom, R. Rietveld, S. Rudinac, M. Worring, and W. van Dolen. Multimodal popularity prediction of brand-related social media posts. In ACM Multimedia, 2016.
- [46] P. J. McParlane, Y. Moshfeghi, and J. M. Jose. Nobody comes here anymore, it’s too crowded; Predicting image popularity on Flickr. In Multimedia Retrieval, 2014.
- [47] A. Oliva and A. Torralba. Modeling the shape of the scene: A holistic representation of the spatial envelope. IJCV, 2001.
- [48] J. Pennington, R. Socher, and C. D. Manning. GloVe: Global vectors for word representation. In EMNLP, 2014.
- [49] S. Petrovic, M. Osborne, and V. Lavrenko. RT to win! Predicting message propagation in Twitter. In ICWSM, 2011.
- [50] H. Pinto, J. M. Almeida, and M. A. Gonçalves. Using early view patterns to predict the popularity of YouTube videos. In WSDM, 2013.
- [51] D. M. Romero, C. Tan, and J. Ugander. On the interplay between social and topical structure. In ICWSM, 2013.
- [52] M. J. Salganik, P. S. Dodds, and D. J. Watts. Experimental study of inequality and unpredictability in an artificial cultural market. Science, 2006.
- [53] R. Schifanella, M. Redi, and L. Aiello. An image is worth more than a thousand favorites: Surfacing the hidden beauty of Flickr pictures. In ICWSM, 2015.
- [54] D. A. Shamma, J. Yew, L. Kennedy, and E. F. Churchill. Viral actions: Predicting video view counts using synchronous sharing behaviors. In ICWSM, 2011.
- [55] A. Sharif Razavian, H. Azizpour, J. Sullivan, and S. Carlsson. CNN features off-the-shelf: An astounding baseline for recognition. In CVPR workshops, 2014.
- [56] K. Simonyan and A. Zisserman. Very deep convolutional networks for large-scale image recognition. In ICLR, 2014.
- [57] P. Singer, F. Flöck, C. Meinhart, E. Zeitfogel, and M. Strohmaier. Evolution of Reddit: From the front page of the internet to a self-referential community? In WWW, 2014.
- [58] H. Solomon and L. Herman. Status symbols and prosocial behavior: The effect of the victim’s car on helping. The Journal of Psychology, 97(2), 1977.
- [59] G. Stoddard. Popularity dynamics and intrinsic quality in reddit and hacker news. In ICWSM, 2015.
- [60] B. Suh, L. Hong, P. Pirolli, and E. H. Chi. Want to be retweeted? Large scale analytics on factors impacting retweet in Twitter network. In SocialCom, 2010.
- [61] T. Sun, M. Zhang, and Q. Mei. Unexpected relevance: An empirical study of serendipity in retweets. In ICWSM, 2013.
- [62] C. Tan and L. Lee. All who wander: On the prevalence and characteristics of multi-community engagement. In WWW, 2015.
- [63] C. Tan, L. Lee, and B. Pang. The effect of wording on message propagation: Topic-and author-controlled natural experiments on Twitter. In ACL, 2014.
- [64] Theano Development Team. Theano: A Python framework for fast computation of mathematical expressions. arXiv e-prints, abs/1605.02688, May 2016.
- [65] O. Tsur and A. Rappoport. What’s in a hashtag?: Content based prediction of the spread of ideas in microblogging communities. In WSDM, 2012.
- [66] T. Weninger, T. J. Johnston, and M. Glenski. Random voting effects in social-digital spaces: A case study of Reddit post submissions. In Hypertext, 2015.
- [67] B. Wu, W.-H. Cheng, Y. Zhang, and T. Mei. Time matters: Multi-scale temporalization of social media popularity. In ACM Multimedia, 2016.
- [68] K. Yamaguchi, T. L. Berg, and L. E. Ortiz. Chic or social: Visual popularity analysis in online fashion networks. In ACM Multimedia, 2014.
- [69] X. Yan, J. Guo, Y. Lan, and X. Cheng. A biterm topic model for short texts. In WWW, 2013.
- [70] S. Zakrewsky, K. Aryafar, and A. Shokoufandeh. Item popularity prediction in e-commerce using image quality feature vectors. arXiv preprint arXiv:1605.03663, 2016.
- [71] C. Zhong, D. Karamshuk, and N. Sastry. Predicting Pinterest: Automating a distributed human computation. In WWW, 2015.