New ALMA constraints on the star-forming ISM at low metallicity: A 50 pc view of the blue compact dwarf galaxy SBS 0335052
Abstract
Properties of the cold interstellar medium of low-metallicity galaxies are not well-known due to the faintness and extremely small scale on which emission is expected. We present deep ALMA band 6 (230 GHz) observations of the nearby, low-metallicity () blue compact dwarf galaxy SBS 0335052 at an unprecedented resolution of 0.2 arcsec (52 pc). The 12CO =21 line is not detected and we report a 3- upper limit of K km s-1 pc2. Assuming that molecular gas is converted into stars with a given depletion time, ranging from 0.02 to 2 Gyr, we find lower limits on the CO-to-H2 conversion factor in the range M⊙ pc-2 (K km s-1)-1. The continuum emission is detected and resolved over the two main super star clusters. Re-analysis of the IR-radio spectral energy distribution suggests that the mm-fluxes are not only free-free emission but are most likely also associated with a cold dust component coincident with the position of the brightest cluster. With standard dust properties, we estimate its mass to be as large as M⊙. Both line and continuum results suggest the presence of a large cold gas reservoir unseen in CO even with ALMA.
keywords:
galaxies: dwarf – galaxies: star formation – galaxies: individual: SBS 0335052 – submillimeter: ISM1 Introduction
Star-formation conditions in low-metallicity environments are not well known due to the lack of observational constraints on the cold dust and gas. Recent efforts with ground-based telescopes have tried to detect the cold gas reservoirs through carbon monoxide (CO) in nearby low-metallicity galaxies (e.g., Schruba et al., 2012; Elmegreen et al., 2013; Cormier et al., 2014; Hunt et al., 2015; Rubio et al., 2016). CO emission is found to be weak in those galaxies while active, bursty star formation is often evident. This would imply significantly different star-formation efficiencies unless CO no longer traces the bulk of the star-forming gas. Star formation taking place in the atomic gas (e.g., Glover & Clark, 2012; Krumholz, 2012) as well as changes in the standard CO-to-H2 conversion factor between high- and low-metallicity galaxies have been suggested (see the review by Bolatto et al., 2013) though the amplitude of those changes is unknown. A complementary probe of the ISM in galaxies comes from the continuum emission. Recent, sensitive observations in the far-IR/millimeter (mm) with Herschel (Pilbratt et al., 2010) have allowed us to constrain the spectral energy distributions (SEDs) of many nearby low-metallicity dwarf galaxies and to derive more robust dust masses (e.g., Rémy-Ruyer et al., 2015). However, most galaxies with metallicities 1/5 remain undetected in the submm/mm regime, implying that characterizations of a possible cold (<20 K), massive dust reservoir are still uncertain. In an effort to characterize the very low-metallicity regime, we present new ALMA observations of the dwarf galaxy SBS 0335052.

1.1 General properties of SBS 0335052
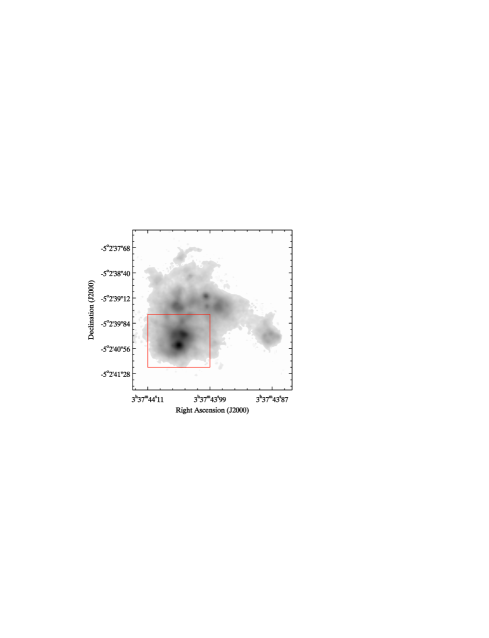
Among nearby low-metallicity galaxies, the blue compact dwarf SBS 0335052 at 54 Mpc is one of the best laboratories to study vigorous star formation in quasi-pristine conditions. It is composed of a main body (Fig. 1) that we refer to as SBS 0335052. Its general properties are listed in Table 1. SBS 0335052 is well known as one of the lowest metallicity galaxies of the nearby Universe, with (Izotov et al., 2009), and exhibits exceptionally active star formation, with a total star-formation rate (SFR) of 0.7 M☉ yr-1 (Rémy-Ruyer et al., 2015) and as high as 20 M☉ yr-1 kpc-2 (Johnson et al., 2009). Star formation in SBS 0335052 is located in 6 compact (60 pc) super star clusters (SSCs; Thuan et al. 1997). The bulk of its stellar population has an age of less than 500 Myr. The two brightest SSCs, located to the south (S1 and S2 on Fig. 1), are the youngest, with ages 3 Myr and stellar masses of M⊙ (Reines et al., 2008) each.
ISO and Spitzer observations reveal strong mid-IR continuum from warm dust, no polycyclic aromatic hydrocarbons, and hard radiation fields (e.g., Thuan et al., 1999; Wu et al., 2006). While optical studies measure an average visual extinction of 0.7 mag (e.g., Izotov et al., 1997; Vanzi et al., 2000; Reines et al., 2008), with values similar in S1 and S2, dust modeling of the unresolved IR emission yields 10 mag (e.g., Thuan et al., 1999; Hunt et al., 2005). This discrepancy suggests the presence of a separate component with high IR optical depth and probably hidden star formation. Although this galaxy remains undetected in CO (Dale et al., 2001; Hunt et al., 2014), warm molecular gas is present, since near-IR H2 lines are detected in the southern clusters (e.g., Vanzi et al., 2000).
In this letter, we present new ALMA band 6 observations of SBS 0335052 at a resolution of 0.2 arcsec (52 pc). Section 2 describes the observations. The molecular gas reservoir and spectral energy distribution are analysed in Sections 3 and 4. We discuss and summarize our results in Sections 5 and 6.
| General characteristics | ||
| Coordinates (J2000) | 03h37m44.0s, -05d02m40s | |
| Distance | 54.1 Mpc | (*) |
| 7.12-7.32 | (1) | |
| Mstellar | M⊙ | (2) |
| MHI | M⊙ | (3) |
| SFR | 0.7 M⊙ yr-1 | (4) |
| (region S) | 20 M⊙ yr-1 kpc-2 | (5) |
| ALMA band 6 observations at 230 GHz | ||
| Continuum (S1) | 0.2070.013 (mJy) | |
| Continuum (S2) | 0.0880.011 (mJy) | |
| Continuum (region S) | 0.3170.048 (mJy) | |
| CO =21 | 0.41 (mJy/beam)a | |
2 Data
2.1 ALMA band 6 data
Observations of SBS 0335052 were carried out in 5 blocks between August, 30 2015 and September, 23 2015 as part of the Cycle 2 program 2013.1.00916.S (PI Cormier). We targeted the continuum and 12CO =21 line in band 6 at a spatial resolution of 0.2 arcsec. Observations were made in extended configuration with 35 antennas. The field-of-view is 15 arcsec. One spectral window was centered at a rest frequency of 230.5 GHz with resolution 1.3 km s-1 and the 3 other spectral windows were centered at 232.5, 245.5 and 247.5 GHz. Each window has bandwidth of 1.875 GHz. All windows were combined to make the continuum map (total bandwidth of 7.5 GHz centered around 239 GHz).
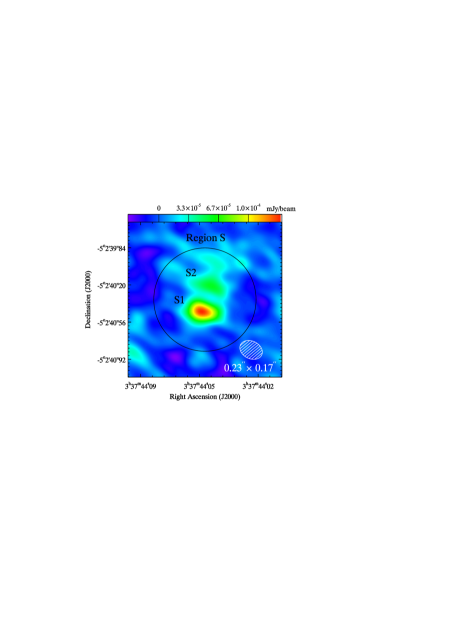
We reprocessed and recalibrated the raw data from the archive using the Common Astronomy Software Applications version 4.6.0 (McMullin et al., 2007). Data from each execution block were first processed through a set of standard calibration steps to correct phase and amplitude variations versus time and versus channel and to flux calibrate the data. Data from antennas or channels which have irregular phases or amplitudes are flagged during the calibration. The final images were then created using the clean algorithm with natural weighting. The source was calibrated using quasars where the estimated flux densities have uncertainties of 15 per cent. The reconstructed Gaussian beam size in the final images is 0.23 arcsec0.17 arcsec with a position angle of 65∘, which matches the full-width at half maximum of the axes of the beam before deconvolution as well as the axis orientation. The continuum is detected at a signal-to-noise of towards the peak of emission and resolved into two compact knots (S1 and S2, see Fig. 1). We achieve an rms of 0.011 mJy/beam in the continuum. We extract fluxes for the two SSCs by fitting 2D ellipses constrained by the shape of the ALMA beam. We fit each SSC at a time, masking out the other SSC. Emission from S1 is marginally resolved (fitted with an ellipse of size the beam). Over the region S, we measure a total flux of 0.32 mJy (Table 1) with a circular aperture of radius 0.5 arcsec covering S1 and S2. The sum of the Gaussians agrees with the total within errors, indicating no significant extended emission. Uncertainties are given as the rms per beam times . The CO =21 line is not detected. We report an rms of 0.41 mJy/beam, for a spectral resolution of 5 km s-1. The maximum recoverable scale of our observations is 5 arcsec (1.3 kpc), so we are not missing extended emission in our analysis.
2.2 Ancillary data and star-formation rates
We compare our ALMA observations to ISM data of SBS 0335052 as well as radio data. We use Herschel photometry at a resolution 5 arcsec from Rémy-Ruyer et al. (2015). We complement those with ALMA band 7 (346 GHz) data from Hunt et al. (2014) at 0.6 arcsec resolution. Additionally, we use radio continuum data from the VLA (1.3 to 6 cm) at 0.5 arcsec resolution and SSC-extracted fluxes from Johnson et al. (2009). SBS 0335052 was observed at 1.5–22 arcsec resolution with the VLA (1.3 to 21 cm) by Hunt et al. (2004). Although SBS 0335052 is not resolved in the Herschel data or in the VLA data from Hunt et al. (2004), there is evidence that S1 and S2 dominate the global emission at other wavelengths. Hence we consider emission from region S as total emission. The total SFR of the galaxy, measured by combining the H and total infrared emission, is 0.7 M☉ yr-1 (Rémy-Ruyer et al., 2015). From resolved studies, 1.3 cm emission yield SFRs of 0.38 and 0.27 M☉ yr-1 for S1 and S2 (Johnson et al., 2009).
3 Star formation and molecular reservoir
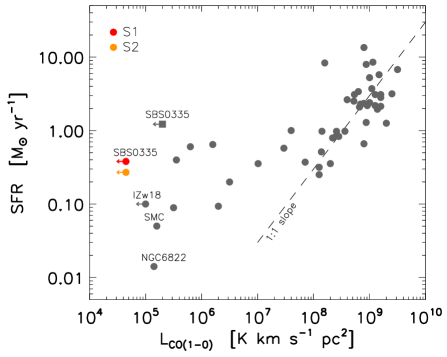
The new ALMA observations put stringent constraints on the amount of CO-emitting molecular gas in SBS 0335052. Assuming a broad line width of 50 km s-1, as measured from H i (Ekta et al., 2009), we derive a conservative 3- limit of K km s-1 pc2. Our solid angle is arcsec2. Taking a CO(2-1)/CO(1-0) ratio of 0.8 (e.g., Sage et al., 1992), this corresponds to a limit of K km s-1 pc2. Previous CO =10 and CO =32 measurements by Dale et al. (2001) and Hunt et al. (2014), with solid angles of 23 arcsec2 and 1 arcsec2 and a CO(3-2)/CO(1-0) ratio of 0.6, put limits of and K km s-1 pc2, respectively. Figure 2 shows the CO =10 luminosity as a function of SFR for SBS 0335052 and several nearby galaxies which measurements are compiled in Schruba et al. (2012). Our ALMA data provide a new limit on the CO luminosity in SBS 0335052. SBS 0335052 clearly stands out in being so CO faint for a star-forming galaxy.
The CO-to-H2 conversion factor () being unconstrained at low metallicity, we do not convert this luminosity into a limit on the mass of H2. Instead, we hypothesize that star formation proceeds with a given depletion time-scale, =M(H2)/SFR. We assume three different molecular gas depletion times: 2 Gyr - a common value for normal, disc-type galaxies (e.g., Bigiel et al., 2008); 0.2 Gyr - a common value for starburst galaxies (e.g., Daddi et al., 2010); and 20 Myr - a common value for local molecular clouds (e.g., Lada et al., 2012). Significantly reduced depletion time-scales - similar to starburst values - have been found by Kepley et al. (2016) for another dwarf galaxy, II Zw 40.
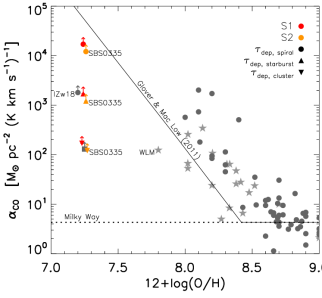
From the CO luminosity and SSC-derived SFR values, we can constrain . The limits that we find for S1 and S2 are shown in Figure 3 and are around M⊙ pc-2 (K km s-1)-1 for cloud depletion times (20 Myr), and M⊙ pc-2 (K km s-1)-1, amongst the highest, for whole-galaxy depletion times ( Gyr). The most surprising finding is that, even at our 50 pc resolution, CO is not detected. Glover & Mac Low (2011) analyse variations of the factor as a function of visual extinction in numerical simulations of low-metallicity clouds. Following their study, our results are compatible with mean visual extinctions of 0.1-1 mag. This is within values found from optical data (Izotov et al., 1997; Reines et al., 2008) and much lower than expected from IR data. The filling factor of the shielded and IR-bright component in SBS 0335052 must be very small. Reines et al. (2008) estimate a clumpy dust covering factor of 60 per cent. With our 1- limit of K km s-1 at a resolution of 50 pc, and a typical CO clump brightness of 15 K km s-1 (Glover & Clark, 2012), we estimate a beam filling factor for the CO-emitting clumps of less than 33 per cent.
4 Spectral energy distribution
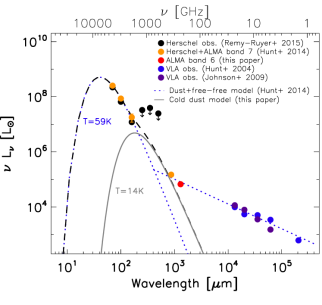
Figure 4 shows the total FIR-radio SED of SBS 0335052. The photometry consists of Herschel, ALMA, and VLA observations. Hunt et al. (2014) model the ALMA 345 GHz and VLA data with free-free emission and the Herschel data with warm dust (=59 K). Our ALMA observation (red point) falls slightly below their free-free model. Figure 5 shows a zoom on the radio SED, focusing on the high-resolution data. Johnson et al. (2009) model the emission from S1, S2, and region S with three distinct free-free components. For region S, their model passes in between the ALMA band 6 and band 7 data but disagrees at a 2- level from the two observations. Moreover, the ALMA fluxes cannot be reproduced simultaneously with free-free emission only. In particular, the slope between the ALMA bands 7 and 6 is incompatible with gas emission and is rather indicative of thermal dust emission. For S2, the ALMA band 6 data match well the free-free model of Johnson et al. (2009). For S1, our flux at 230 GHz is 1.3 times higher than their model (10- significance) and we cannot fit both the VLA and ALMA data within errors with a single free-free model. Therefore in the following we consider an additional dust component that is most visible in S1 and not S2. We investigate the significance of a dust excess by focusing on S1. Fitting the SED of S1 with an additional dust component results in a better than without it, and an F-test indicates that the probability of this dust component is high (98 per cent). This is valid when employing modified black-body spectra as well as more realistic dust optical properties and a distribution of temperatures (Galliano et al., 2011).
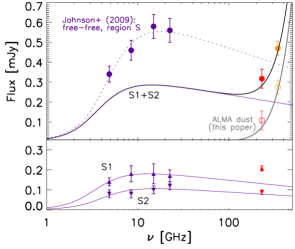
To model the dust emission present in the ALMA data of region S, we subtract the free-free emission predicted by the Johnson et al. (2009) models for the clusters S1 and S2. Note that we do not subtract their free-free model for region S (shown for reference in the top panel of Fig. 5) because there are discrepancies in the VLA observations/models of Johnson et al. (2009) and Hunt et al. (2004) for region S and the whole galaxy, respectively, whose origin is not clear to us. Then, we fit a dust component to the ALMA excess of region S (open circles in Fig. 5). We find that the PACS data and ALMA excess cannot be reproduced simultaneously with a single modified black-body (MBB). This remains true even if the PACS data encompass extended emission not belonging to region S. In addition to the MBB fitted to the PACS observations (59 K, ), we require a second dust component, for which we assume common values of m2 kg-1 and (Galliano et al., 2011). The PACS 160 m measurement puts an upper limit on the dust temperature of K, which gives a mass M⊙ (grey lines in Figs. 4 and 5). With a temperature of 10 K, the required mass is M⊙. Those dust masses are about 4 times larger than the dust mass of M⊙ found by Hunt et al. (2014) and more than 10 times larger than previous dust estimates based on Herschel data only (Rémy-Ruyer et al., 2015). We note that this cold dust mass is an estimate only. In particular, alternative dust properties or mantle coating, resulting in a larger overall emissivity would reduce the mass (e.g., Köhler et al., 2014). It is also possible that the grains could exhibit an intrinsic excess at longer wavelength (e.g., Meny et al., 2007; Coupeaud et al., 2011). Further constraints between 200 m and 600 m would be extremely valuable to confirm the cold dust hypothesis.
5 Discussion
SBS 0335052 is a very intriguing galaxy in the sense that it is actively star-forming, metal-poor, with a large H i reservoir and extremely faint, still undetected CO emission. It potentially harbours a large dust/hidden molecular reservoir. Here we discuss the implications of such massive cold reservoirs on the galaxy properties and theory of star-formation (varying efficiencies, role of H i in metal-poor environments).
Concerning the gas reservoir, with the SFR and values used in Sect. 3, we find molecular gas masses of M⊙. This is the mass of gas within S1 and S2 required to explain the current star formation. If the depletion time is long (2 Gyr), the inferred molecular mass is larger than the H i mass within region S, estimated to be around M⊙ by Ekta et al. (2009) and Hunt et al. (2014), and it is on the order of the total H i mass of M⊙ (Ekta et al., 2009). If the depletion time is short (20 Myr), the inferred molecular mass is of the order of the H i mass in region S and lower than the total H i mass. Recent numerical simulations at low metallicity demonstrate that star formation can happen in a primarily atomic-dominated ISM (Krumholz, 2012; Glover & Clark, 2016). In the case of very short depletion times, no hidden molecular gas is required in SBS 0335052 to explain the SFR, while in the case of longer depletion times, a massive amount of hidden molecular gas would be required.
Concerning the dust, the cold material found in Sect. 4 could be responsible for the large extinction ( mag) needed in the mid-IR SED modeling. Thuan et al. (1999) estimate the dust surface density to be 1.5 M⊙ pc-2. Since the ALMA emission in S1 is barely resolved, we assume that the cold dust spatial extent corresponds to our beam size. Following the calculations of Thuan et al. (1999) and assuming a uniform dust distribution, the cold dust mass needed to account for the mid-IR extinction is M⊙, i.e. 30 times lower than our new estimate. This estimate will go up if the dust is distributed in clumps, as suggested by Reines et al. (2008). It is noteworthy that the gas mass that is implied by our new dust estimate, assuming full condensation of the metals into dust, is of the same order of the gas mass estimated assuming of 2 Gyr. This cold gas mass is a few times larger than the warm H2 mass of 108 M⊙ (based on modeling of the NIR H2 lines; Thuan et al. 2005), as found in nearby metal-rich galaxies (e.g., Roussel et al., 2007). Those facts further support our interpretation of an extreme value needed to explain the non-detection of CO emission even with ALMA.
6 Conclusion
We present ALMA band 6 (230 GHz) observations in the blue compact dwarf galaxy SBS 0335052 at an unprecedented resolution of 0.2 arcsec (52 pc). The CO =21 line is not detected. We report a very deep 3- limit of K km s-1 pc2. This corresponds to a lower limit on the conversion factor of M⊙ pc-2 (K km s-1)-1 when assuming cloud depletion times and of M⊙ pc-2 (K km s-1)-1 for whole-galaxy depletion times. The faintness of CO emission implies, for a whole-galaxy star-formation depletion time, a dominant amount of CO-dark gas. The ALMA continuum emission is detected and resolved over the two main SSCs. Re-analysis of the IR-radio SED suggests that the mm-fluxes are not only free-free emission but that there is a cold dust component coincident with the position of S1. Assuming standard dust properties, the dust mass could be as large as M⊙. This mass of cold dust corroborates the CO-dark gas interpretation.
Acknowledgements
We acknowledge support from the SYMPATICO grant (ANR-11-BS56-0023) of the French Agence Nationale de la Recherche; the DAAD/PROCOPE projects 57210883/35265PE; the DFG for the programmes BI 1546/1-1 and HO 5475/2-1. and for funding in SFB 881 ’The Milky Way System’ (subprojects B1, B2, and B8) and in SPP 1573 ’Physics of the ISM’ (grants KL 1358/18.1, KL 1358/19.2); the ERC via the Advanced Grant ’STARLIGHT’ (project number 339177). This paper makes use of the following ALMA data: ADS/JAO.ALMA#2013.1.00916.S. ALMA is a partnership of ESO (representing its member states), NSF (USA) and NINS (Japan), together with NRC (Canada), NSC and ASIAA (Taiwan), and KASI (Republic of Korea), in cooperation with the Republic of Chile. The Joint ALMA Observatory is operated by ESO, AUI/NRAO and NAOJ.
References
- Bigiel et al. (2008) Bigiel F., Leroy A., Walter F., Brinks E., de Blok W. J. G., Madore B., Thornley M. D., 2008, AJ, 136, 2846
- Bolatto et al. (2013) Bolatto A. D., Wolfire M., Leroy A. K., 2013, ARA&A, 51, 207
- Cormier et al. (2014) Cormier D., et al., 2014, A&A, 564, A121
- Coupeaud et al. (2011) Coupeaud A., et al., 2011, A&A, 535, A124
- Daddi et al. (2010) Daddi E., et al., 2010, ApJ, 714, L118
- Dale et al. (2001) Dale D. A., Helou G., Neugebauer G., Soifer B. T., Frayer D. T., Condon J. J., 2001, AJ, 122, 1736
- Ekta et al. (2009) Ekta B., Pustilnik S. A., Chengalur J. N., 2009, MNRAS, 397, 963
- Elmegreen et al. (2013) Elmegreen B. G., Rubio M., Hunter D. A., Verdugo C., Brinks E., Schruba A., 2013, Nature, 495, 487
- Galliano et al. (2011) Galliano F., et al., 2011, A&A, 536, A88
- Glover & Clark (2012) Glover S. C. O., Clark P. C., 2012, MNRAS, 421, 9
- Glover & Clark (2016) Glover S. C. O., Clark P. C., 2016, MNRAS, 456, 3596
- Glover & Mac Low (2011) Glover S. C. O., Mac Low M.-M., 2011, MNRAS, 412, 337
- Hunt et al. (2004) Hunt L. K., Dyer K. K., Thuan T. X., Ulvestad J. S., 2004, ApJ, 606, 853
- Hunt et al. (2005) Hunt L., Bianchi S., Maiolino R., 2005, A&A, 434, 849
- Hunt et al. (2014) Hunt L. K., et al., 2014, A&A, 561, A49
- Hunt et al. (2015) Hunt L. K., et al., 2015, A&A, 583, A114
- Israel (1997) Israel F. P., 1997, A&A, 328, 471
- Izotov et al. (1997) Izotov Y. I., Lipovetsky V. A., Chaffee F. H., Foltz C. B., Guseva N. G., Kniazev A. Y., 1997, ApJ, 476, 698
- Izotov et al. (2009) Izotov Y. I., Guseva N. G., Fricke K. J., Papaderos P., 2009, A&A, 503, 61
- Johnson et al. (2009) Johnson K. E., Hunt L. K., Reines A. E., 2009, AJ, 137, 3788
- Kepley et al. (2016) Kepley A. A., Leroy A. K., Johnson K. E., Sandstrom K., Chen C.-H. R., 2016, ApJ, 828, 50
- Köhler et al. (2014) Köhler M., Jones A., Ysard N., 2014, A&A, 565, L9
- Krumholz (2012) Krumholz M. R., 2012, ApJ, 759, 9
- Lada et al. (2012) Lada C. J., Forbrich J., Lombardi M., Alves J. F., 2012, ApJ, 745, 190
- Leroy et al. (2011) Leroy A. K., et al., 2011, ApJ, 737, 12
- McMullin et al. (2007) McMullin J. P., Waters B., Schiebel D., Young W., Golap K., 2007, in Shaw R. A., Hill F., Bell D. J., eds, Astronomical Society of the Pacific Conference Series Vol. 376, Astronomical Data Analysis Software and Systems XVI. p. 127
- Meny et al. (2007) Meny C., Gromov V., Boudet N., Bernard J.-P., Paradis D., Nayral C., 2007, A&A, 468, 171
- Moiseev et al. (2010) Moiseev A. V., Pustilnik S. A., Kniazev A. Y., 2010, MNRAS, 405, 2453
- Pilbratt et al. (2010) Pilbratt G. L., et al., 2010, A&A, 518, L1+
- Reines et al. (2008) Reines A. E., Johnson K. E., Hunt L. K., 2008, AJ, 136, 1415
- Rémy-Ruyer et al. (2015) Rémy-Ruyer A., et al., 2015, A&A, 582, A121
- Roussel et al. (2007) Roussel H., et al., 2007, ApJ, 669, 959
- Rubio et al. (2016) Rubio M., Elmegreen B. G., Hunter D. A., Brinks E., Cortes J. R., Cigan P., 2016, preprint, (arXiv:1603.04736)
- Sage et al. (1992) Sage L. J., Salzer J. J., Loose H.-H., Henkel C., 1992, A&A, 265, 19
- Schruba et al. (2012) Schruba A., et al., 2012, AJ, 143, 138
- Thuan et al. (1997) Thuan T. X., Izotov Y. I., Lipovetsky V. A., 1997, ApJ, 477, 661
- Thuan et al. (1999) Thuan T. X., Lipovetsky V. A., Martin J.-M., Pustilnik S. A., 1999, A&AS, 139, 1
- Thuan et al. (2005) Thuan T. X., Lecavelier des Etangs A., Izotov Y. I., 2005, ApJ, 621, 269
- Vanzi et al. (2000) Vanzi L., Hunt L. K., Thuan T. X., Izotov Y. I., 2000, A&A, 363, 493
- Wu et al. (2006) Wu Y., Charmandaris V., Hao L., Brandl B. R., Bernard-Salas J., Spoon H. W. W., Houck J. R., 2006, ApJ, 639, 157