reception date \Acceptedacception date \Publishedpublication date
accretion, accretion disks — black hole physics — magnetohydrodynamics (MHD)
A Possible Time-Delayed Brightening of the Sgr A* Accretion Flow after the Pericenter Passage of G2 Cloud
Abstract
A possibility of time-delayed radio brightenings of Sgr A* triggered by the pericenter passage of the G2 cloud is studied by carrying out global three-dimensional magnetohydrodynamic simulations taking into account the radiative cooling of the tidal debris of the G2 cloud. Magnetic fields in the accretion flow are strongly perturbed and re-organized after the passage of G2. We have found that the magnetic energy in the accretion flow increases by a factor 3-4 in 5-10 years after the pericenter passage of G2 by a dynamo mechanism driven by the magneto-rotational instability. Since this B-field amplification enhances the synchrotron emission from the disk and the outflow, the radio and the infrared luminosity of Sgr A* is expected to increase around A.D. 2020. The time-delay of the radio brightening enables us to determine the rotation axis of the preexisting disk.
1 Introduction
The pericenter passage of an object named G2 close to the galactic center black hole (BH) Sgr A* (Gillessen et al., 2012) was expected to enhance the activity of Sgr A* by supplying the tidally stripped gas to the BH. The distance of its pericenter from the Galactic center BH is only (Gillessen et al., 2013a, b), where is the Schwarzschild radius. Br- observations indicate that the size of the G2 is mas, i.e. , which is as large as its pericenter distance. The estimated mass of the gas component of G2 is 3, which is comparable to that of the Sgr A* accretion flow, i.e., a hot accretion flow onto the Galactic center BH (for hot accretion flows, see Kato et al., 2008; Yuan & Narayan, 2014, and references therein). The G2 was, therefore, expected to affect the dynamics of the Sgr A* accretion flow and trigger a flare. However, no brightening event induced by the pericenter approach of G2 has been observed in Sgr A* (Tsuboi et al., 2015; Bower et al., 2015).
After the discovery of the G2, a number of numerical simulations have been performed (Burkert et al., 2012; Schartmann et al., 2012; Sa̧dowski et al., 2013; Abarca et al., 2014; Saitoh et al., 2014). Most of these simulations did not take into account magnetic fields despite their important roles in accretion processes (e.g., Balbus & Hawley, 1991; Brandenburg et al., 1995; Matsumoto, 1999; Hawley, 2000; McKinney et al., 2012). Sa̧dowski et al. (2013) carried out three-dimensional (3D) general relativistic magnetohydrodynamic (MHD) simulations in order to study the shock structure at which the electrons may be accelerated, during the pericenter passage of the G2 cloud. Long-term MHD simulations of the G2 cloud, however, have not yet been carried out, although it is necessary to explore the future brightening of Sgr A*.
In this paper, we present the possibility of the time-delayed amplification of magnetic fields and subsequent accretion by carrying out longer time-scale 3D MHD simulations of a hot accretion flow impacted by a cloud. Since the gas supplied by the cloud need a several rotation period at the pericenter to settle into a rotating torus, and typically 10 rotation period for the re-organization of magnetic fields, it takes 5-10 years until the magnetic fields are re-amplified by the dynamo action driven by the magneto-rotational instability (MRI). Therefore, in order to study the possibility of the time delayed brightening, we need to carry out MHD simulations for time scales of a decade. This is the motivation of this paper.
It is still controversial whether or not G2 harbors a star in its center: Pfuhl et al. (2015) observed G2 in infrared band using SINFONI and proposed that G2 is a pure gas clump, which is possibly formed from a gas stream around Sgr A*, while Witzel et al. (2014) observed G2 in L’ band using Keck observatory and proposed that G2 harbors a star because the size of the dust of G2 does not change during its pericenter passage. For simplicity, we assume pure gas clouds in this paper. This assumption should be reasonable, partly because a tidally disrupted gas feature is evident in - diagram (Pfuhl et al., 2015), and partly because the size of the region where gravity of the central star dominates that of the Galactic center BH is only % of the estimated cloud size (Witzel et al., 2014), so that we can neglect the effect of the central star even if it exists.
2 Simulation Model
We solve a set of MHD equations taking into account the anomalous resistivity (Yokoyama & Shibata, 1994) and the effects of radiative cooling in cylindrical coordinates . In this paper, and denotes the cylindrical and the spherical radius, respectively. The equations are the same as those in Machida et al. (2006), except we incorporate the effects of radiative cooling due to recombination with approximate cooling function (Guillochon et al., 2014):
| (1) |
as well as the bremsstrahlung emission , since the structure of the G2 cloud should be affected by the radiative cooling (Guillochon et al., 2014; Saitoh et al., 2014). Here, , , and is the proton mass, mass density, and gas temperature, respectively. In this work, we do not incorporate the effects of the synchrotron cooling. It is well known that, in optically-thin hot accretion disks, the bremsstrahlung cooling dominates the synchrotron cooling in the outer disk, which we simulate in this work, while the synchrotron cooling can be dominant in the inner disk. This is because the synchrotron cooling rate is roughly proportional to if we assume the energy equipartition, while the bremsstrahlung cooling rate is proportional to . Since the gas temperature decreases with radius, the bremsstrahlung emission dominates the synchrotron radiation in the outer disks. In this work, as we mention below, we calculate the outer accretion flow, in which the bremsstrahlung emission is the dominant radiative process. In addition, the G2 cloud is so cool that synchrotron emission cannot dominate the Br- and bremsstrahlung emissions, since the synchrotron photons are radiated by relativistic electrons. These are the reasons why we ignored the synchrotron cooling in this work. The anomalous resistivity is incorporated by using the same formula as that employed in Machida et al. (2006), i.e., , where is the magnetic diffusivity, and is the current density. There are two free parameters: the coefficient for the anomalous resistivity and the threshold value . We set and in our simulation unit (i.e., ).
We carry out global 3D simulations by using a newly-developed MHD code CANS+ (Matsumoto et al., 2016). The code is based on the HLLD approximate Riemann solver proposed by Miyoshi & Kusano (2005). In order to preserve monotonicity and to achieve high-order accuracy in space, we employ a monotonicity preserving, fifth-order accurate interface value reconstruction method, MP5 (Suresh & Huynh, 1997). A third-order TVD Runge-Kutta method is used for the time integration. We adopt the hyperbolic divergence cleaning method (Dedner et al., 2002) in order to minimize numerical errors of the divergence free condition of the magnetic field.
The number of computational cells is . The cell size is constant in the inner region: for and . Here is the location of the pressure maximum of the initial torus, which we set . Outside this region, and increase with and , respectively: , for , and for . Here, denotes the sequential cell number, and and are set to be . In azimuthal direction, the cell size is set to be constant, i.e., . The computational domain is, thus, , , and . A spherical absorbing inner boundary is imposed at , i.e., the physical quantity is approximated by if their cell-centers are inside , where is the damping coefficient, is the numerically obtained quantity at the next timestep, and is the initial value [for details, see equation (7) and (8) in Machida et al. (2006)]. The shape of this absorbing boundary modestly matches up with the exact spherical one, since the cell size is 5% of the inner boundary radius. The outer boundaries are the free boundaries where waves can be transmitted.
At first, we perform the simulations of hot accretion flows without introducing a gas cloud until the accretion flow attains a quasi-steady state. After the quasi-steady state is realized, a gas cloud in pressure equilibrium with the ambient gas is located into the simulation box.
2.1 A Hot Accretion Flow Model for the Sgr A*
We assume a rotating, equilibrium torus with the pressure maximum at . The torus is assumed to be threaded by a weak, purely toroidal, initial magnetic field, by using the equilibrium solution of magnetized tori proposed by Okada et al. (1989). The plasma at the pressure maximum of the torus is initially 100. We set the direction of the rotation axis of the initial torus to be the same as -axis. The torus is embedded in a hot, isothermal, non-rotating, static, coronal atmosphere with gas temperature K. For more details of the simulation set-up, see, e.g., Machida et al. (2006).
After the growth of the non-axisymmetric mode of MRI ( orbital-period at the pressure maximum of the initial torus), the angular momentum is efficiently transported by the Maxwell stress and an accretion flow is formed. At 30 orbital-time at the pressure maximum, we locate a gas cloud in the computational domain to simulate the interaction of the G2 cloud with the Sgr A* accretion flow.
The normalization factor of the mass density is chosen to be consistent with the observational implication of mass density distribution of the Sgr A* accretion flow (Yuan et al., 2003; Anninos et al., 2012) such that , where is the azimuthally averaged, normalized mass density of the quasi-steady accretion flow.
2.2 Models of the G2 Cloud
There are six parameters describing orbits of a point mass: the orbital inclination , the longitude of the ascending node , the argument of the pericenter , the eccentricity , the semi-major axis , and the time of the pericenter passage . The three parameters , , and can be constrained from the observations of the G2. According to the observation of the Br- emission line and the data analysis by Gillessen et al. (2013b), we set , and the pericenter radius . The semi-major axis is obtained from and . For convenience, we replace by so that the G2 passes the pericenter at yr.
For our simulations, the other three parameters , , and cannot be constrained from the observation, because of the uncertainty of the angle between the rotation axis of the Sgr A* accretion flow and that of the Galactic plane. For simplicity, we assume and , where means that the pericenter is assumed to be on the equatorial plane of the accretion flows. We expect that the parameter does not significantly affect the results, because the global structure of the accretion flow is not highly non-axisymmetric. In this paper, we present results for and rad. In this work, we assume a Schwarzschild BH and employ a pseudo-Newtonian potential (Paczyńsky & Wiita, 1980), so that we do not take into account the relation between the direction of the BH spin and the orbit parameters of the gas cloud described above.
We set the initial position of the center of G2 at . For the initial cloud density, we assume Gaussian distribution with FWHM cm (Sa̧dowski et al., 2013) in such a way that the total mass of the gas cloud is 3. The initial velocity inside the cloud is assumed to be equal to the Kepler orbital velocity at its center of mass. For the sake of simplicity, we do not assume the initial magnetic field in the cloud. We note that is assured when we locate the cloud, because the magnetic field is neither artificially added to nor removed from the computational domain.
The cloud which satisfy the assumption above is located in the computational domain after a quasi-steady accretion flow is formed.
3 Results
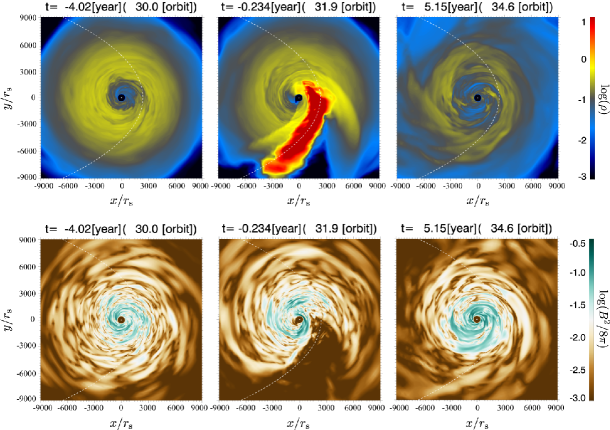
Time evolution of the gas cloud and the hot accretion flow when is shown in figure 1. At yr (i.e., 30 Kepler orbital time at the initial pressure maximum of the torus), nonlinear growth of non-axisymmetric MRI has already been saturated, so that the accretion flow has attained the quasi-steady state. At this time, the spherical gas cloud is located at , far outside the zoomed region of figure 1. At yr, the gas cloud stretched by the tidal force of the Galactic center BH penetrates the accretion flow. This stage is qualitatively the same as Sa̧dowski et al. (2013), except that the tidally stretched gas becomes slimmer due to the effects of the radiative cooling in this work. At yr, the accretion flow returns back to the quasi-steady state with its magnetic field being amplified by the MRI-driven-dynamo compared to that before the passage of the gas cloud. The mass density and pressure at is roughly half of those before the G2 encounter because the disk mass is swept by the G2 impact. However, the variation of mass density and gas pressure inside (i.e., inside the pericenter radius of the G2 cloud) is about several tens percent, while the magnetic energy increases by a factor 3-4 after the pericenter passage. Therefore, we expect the radio brightening of the Sgr A* by the synchrotron emission when the gas with the B-field, which is amplified via the MRI-driven-dynamo triggered by the G2 encounter, accretes onto the innermost region of the accretion flow with a time-delay, i.e., the dynamo timescale and the accretion timescale at . It takes not only dynamo timescale but also accretion timescale to show the brightening, because the synchrotron emission from the innermost region of the pre-existing accretion flow is too bright to mask the radio brightening due to the enhanced magnetic field at . When the gas with amplified B-field at accretes to the innermost region, synchrotron emission is expected to increase.
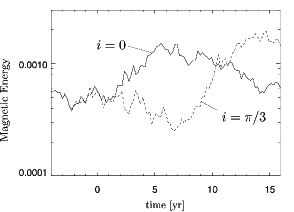
In figure 2, we present time evolution of magnetic energy. The peak magnetic energy, which is 3-4 times larger than that before the encounter with G2, appears about 5 and 13 yrs after the pericenter passage of the G2 cloud for the model with inclination angle and , respectively. In the case that , magnetic energy increases after the impact of the G2 cloud because the cloud collision increases the radial component of magnetic fields, which is subsequently amplified by differential rotation of the disk. In the case that , magnetic energy slightly decreases after the cloud impact because the enhanced turbulent motion dissipates the magnetic energy. When the rotation axis of the disrupted disk is fixed, MRI-driven-dynamo amplifies the magnetic field of the tilted disk.
Here, let us discuss a little more about the competition between the magnetic dissipation and amplification. Since magnetic turbulence enhanced by the passage of the gas cloud increases the magnetic dissipation, the accretion flow approaches to a Taylor state (Taylor, 1974), in which the system relaxes to a state with minimum magnetic energy. Figure 2 indicates that the relaxation of the magnetic energy is more significant in the model with , in which the system is highly perturbed by the impact of the cloud. Subsequently, magnetic field is amplified by MRI through the generation of by turbulence. Numerical results for indicates that the magnetic field amplification by the latter mechanism becomes dominant 5 yrs after the pericenter passage of G2. This time scale is consistent with that of the disk dynamo at .
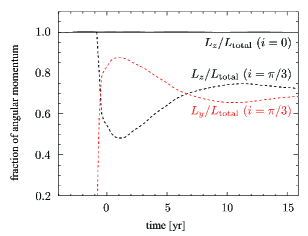
As mentioned above, the B-field amplification is delayed in the model with because it takes time before the decay of strong perturbation caused by the impact of G2. Figure 3 shows time evolution of the angular momentum of the flows integrated such as . For the model with , the direction of the angular momentum is remarkably modified after the G2 passage: At yr, the accretion flow is strongly disturbed by the cloud impact (see also figure 4) and the direction of angular momentum drastically changes. After yr, the fluctuation of the and is less than 10%, so that it can be regarded that the flow has settled to a quasi-steady state with a tilted rotation axis. In this quasi-steady disk, the B-field amplification by MRI restarts to dominates the decay of the magnetic field. Thus, the amplification of the B-field in the model with is delayed by 5 yrs.
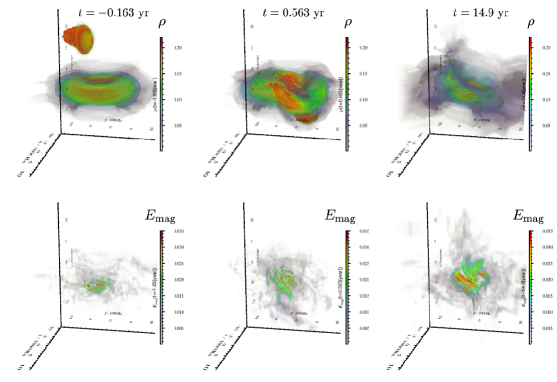
In figure 4, it is shown that the accretion flow is tilted after the passage of the gas cloud for the model with . The tilt of the accretion flow is caused by the angular momentum transport from the gas cloud to the accretion flow, because the angular momentum of the accretion flow is misaligned with that of the initial orbital motion of the gas cloud. The angular momentum of the gas cloud is sufficient to change the direction of the angular momentum vector of the accretion flow. Since it requires several years for the rotation axis of the accretion flow to settle into the new direction, the B-field amplification via the disk dynamo is delayed when the inclination is large.
4 Summary and Discussion
We carried out 3D MHD simulations of the interactions of the Sgr A* accretion flow with the gas cloud G2, taking into account the effects of radiative cooling. We found that the magnetic energy increases by 3-4 times in 5-10 years after the pericenter passage of the G2 cloud. The delay time of the B-field amplification depends on the orbital inclination of the gas cloud: the maximum magnetic energy appears 5 and 13 yrs after the pericenter passage for the model with and , respectively. The B-field amplification can increase the radio and the infrared luminosity with a time delay after the G2 passage. We expect that the gradual increase of the synchrotron emission with a peak around A.D. 2020 can be observed in the radio and the infrared bands. This significant radio brightening should occur when the amplified magnetic field accretes to the innermost region. Furthermore, the X-ray flare may occur when the amplified magnetic energy is released via the magnetic reconnection in the vicinity of the BH.
Here, we discuss the consistency of our scenario with the no detection of the increased radiative flux in Sgr A* up to today. In this paper, we have found that the magnetic field in the Sgr A* accretion flow is amplified 5-10 yrs after the pericenter passage of the G2 cloud. Our scenario would reasonably explain the no detection of the radio and the infrared brightening to date, because the radio and the infrared emission in the Sgr A* may be dominated by the synchrotron emission, which should be enhanced with the B-field amplification.
By contrast, the X-ray emission of Sgr A* may be dominated by the bremsstrahlung emission from the outer part of the accretion flow at (Quataert, 2002; Yuan et al., 2003). This radius is far outside the distance of the pericenter of G2. Thus, change of the dynamics of the inner accretion flow induced by the G2 impact will not affect the X-ray luminosity of Sgr A*, except the X-ray flare induced by the magnetic reconnection in the vicinity of the BH. It may be thought that the G2 should affect the X-ray luminosity when the cloud starts to interact with the accretion flow at . However, since the size of G2 is only , it would be too small to affect the dynamics of the accretion flow at . No detection of increased X-ray emission up to today is, therefore, consistent with our scenario.
If the brightening is not detected during the next yrs, there can be two possible reasons: the location of the outer edge of the accretion flow is closer to the Galactic center BH than that of pericenter of th G2, or the gas component of G2 would be less massive than the expected one. The expectation for the brightening discussed above should be confirmed by calculating time-dependent multi-wavelength radiative spectra, by post-processing the MHD simulation data. In subsequent papers, we would like to carry out the spectral calculations, as well as the parameter survey of the MHD simulations of the disk-cloud interaction.
At the beginning of our simulations, the Br- luminosity obtained by volume integration of the cooling function expressed in equation (1) attains the luminosity , which is consistent with the observed luminosity of the G2 (Gillessen et al., 2012). During the pericenter passage, however, the Br- luminosity decreases down to which is one order of magnitude lower than the observed one (Pfuhl et al., 2015). This inconsistency may be caused by overheating of the G2 cloud due to the numerical mixture of the G2 cloud and the hot accretion flows during the pericenter passage. This problem would be solved by performing the simulations with higher spatial resolution, as shown in simulations with adopted mesh refinement (AMR) code focusing not on the system including both the Sgr A* accretion flow and G2 cloud but on only G2 cloud (Schartmann et al., 2015). However, the B-field amplification shown in this work should occur also in simulations with fine spatial resolution, since it is driven by the disk dynamo (especially by MRI) and the high-resolution-simulations rather show more efficient B-field amplification (Hotta et al., 2016). Simulations with higher spatial resolution reproducing the consistent luminosity of the Br- emission remains as a future work.
It should be noted that, after the pericenter passage of the G2 cloud, the mass accretion rate at the inner boundary () increases 2-4 times of that before the G2 impact in our simulations. However, since the magnetic energy inside the disk does not increase until the MRI driven dynamo grows again (i.e., 5-10 years after the G2 impact), the synchrotron luminosity would not increase significantly until the strongly magnetized region begins to infall.
Wnen the gas with the amplified B-fields accrete onto the inner disk, synchrotron emission from the inner disk will increase. Although the observational images would not be perfectly the same as those predicted by Mościbrodzka et al. (2012) because of the amplification of the magnetic field after the G2 encounter in our study, synchrotron brightened region may be similar to that studied by Mościbrodzka et al. (2012). The brightening may be detected by East Asia mm/submm VLBI observation and Event Horizon Telescope submillimeter Very Long Baseline Interferometry experiment (EHT). As discussed below, the angle between the rotation axis of the accretion disk and the orbital axis of the G2 may be constrained by these observations.
Let us discuss whether or not the direction of the rotation axis of the preexisting accretion flow can be constrained by the timing of the brightening. The radio brightening in the vicinity of the BH is expected to follow the amplification of the B-field at , i.e., the increased B-field will be advected inward and, subsequently, will be amplified further near the BH. If we assume that the amplified B-field is advected to the innermost region of the accretion flow in the viscous accretion timescale, the time lag due to the advection is yr, where we have assumed viscosity parameter (Shakura & Sunyaev, 1973) since our simulations indicate this value in the B-filed re-amplification stage. This accretion timescale is shorter than the timescale of the B-field amplification 5 or 10 yrs so that we can identify the difference of the orbital inclination of G2 against the preexisting accretion flow. The comparison of the timing of brightening in the simulation with the future observation would enable us to constrain the direction of the rotation axis of the preexisting Sgr A* accretion flow, since the orbital plane of the G2 is known. Furthermore, the tilt of the accretion flow in case (figure 4), can be spatially resolved by the East Asia mm/submm VLBI observation and EHT. If the direction of the rotation axis of the accretion disk significantly differs from the angular momentum axis of G2, we would be able to observe the change of the rotation axis of the accretion flow with time.
The tilt of the accretion flows caused by the disk-cloud interaction can occur not only in Sgr A* but also in the other low luminosity active galactic nuclei (LLAGNs). The tilt may induce the quasi-periodic oscillation in the LLAGNs and/or the change of the direction of the LLAGN jets. These possible behavior would be important to explore the accretion and ejection histories in LLAGNs.
In this work, we set the inclination and , i.e., the gas cloud is assumed to be co-rotating with the accretion disk. If the gas cloud is counter-rotating with the accretion disk, we expect that the retrograde gas cloud will lose more angular momentum than the prograde one does affected because of the ram pressure of the accretion flow. Especially in the perfectly retrograde case (i.e., ), the most part of gas cloud may not be able to keep the Keplerian orbit, which is estimated by the observations of Br- emission line, until the G2 reaches the pericenter. It may also excite a strong disturbance of the accretion flow due to the mixing of the gas with opposite angular momentum, which would result in the drastic increase of mass accretion rate onto the black hole. We leave the parameter study of the gas cloud including the counter-rotating case as a future work.
We thank Y. Feng, K. Ohsuga, H.R. Takahashi, M. Kino, and M. Akiyama for useful discussion. The numerical simulations were mainly carried out on the XC30 at the Center for Computational Astrophysics, National Astronomical Observatory of Japan. This research also used computational resources of the HPCI system provided by the Information Technology Center, the University of Tokyo, and Research Institute for Information Technology, Kyushu University through the HPCI System Research Project (Project ID:hp120193, hp140170). This work was supported in part by MEXT HPCI STRATEGIC PROGRAM and the Center for the Promotion of Integrated Sciences (CPIS) of Sokendai, and MEXT as a priority issue (Elucidation of the fundamental laws and evolution of the universe) to be tackled by using post-K Computer and JICFuS. This work was also supported by JSPS KAKENHI Grant Number 16H03954, and the NINS project of Formation of International Scientific Base and Network.
References
- Abarca et al. (2014) Abarca, D., Sa̧dowski, A., & Sironi, L. 2014, MNRAS, 440, 1125
- Anninos et al. (2012) Anninos, P., Fragile, P. C., Wilson, J., & Murray, S. D. 2012, ApJ, 759, 132
- Balbus & Hawley (1991) Balbus, S. A., & Hawley, J. F. 1991, ApJ, 376, 214
- Bower et al. (2015) Bower, G. C., Markoff, S., Dexter, J., et al. 2015, ApJ, 802, 69
- Brandenburg et al. (1995) Brandenburg, A., Nordlund, A., Stein, R. F., & Torkelsson, U. 1995, ApJ, 446, 741
- Burkert et al. (2012) Burkert, A., Schartmann, M., Alig, C., et al. 2012, ApJ, 750, 58
- Dedner et al. (2002) Dedner, A., Kemm, F., Kröner, D., et al. 2002, J. Comput. Phys., 175, 645
- Gillessen et al. (2012) Gillessen, S., Genzel, R., Fritz, T. K., et al. 2012, Nature, 481, 51
- Gillessen et al. (2013a) —. 2013a, ApJ, 763, 78
- Gillessen et al. (2013b) —. 2013b, ApJ, 774, 44
- Guillochon et al. (2014) Guillochon, J., Loeb, A., MacLeod, M., & Ramirez-Ruiz, E. 2014, ApJ, 786, L12
- Hawley (2000) Hawley, J. F. 2000, ApJ, 528, 462
- Hotta et al. (2016) Hotta, H., Rempel, M., & Yokoyama, T. 2016, Science, 351, 1427
- Kato et al. (2008) Kato, S., Fukue, J., & Mineshige, S. 2008, Black-Hole Accretion Disks — Towards a New Paradigm — (Kyoto: Kyoto University Press)
- Machida et al. (2006) Machida, M., Nakamura, K. E., & Matsumoto, R. 2006, PASJ, 58, 193
- Matsumoto (1999) Matsumoto, R. 1999, in Astrophysics and Space Science Library, Vol. 240, Numerical Astrophysics, ed. S. M. Miyama, K. Tomisaka, & T. Hanawa, 195
- Matsumoto et al. (2016) Matsumoto, Y., Asahina, Y., Kudoh, Y., et al. 2016, ArXiv e-prints, arXiv:1611.01775
- McKinney et al. (2012) McKinney, J. C., Tchekhovskoy, A., & Blandford, R. D. 2012, MNRAS, 423, 3083
- Miyoshi & Kusano (2005) Miyoshi, T., & Kusano, K. 2005, J. Comput. Phys., 208, 315
- Mościbrodzka et al. (2012) Mościbrodzka, M., Shiokawa, H., Gammie, C. F., & Dolence, J. C. 2012, ApJ, 752, L1
- Okada et al. (1989) Okada, R., Fukue, J., & Matsumoto, R. 1989, PASJ, 41, 133
- Paczyńsky & Wiita (1980) Paczyńsky, B., & Wiita, P. J. 1980, A&A, 88, 23
- Pfuhl et al. (2015) Pfuhl, O., Gillessen, S., Eisenhauer, F., et al. 2015, ApJ, 798, 111
- Quataert (2002) Quataert, E. 2002, ApJ, 575, 855
- Saitoh et al. (2014) Saitoh, T. R., Makino, J., Asaki, Y., et al. 2014, PASJ, 66, 1
- Sa̧dowski et al. (2013) Sa̧dowski, A., Narayan, R., Sironi, L., & Özel, F. 2013, MNRAS, 433, 2165
- Schartmann et al. (2012) Schartmann, M., Burkert, A., Alig, C., et al. 2012, ApJ, 755, 155
- Schartmann et al. (2015) Schartmann, M., Ballone, A., Burkert, A., et al. 2015, ApJ, 811, 155
- Shakura & Sunyaev (1973) Shakura, N. I., & Sunyaev, R. A. 1973, A&A, 24, 337
- Suresh & Huynh (1997) Suresh, A., & Huynh, H. T. 1997, J. Comput. Phys., 136, 83
- Taylor (1974) Taylor, J. B. 1974, Physical Review Letters, 33, 1139
- Tsuboi et al. (2015) Tsuboi, M., Asaki, Y., Kameya, O., et al. 2015, ApJ, 798, L6
- Witzel et al. (2014) Witzel, G., Ghez, A. M., Morris, M. R., et al. 2014, ApJ, 796, L8
- Yokoyama & Shibata (1994) Yokoyama, T., & Shibata, K. 1994, ApJ, 436, L197
- Yuan & Narayan (2014) Yuan, F., & Narayan, R. 2014, ARA&A, 52, 529
- Yuan et al. (2003) Yuan, F., Quataert, E., & Narayan, R. 2003, ApJ, 598, 301