Galactic Cold Cores††thanks: Herschel is an ESA space observatory with science instruments provided by European-led Principal Investigator consortia and with important participation from NASA. VIII: Filament Formation and Evolution
Abstract
Context. The onset of star formation is intimately linked with the presence of massive, unstable filaments. These structures are therefore key for theoretical models aiming to reproduce the observed characteristics of the star formation process.
Aims. As part of the filament study carried out by the Herschel Galactic Cold Cores Key Programme, here we study the filament properties presented in GCC VII (Paper I) in context with theoretical models of filament formation and evolution.
Methods. A conservative sample of filaments at a distance pc was extracted with the getfilaments algorithm. The physical structure of the filaments was quantified according to two main components: the central (Gaussian) region (core component), and the power-law like region dominating the filament column density profile at larger radii (wing component). The properties and behaviour of these components relative to the total linear mass density of the filament and its environmental column density were compared with the predictions from theoretical models describing the evolution of filaments under gravity-dominated conditions.
Results. The feasibility of a transition from a subcritical to supercritical state by accretion is dependent on the combined effect of filament intrinsic properties and environmental conditions. Reasonably self-gravitating (high Mline,core) filaments in dense environments (3 mag) can become supercritical in timescales of Myr by accreting mass at constant or decreasing width. The trend of increasing Mline,tot (Mline,core and Mline,wing), and ridge with background also indicates that the precursors of star-forming filaments evolve coevally with their environment. The simultaneous increase of environment and filament explains the association between dense environments and high Mline,core values, and argues against filaments remaining in constant single-pressure equilibrium states. The simultaneous growth of filament and background in locations with efficient mass assembly, predicted in numerical models of collapsing clouds, presents a suitable scenario for the fulfillment of the combined filament massenvironment criterium that is in quantitative agreement with Herschel observations.
Key Words.:
ISM: clouds — infrared: ISM — submillimeter: ISM — dust,extinction — Stars:formation1 Introduction
Filamentary structures are a wide-spread phenomenon in the interstellar medium (ISM). They constitute a complex hierarchical population with a wide range of properties in terms of crest (ridge) column density, linear mass density (Mline), and length (e.g., Hacar et al., 2013; Hennemann et al., 2012). Observations carried out with the Herschel Space Observatory (Herschel; Pilbratt et al., 2010) indicate that filaments in the local neighbourhood might be characterised by a quasi-constant average width of pc (e.g., Arzoumanian et al., 2011), although with a wide spread around this value and possibly even increasing at larger distances (e.g., Juvela et al., 2012; Schisano et al., 2014). Filaments are also ubiquitous in a wide range of environments and conditions, from the most diffuse regions at high galactic latitudes (e.g., Miville-Deschênes et al., 2010) to the active high-mass star forming complexes (e.g., Hennemann et al., 2012).
Despite their diversity, the observed tendency of prestellar cores and young stellar objects (YSOs) to be associated with the densest and most massive of these filaments (supercritical: MlineMcrit, where Mcrit16.5 M⊙ pc-1 for a dust temperature of K; e.g., Inutsuka & Miyama, 1992; André et al., 2010) has made them a critical component that needs to be accurately constrained for the development of viable observational and theoretical models of star formation. Processes such as global cloud collapse (e.g., Peretto et al., 2013), convergence of large scale flows (e.g., Schneider et al., 2010), or cloud-cloud collisions (e.g., Duarte-Cabral et al., 2011) are just examples of the various scenarios invoked to account for the presence of filaments in star-forming regions.
In Rivera-Ingraham et al. (2016) (Paper I hereafter), the data acquired by the Herschel Galactic Cold Cores Key Programme (GCC; P.I: M. Juvela; Juvela et al., 2012) was used to extract a sample of filaments for Galactic fields located at pc. This study complemented the work presented in Juvela et al. (2012), and aimed to provide a robust characterisation of the physical properties of the filament population under different environmental conditions. The goal of this work is to apply and interpret the results derived in Paper I in context with the predictions from gravity-dominated models of star formation. Comparison between the observed filament properties and predictions from such models will lead to a better understanding of the processes and conditions needed for the formation of star-forming filaments in (gravity-driven) scenarios. The role of external events in filament formation such as external feedback and collisions are the subject of ongoing work and will be published in an upcoming study.
This work is organised according to the following structure: In Sect. 2 and Sect. 3 we provide a brief summary of the datasets and methods used in Paper I to identify and characterise the filament sample. The key properties extracted from the filament catalog are included in Sect. 4. These results are analysed and discussed in Sect. 5 in order to constrain the formation process of star-forming supercritical according to accretion-based models. Our conclusions are listed in Sect. 6.
2 Herschel Maps & Data Processing
The Herschel maps with filament detections and used as a base in Paper I constitute a subsample of 38 fields out of the 116 regions observed by the GCC Programme (see Juvela et al., 2012 and Montillaud et al., 2015 for a detailed description of the processing and map properties).
The SPIRE ( m, m, and m; Griffin et al., 2010) and PACS m maps (Poglitsch et al., 2010) were processed with the Herschel Interactive Processing Environment (HIPE111HIPE is a joint development by the Herschel Science Ground Segment Consortium, consisting of ESA, the NASA Herschel Science Center, and the HIFI, PACS and SPIRE consortia.) v.10.0 and the Scanamorphos package version 20 (Roussel, 2013), respectively.
Column density and temperature maps were produced from the colour and offset corrected SPIRE brightness maps convolved to a common resolution of ″. The pixel-by-pixel fitting of spectral energy distributions (SEDs) was carried out assuming a dust opacity of cm2 g-1 at THz (Hildebrand, 1983) for a fixed dust emissivity index of . We assumed a mean atomic weight per molecule of for consistency with previous filament studies.
3 Methodology: Detection & Characterisation of the Filament Sample
The target structures of our analysis consisted of the most robust filamentary detections located at pc and directly linked to the formation of cores within the resolution limitations of the data (full with at half maximum: FWHM pc). The process of filament extraction, selection, and analysis, are outlined below, and we refer to Paper I for a detail description of the process and techniques employed.
A preliminary catalog of filament detections in each field was obtained from the maps using the getfilaments algorithm v1.140127 (Men’shchikov, 2013). This initial extraction was carried out as part of the source detection process performed with the multi- scale, multi-wavelength source extraction algorithm getsources (Men’shchikov et al., 2012). During the filament detection process, getfilaments effectively identified and separated all the filamentary contribution in the map from that associated with compact sources and background/noise fluctuations, providing a set of images with ’clean’ filament profiles from which physical parameters such as width, length, and intensity can be derived. The algorithm also quantified, for each filament pixel, the fraction of the total intensity associated with different spatial scales in the image. Only those filaments with significant emission in the spatial scales relevant for the formation of prestellar cores ( pc at pc) were considered to be ‘core-bearing’ filaments ( ‘core-scale’ filaments) and selected for further analysis.
Characterisation of the filament population was carried out by examining the structural and environmental properties of each filament. The average radial column density profile of each detection (including contribution from compact sources to the profile) was fitted with an idealized model of a Plummer-like (Whitworth & Ward-Thompson, 2001; Nutter et al., 2008) cylindrical filament using a non-linear least squares minimization routine. Integration of the best-fit profile yielded an estimate of the total linear mass density (Mline,tot). Following the approach used in previous studies, the filament profile was further assumed to be characterised by a Gaussian-like inner region comprising the most central and densest parts of the filament. This component was described in Paper I as the filament ‘core-component’, and defines the characteristic FWHM of the filament. The ‘wing-component’ is dominated by the power-law like region of the filament profile at large radii, so that the total linear mass density can be expressed as Mline,totMline,coreMline,wing. The mean intrinsic column density of the filament was estimated by averaging the values of the pixels associated with the filament crest. An estimate of the background level was obtained by averaging the same pixels, but with values measured from the complementary background map obtained by getfilaments (getsources) during the filament extraction process.
| Regime | Mline,core | Mline,wing | BKG | BKG | FWHM | ||
|---|---|---|---|---|---|---|---|
| [M⊙ pc-1] | [M⊙ pc-1] | [ cm-2] | [mag] | [ cm-2] | [mag] | [pc] | |
| 1 ALL | |||||||
| 1 ALL(HB)c | |||||||
| 1 ALL(LB)c | |||||||
| 2 ALL | |||||||
| 2 ALL(HB) | |||||||
| 2 ALL(LB) | |||||||
| 2 SBd | |||||||
| 2 SB (HB) | |||||||
| 2 SB (LB) | |||||||
| 2 SPd | |||||||
| 2 SP (HB) | |||||||
| 2 SP (LB) | |||||||
| 3 ALL | |||||||
| 3 ALL(HB) | |||||||
| 3 ALL(LB) | |||||||
| a Average intrinsic (background-free) of crest and standard error on the mean. | |||||||
| b cm-2 mag. | |||||||
| c HBhigh-background; LBlow-background. | |||||||
| d SBsubcritical; SPsupercritical. | |||||||
4 Results: Potential Evolutionary Trends for Accretion-based Models
A total of fields contained filaments in the local neighbourhood satisfying the intrinsic and reliability criteria established for the selection of core-bearing filaments. These filaments were classified according to the component dominating their total linear mass density (core-dominated if Mline,core/Mline,wing, wing-dominated otherwise), stability (supercritical if Mline,totMcrit, subcritical otherwise), and environmental level (low-background (LB) filaments if background level below the mean of the population of mag, high-background (HB) if above this value222 cm-2 mag; Bohlin et al. (1978)). We used these classifications to identify not only global properties of the filament population, but also potential trends and correlations that could provide insight into the requirements, limitations, and nature of the physical processes driving filament formation and evolution.
Three major filament ‘regimes’ are identified (see Paper I): a core-dominated subcritical regime ( Regime 1; Mline,core pc-1), a transition regime comprising a mixture of core-dominated, wing-dominated, subcritical, and supercritical filaments (Regime 2; Mline,core pc-1), and a regime exclusively associated with supercritical filaments (Regime 3; Mline,core pc-1). These regimes, initially selected according to their Mline,core, show distinct average structural properties (Mline,tot, crest ) and environment. This can be clearly observed in the global mean properties of each regime highlighted in Paper I (Tables 3 and 4), and in more detail in Table 1 of this work.
Filament growth and mass assembly via accretion, as predicted by theoretical models and observational studies (e.g., Schisano et al., 2014), would be characterised by an increase in Mline,tot with time. Just based on the average global characteristics of the different regimes we were able to conclude in Paper I that both components (Mline,core and Mline,wing) appear to increase with increasing Mline,tot (i.e., with time), with the wing component dominating over the core component at high Mline,tot (late stages) of evolution. We were also able to infer that the most massive filament components are primarily associated with the densest environments. Our results clearly indicated that local external conditions must play a fundamental role in filament evolution.
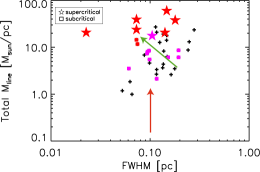
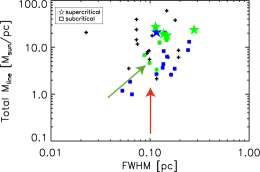
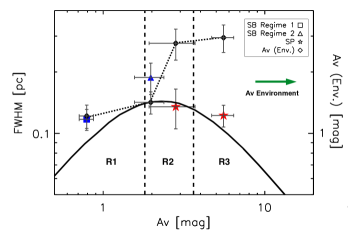
Table 1 provides a detailed list of the average properties of the different filament groups (classified according to stability and background level) within each of the three regimes. The potential changes in filament structure as a function of time (Mline,tot) and environment quantified in this Table are visually illustrated in Fig. 1.
In a transition from an overall subcritical to supercritical regime, filaments are characterised by an increase in central ridge column density (e.g., Fig. 1). This would be a natural outcome for structures undergoing collapse and substructure growth via gravitational forces, especially in dense environments where such processes would be more significant due to the availability of material. Our results also indicate a roughly constant or possibly moderate decrease in filament width with time for HB filaments (Fig. 1), and an increase for LB filaments (Fig. 1). These figures indicate that if there are indeed changes in width during filament evolution from a subcritical to supercritical regime, the small variations associated with such changes would explain the apparently constant value of this quantity for filaments in radically different environments and star-forming states (e.g., André et al., 2010). It would also support accretion as a major process in filament formation and evolution, as the presence of filaments with characteristic widths of pc have been theorised to be the result, at least in part, of accretion effects (e.g., accretion-driven turbulence and ion-neutral friction; Hennebelle & André, 2013).
5 Discussion: Filament Evolution under Gravitationally-Dominated Conditions
Accretion is necessary for filament growth and, therefore, a key factor in any evolutionary model of filaments in the ISM. Indeed, accretion is predicted to play a crucial, if not dominant, role in any scenario of filament evolution. Theoretical modelling of gravitational infall onto molecular filaments carried out by Heitsch (2013) indicates that accretion cannot be prevented even in the presence of magnetic fields or turbulence. With timescales shorter than those of ambipolar and turbulent diffusion (Heitsch & Hartmann, 2014) accretion is one of the most likely candidates for driving the prestellar core and star formation process.
Evidence of mass assembly by accretion from the local environment has been readily observed for filaments associated with low and high-mass star formation alike (e.g., Hennemann et al., 2012; Palmeirim et al., 2013). In the evolutionary model proposed in Arzoumanian et al. (2011, 2013), accreting and collapsing supercritical self-gravitating filaments would increase their linear mass density while keeping a constant filament width ( pc). An increase in linear mass density by accretion for filaments associated with the prestellar and protostellar stages of star formation was also suggested in the work by Schisano et al. (2014) and has been observed in numerical simulations. Filaments are a general intrinsic feature of molecular clouds (Smith et al., 2016), therefore influenced by the evolution of their large scale environment. Extensive periods of accretion are predicted to arise due to global cloud collapse (e.g., Gómez & Vázquez-Semadeni, 2014; Smith et al., 2014), and the transition to a supercritical regime is an expected outcome in those regions in which the converging collapse leads to enhanced gathering of mass (Heitsch et al., 2009, Smith et al., 2016). According to simple linear mass density stability criteria, subcritical filaments are defined as gravitationally unbound and stable against collapse, therefore most likely prone to dispersion before undergoing significant star formation. It is, however, still not observationally constrained how and under what conditions subcritical filaments evolve by accretion into an unstable supercritical regime, and how these observations fit in the proposed theoretical scenarios.
Based on their linear mass density and central crest column density, the GCC filaments comprise a key population in the intermediate region between the subcritical and supercritical states. These filaments also provide a statistically significant sample in a range of environments (e.g., Table 1). Our observations can therefore be used to constrain a possible transition process between the two states, as well as the role of gravity and local environment in the formation, evolution, and ultimate fate of filaments in the ISM.
5.1 Assumptions for a Subcritical-Supercritical Transition Process via Accretion
Several scenarios have been invoked that can explain the ubiquitous presence of filaments in the ISM. These are, for instance, the resulting structures caused by large-scale gravitational collapse of clouds formed by colliding flows or streams in the ISM (e.g., Burkert & Hartmann, 2004), with initial density substructure determined by turbulence and by thermal and dynamical instabilities (e.g., Heitsch et al., 2008b), and with growth aided by dynamical as well as gravitational focussing. Indeed, filaments are predicted to appear as a natural consequence of the cloud formation process (e.g., Heitsch et al., 2009). Based on these and similar models, filament formation and evolution constitute a continuous process of which our Herschel observations are nothing more than snapshots in time. By definition, our observational sample comprises a set of structures with a well developed filamentary morphology. In consequence, each of the three filament Regimes (Table 1) is expected to contain filaments in different states of evolution. The use of of this sample to constrain filament evolution is based on the following key results and assumptions:
-
1.
The filament population is dominated by structures with column densities high enough for gravity to dominate (based on estimates from e.g., Hartmann et al., 2001).
The Herschel continuum datasets can therefore be used to broadly separate the filament sample according to their early or late evolutionary state, assuming that the general trends observed with increasing Mline,tot for the various filament parameters (Paper I) are driven by accretion and inflow of material.
-
2.
A supercritical filament in one Regime evolves from a subcritical filament by increasing its Mline,tot at the same time as its Mline,core, Mline,wing, and ridge . These trends were observed and described in Paper I.
Numerical simulations (e.g., Burkert & Hartmann, 2004; Hartmann & Burkert, 2007; Heitsch et al., 2008a; Vázquez-Semadeni et al., 2009; Smith et al., 2014; Gómez & Vázquez-Semadeni, 2014) as well as observational results (e.g., Schneider et al., 2010) support the long-range effects of gravity and therefore the potentially extensive reservoir of material that can, in principle, be available for accretion. For mean infall velocities of km s-1 (e.g., Heitsch et al., 2009) accretion of material during the predicted timescale for prestellar core formation and collapse can in principle occur from regions located at pc from the filaments. The possibility of the environment evolving as the filament accretes implies that the precursor of a star-forming filament could be associated not only with a less massive structure, but also with a less dense background. This scenario is accounted for in our analysis by allowing filaments to evolve from a similar or more diffuse environment than that of the target supercritical structure.
-
3.
The wing filament component dominates at a late stage of evolution.
Our results from Paper I indicate that in a transition from subcritical to supercritical state a filament increases its Mline,core and Mline,wing. This simultaneous growth could be compatible with that predicted for other type of structures within clouds (e.g., cores; Naranjo-Romero et al., 2015). Filaments with the highest Mline,tot have the most massive components and are also predominantly wing-dominated. A potential precursor of a star-forming filament is therefore required to be core-dominated and with both Mline,core and Mline,wing lower than that of the target wing-dominated supercritical filament. While the actual behaviour of the filament components with time requires an extensive analysis and modelling of filament properties under a range of conditions, our choice is justified based on the general trends of the filaments population observed in Paper I and the individual properties of each Regime (e.g., Table 1). In Regime 2, all supercritical filaments are wing-dominated and % of the subcritical population is core-dominated. Only 2 out of the 6 supercritical filaments in Regime 3 are core-dominated.
-
4.
Mechanisms capable of providing internal support, such as turbulence or magnetic fields, do not dominate filament evolution of the global filament population.
Turbulence, for instance, is predicted to be highly linked to accretion and collapse (e.g., Burkert & Hartmann, 2004), but these processes should still not be able to prevent accretion. Numerical models clearly indicate that molecular clouds are dynamically evolving and contracting gravitationally despite the presence of magnetic fields (Ibáñez-Mejía et al., 2016). The same process of large scale global collapse drives the evolution of the internal substructure of the cloud (filament, clump), therefore gravity and mass inflow become the principal and dominant mechanisms determining changes in filamentary properties as a function of time. Observational evidence supporting the driving role of gravity is found in the shape of the observed column density probability density functions of star-forming clouds, characterised by a power-law tail at the column densities typically associated with filamentary material and star-formation (e.g., Ballesteros-Paredes et al., 2011).
By means of the above assumptions it is possible to quantify the changes associated with a transition from subcritical to supercritical state, if the filament was required to form new stars by accretion under the conditions predicted by observational and theoretical studies.
5.2 Formation and Evolution of Star-Forming Filaments
5.2.1 The ”preferred” conditions of supercritical filaments
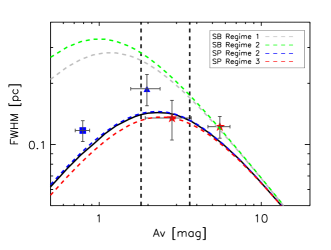
Supercritical (massive) filaments are found in Regime 2 (Mline,core pc-1) and Regime 3 (Mline,core pc-1), each associated with a different mean environmental column density level and filament properties (e.g., Table 1; Fig. 9 of Paper I). Figure 2 summarises the mean filament width (FWHM) and central ridge column density (here expressed as ) of supercritical filaments in each of the two regimes. As a reference, Fig. 2 also includes the predicted FWHM equilibrium model for self-gravitating, accreting, pressure-confined filaments from Fischera & Martin (2012). The theoretical curve in Fig. 2 corresponds to the default pressure used by these authors in Fig.10 of their work, which corresponds to an environment of 2.8 mag as estimated with Eq. A1 of Fischera & Martin (2012). Changes on the model curve attributed to variations in external pressure (cloud environment) have been highlighted Fig. 2.
The supercritical population is most dominant in Regime 3, which points towards two main requirements characterising the realm of supercritical filaments. A filament will grow, collapse, and form protostellar objects when it is associated with:
-
•
a moderately self-gravitating configuration with a core component already relatively close to supercritical state (e.g., a critical value for the filament ridge of mag (background-subtracted), or Mline,coreMcrit (Paper I); in agreement with previous studies, e.g., Fischera & Martin, 2012), and
-
•
relatively dense environment ( mag; Table 1).
Both criteria establish tight observational constraints for modelling the formation of supercritical filaments in simulations.
Interestingly, the two critical column density values (filament and environment) add to a total extinction value similar to the proposed threshold for star formation of mag (e.g., André et al., 2010, 2014), which further supports a transition from subcritical to supercritical state linked to a very specific combination of filament and environmental properties. The most obvious effect arising from the fulfilment of both criteria would be associated enhanced accretion due to the significant gravitational potential of the system and the local availability of material. The shorter build-up timescales for massive systems in dense environments (e.g., Kirk et al., 2015) would also allow the subcritical-supercritical transition to occur while fragmentation and star formation develop ( Myr). This scenario is consistent with the findings from Van Loo et al. (2014) and Schisano et al. (2014), who suggest that filaments initiate fragmentation while still in the formation stage. Considering short fragmentation timescales relative to accretion (e.g., Heitsch, 2013), a subcritical filament with Mline,core pc-1 (maximum Mline,core for any subcritical filament; Paper I) would quickly fragment and reach supercritical level in yr for accretion rates of pc-1 yr-1 (e.g., Schisano et al., 2014; Palmeirim et al., 2013). Taking into account the estimated lifetimes of prestellar cores ( yr, e.g., André et al., 2014), our results are therefore consistent with prestellar substructure forming when filaments reach a significantly self-gravitating stage at Mline,core level. This substructure would then evolve as the filament continues assembling its mass beyond supercritical threshold, ultimately leading to the presence of accreting supercritical filaments associated with protostars and already active star-formation (in agreement with results from e.g., Toalá et al., 2012).
5.2.2 The path towards supercriticality
Identification of the precursors of the supercritical filaments and their most probable evolutionary sequence depends on the assumed filament lifetime and the evolution of the filament with its environment. In Fig. 2 we have highlighted the location of subcritical filaments in Regime 1 and Regime 2 that satisfy the criteria and our established assumptions for being potential precursors of supercritical filaments. The position of subcritical filaments in Regime 1 (R1) in the figure corresponds to the mean FWHM properties of filaments in this regime that have Mline,core, Mline,wing, ridge , and environment lower than supercritical wing-dominated filaments in Regimes 2 (R2) and 3 (R3) (marked with star symbols in the diagram). Similarly, the point signalling the location of subcritical filaments in R2 traces the mean FWHM properties of the core-dominated subcritical structures with linear mass densities and environmental column density below that of the wing-dominated supercritical filaments in R3.
-
•
Filaments in Regime 1 are associated predominantly with the most diffuse ( mag) environments and low central column densities barely at, or below, those required for reasonable self-gravitating structures (Table 1). They are also associated with the narrowest widths, which is consistent with the predictions from the (magneto) hydrodynamical theoretical models of Hennebelle (2013).
-
•
Subcritical filaments in Regime 2 (environmental mag) approach the turnover point of the FWHM- curve in Fig. 2. Filaments in these denser environments are systematically associated with higher core and wing linear mass densities (Paper I) and are therefore reasonably self-gravitating structures.
Under our main assumption of filament evolving by accretion (Mline,tot increasing with time; e.g., Fig. 1), the properties of filaments in the different regimes highlighted in Fig. 2 are strongly suggestive of a filament-environment co-evolutionary scenario. Filament growth, inferred by the increase in Mline,core, Mline,wing, and ridge from Regime 1 to Regime 3, appears to be intimately associated with an increase in environmental , although the later changing by a smaller degree: Mline,core and ridge change by a factor of 6, Mline,wing by 8.5, and the environmental column density increases just by a factor of 2 (Table 1).
Kirk et al. (2015) reported a good agreement between ‘star-forming’ filaments (profiles) and the models from Fischera & Martin (2012). The also apparently good agreement of the pressure-confined equilibrium model shown in Fig. 2 with the supercritical filaments in this work (particularly in Regime 2) can be explained due to the environment of these filaments being relatively similar to that used for that particular model curve (2.8 mag, c.f., =2.72.9 mag for Regimes 2 and 3, respectively). We note that such dense environments appear to be typical of clouds with active star formation (e.g., Rivera-Ingraham et al., 2015). Subcritical filaments, on the other hand, are associated with a much lower environment , which could explain their differences with respect to the equilibrium curve in Fig. 2. We observe, however, that their properties still differ from those expected for equilibrium, pressure-confined filaments in their same diffuse environments (Fig. 2; grey and green curves). Their widths would be consistent with a much higher external pressure than the one predicted based on their observed environment . The observed discrepancy can arise due to multiple factors: different environmental temperature and chemical composition in diffuse media, inclination effects, or different mechanisms leading to out-of-equilibrium filamentary structures in diffuse environments (e.g., stellar feedback, magnetic fields, turbulence). Indeed, the local structure of many filaments in diffuse regions in the GCC sample appear to be intrinsically associated with triggered regions, such as swept-up structures and cometary globules. Furthermore, the approximation used by Fischera & Martin (2012) to derive based on environment assumes relatively dense, self-gravitating, and predominantly molecular clouds resembling pressure-confined isothermal spheres, which is an unrealistic approximation for the most diffuse fields in the GCC associated with subcritical filaments. The location and strong influence of external events on diffuse filaments therefore argue against the presence of a dominant population in equilibrium state in low density media, with the non self-gravitating population ultimately dispersing with time without undergoing star-formation (Fig. 1).
Despite the observed similarities with Regime 2 and, to some extent, Regime 3, the assumption of an equilibrium state for these structures is also questionable. First, structures exist with linear mass density above the critical value for equilibrium (Eq. 4; in Fischera & Martin, 2012), and filaments resolved by Herschel have been frequently observed to be composed of bundles of smaller scale velocity-coherent filaments (e.g., Hacar et al., 2013). Second, while equilibrium cases can well exist in non (or slowly) evolving environments (e.g., arising from turbulent dissipation in the diffuse ISM; e.g., Tafalla & Hacar, 2015), such stationary models would fail to predict a potential evolution of the filament properties with its environment as inferred from the Herschel data for the formation of star-forming filaments.
Numerical evolutionary models in large scale simulations provide a suitable alternative for exploring feasible scenarios consistent with observations. Indeed, the simultaneous increase of environmental level with filament growth for the type of structures observed in our data is more reminiscent of the dynamically evolving filaments predicted to arise within clouds undergoing large-scale collapse. Numerical models that describe the different stages of evolution of such clouds (e.g., Gómez & Vázquez-Semadeni, 2014; Kirk et al., 2015) show that filaments may evolve from a subcritical to a supercritical regime as a function of time. Furthermore, reported column density maps and animations seem to support a co-evolution of Mline,core and environment, although actual quantification of such evolutionary process has not been reported, to our knowledge. Some subcritical filaments in Regime 1, as well as subcritical and supercritical filaments in Regime 2, can become precursors of Regime 3 supercritical filaments if associated with regions of enhanced potential wells, i.e., benefitting from a particularly rapid and/or continuous process of mass assembly. In numerical simulations of clouds undergoing large scale collapse, massive filaments with central column densities similar to those of Regime 2 and Regime 3 are present at relatively late evolutionary stages, in the densest regions arising from the converging inflows ( Myr, e.g., Vázquez-Semadeni et al., 2007; Heitsch & Hartmann, 2008; Gómez & Vázquez-Semadeni, 2014). Once the critical filament Mline,core and environmental conditions are reached, star-formation and evolution progresses quickly due to the gravitational acceleration and significant mass accumulation rate associated with these conditions (e.g., Heitsch et al., 2009).
Filaments in Regime 2 (Fig. 2) are associated with relatively modest star-forming potential (Mline,core pc-1; Table 1). Taking into account the average Mline associated by default with ‘star-forming’ filaments (Mcrit), Regime 2 supercritical filaments are more consistent with being overall quiescent structures, capable of just sporadic and isolated star-forming events. However, those filaments located in growing potential wells would further benefit from a more significant, continuous and large-scale mass-inflow, leading to a fast additional increase in Mline,tot (therefore Mline,core and Mline,wing) and a transition to a fully supercritical star-forming state (Regime 3) in short Myr prestellar-protostellar transition timescales (e.g., Heitsch & Hartmann, 2008; Schisano et al., 2014). The lack of publicly available models fully describing the simultaneous evolution in time of Mline,core, Mline,wing, filament crest , width, and environmental prevents a detailed comparison of these observations predictions with simulations. However, the numbers available from accretion-based models do support the interpretation of the Herschel data described in this work.
A well defined filament with central crest comparable to those of subcritical filaments in Regime 2 is identified in the simulations from Gómez & Vázquez-Semadeni (2014) at e.g., X,Y=2,-2 pc and Myr in animation (a), Fig. 3 of that paper. Assuming a similar background as those in Regime 2 and similar dust properties in the column density calculation, this filament increases its central by at least a factor of 2 by Myr. The resulting change in is remarkably similar to that observed between supercritical filaments in Regime 2 and Regime 3, before the filament is swept into the central regions of the cloud by the large scale collapse of the cloud in the simulations. Within this same Myr timescale, filaments in the simulations from Smith et al. (2014) are also observed to increase their linear mass density by a factor , at comparable filament widths (constant or moderately decreasing- Figs. 1; 1), during their transition from subcritical to supercritical state. The trends observed in simulations under large scale collapse are therefore in line with our observationally-based predictions of a transition to supercritical state within Regime 2 and extending to Regime 3.
Our claim of Regime 2 and even Regime 1 subcritical filaments being possible precursors of the most massive Regime 3 supercritical filaments is equally in tune with the same numerical models. Our chosen filament in the simulations from Gómez & Vázquez-Semadeni (2014) evolves in position and location with the inwards flow of the cloud collapse, but the filament can be traced during several Myr (animation (b)). The ‘long-lived’ nature of these structures and the tendency of the environment to evolve to a denser state as a function of time with the aid of gravity (Kirk et al., 2015) allow for the filament-environment co-evolution scenario implied in Fig. 2. The similarities of the average filament properties with those expected from an equilibrium configuration would still be compatible with evolution if such configuration is established locally by the pressure balance with the evolving environment, and in timescales much shorter than that of large scale collapse of the region. This scenario would also explain the better agreement of equilibrium-based estimates with supercritical filaments at moderate densities, and the larger differences with the most diffuse (some likely dispersing) and the very dense (fast evolving) structures.
A final piece of evidence in support of the large scale gravitationally driven scenario in the formation of supercritical filaments in molecular clouds is found in the filament profile change as a function of time presented in Paper I. The tendency of filaments to develop pronounced wing components (Mline,wing), relative to their filament cores (Mline,core), as they approach supercritical state is reminiscent of the behaviour shown by collapsing cores within a collapsing cloud in the models from Naranjo-Romero et al. (2015). A similar behaviour for the ‘large-scale’ (filament) component of the core is likely, due to it being an intrinsic part of the filament structure itself.
The observational model inferred by our Herschel observations therefore not only provides a self-consistent picture in agreement with simulations, but it also agrees well with the model of dynamic star formation and the presence of a spread in stellar ages in star-forming regions (e.g., Hartmann et al., 2012; Zamora-Avilés et al., 2012). We note, however, that the fate of the filament will depend on how, where, and when the filament is formed, and not all filaments are destined to become supercritical. In a relatively constant diffuse environment (e.g., off-cloud locations and diffuse ISM, high-galactic latitudes), filaments will be quiescent and barely self-gravitating. Evolution and collapse by self-gravity of primordially low-mass filaments in these environments can be prevented by stabilising processes and by the limited accretion arising from their weak gravitational potential and the low availability of material. These structures would therefore be predominantly transient, expanding and dispersing before the onset of star-formation. For many of these low-mass filaments, the lack of significant accretion would be consistent with the small internal velocity dispersion observed in molecular observations (Arzoumanian et al., 2013). Triggering could instead be the key driver leading to star-formation in low column density environments where gravity cannot initially play a significant role, and where wing development and accretion are therefore severely limited.
Ultimately, filament formation and evolution is a complex interplay of intrinsic and environmental conditions, most likely driven by out-of-equilibrium processes, and results from the Herschel datasets should be put in context with complementary observational studies in order to develop a full model of star formation in filaments. Molecular line observations will be particularly needed to constrain the dynamical state of the filament and its environment. Such observations are critical in order to fully validate the proposed co-evolution model.
Massive supercritical filaments (and their subcritical progenitors) could also exhibit other exclusive properties not traced by our data. Our results, for instance, do not exclude the possibility of magnetic fields playing an important role in filament formation. The orientation of magnetic fields has been observed to be linked to column density (e.g., Planck Collaboration et al., 2016a, b; Malinen et al., 2015), with star-forming filaments having a preferred axis orientation with respect to the local magnetic field (e.g., André et al., 2014). Similarly, the uncertainty level of our width measurements relative to the small changes between the different Regimes implies that results should be taken with caution when trying to identify a characteristic width behaviour for our (scarce) supercritical sample. A more significant sample of core-dominated supercritical filaments, combined with higher resolution observations and numerical simulations, will aid in further constraining the physical conditions and timescales associated with the evolution of filaments already in supercritical state and actively forming new stars.
6 Conclusions
A subsample of Herschel fields of the Galactic Cold Cores Programme at pc have been used to investigate the observational signatures associated with the onset of star formation in filaments.
Filaments in different environments were identified and extracted with the getfilaments algorithm. Physical properties (linear mass density, width, crest column density), as well as the structural components of the filament (the ‘core’ innermost region and the ‘wing’ power-law like component at large radii of the filament profile) were quantified as described in Paper I. The characteristics derived from the profile fitted with a Plummer-like function were investigated as a function of environment and stability (Mline,tot). The analysis was performed in order to constrain an observationally-based evolutionary model from a subcritical to a supercritical (unstable) state that can be put in context with theoretical models of filament formation and evolution.
The combination of local environment and Mline,core at a given time has a critical role in determining the evolutionary path and ultimate fate (star-forming potential) of a given filament in Myr. Only strongly self-gravitating structures with a relative massive core component associated with a dense environment ( mag) have the potential for becoming supercritical and star-forming in timescales comparable to the observed lifetime of prestellar sources. Filament evolution via mass assembly progresses with little changes in filament average width (FWHM pc). Low-mass filaments in diffuse environments tend to increase their FWHM with time, while self-gravitating filaments in denser regions contract or evolve at similar width during the transition to supercriticality.
Our proposed observationally-based model for the formation of supercritical star-forming filaments has been compared with predictions from numerical models of filament evolution. While filamentary properties for filaments in relatively dense media are similar to those predicted for pressure-confined filaments in equilibrium, the non-negligible differences with respect to the Herschel measurements and the simultaneous growth of the filament linear mass density with its environment with time implied by the Herschel data are more consistent with dynamical models of cloud evolution. The filamentenvironment coevolution scenario is an intrinsic feature of filaments in clouds undergoing large scale collapse. Those structures formed in the potential wells that emerge during the convergent inflow motions benefit from enhanced accretion and efficient mass assembly. The physical changes of filaments during the subcritical-supercritical transition predicted by simulations are quantitatively consistent with those derived from observations.
While the average properties of a filament population can reveal clues as to their formation and evolution, the dispersion of filament properties observed in the GCC fields remains significant. Similarly, the feasibility of the evolutionary paths considered are highly dependent on the established assumptions, and the evolution itself can also be highly dependent on external conditions, such as Galactic position and physical processes forming the filament. A complete understanding of filament structure and evolution must not only investigate the impact of processes such as shocks, turbulence, and magnetic fields, together with gravity, but the observed properties must also be put in context with local environment, star-forming activity, and history of the region. In-depth studies of these properties, even for individual fields, will be key for understanding the wide diversity of the filament population.
Acknowledgements.
A.R-I. is currently a Research Fellow at ESA/ESAC and acknowledges support from the ESA Internal Research Fellowship Programme. The authors would like to thank Enrique Vázquez-Semadeni for his in-depth study of our results and detailed discussions which have greatly improved the content and presentation of this work. We are also grateful to Joerg Fischera for providing valuable insight for the interpretation of filament models. We thank PCMI for its general support to the ‘Galactic Cold Cores’ project activities. J.M. and V.-M.P. acknowledge the support of Academy of Finland grant 250741. M.J. acknowledges the support of Academy of Finland grants 250741 and 1285769, as well as the Observatoire Midi-Pyrenees (OMP) in Toulouse for its support for a 2 months stay at IRAP in the frame of the ‘OMP visitor programme 2014’. L.V.T. acknowledges OTKA grants NN111016 and K101393. We also thank J. Fischera, D. Arzoumanian, E. Falgarone, and P. André for useful discussions. SPIRE has been developed by a consortium of institutes led by Cardiff Univ. (UK) and including: Univ. Lethbridge (Canada); NAOC (China); CEA, LAM (France); IFSI, Univ. Padua (Italy); IAC (Spain); Stockholm Observatory (Sweden); Imperial College London, RAL, UCL-MSSL, UKATC, Univ. Sussex (UK); and Caltech, JPL, NHSC, Univ. Colorado (USA). This development has been supported by national funding agencies: CSA (Canada); NAOC (China); CEA, CNES, CNRS (France); ASI (Italy); MCINN (Spain); SNSB (Sweden); STFC, UKSA (UK); and NASA (USA). PACS has been developed by a consortium of institutes led by MPE (Germany) and including UVIE (Austria); KU Leuven, CSL, IMEC (Belgium); CEA, LAM (France); MPIA (Germany); INAF-IFSI/OAA/OAP/OAT, LENS, SISSA (Italy); IAC (Spain). This development has been supported by the funding agencies BMVIT (Austria), ESA-PRODEX (Belgium), CEA/CNES (France), DLR (Germany), ASI/INAF (Italy), and CICYT/MCYT (Spain).References
- André et al. (2014) André, P., Di Francesco, J., Ward-Thompson, D., et al. 2014, Protostars and Planets VI, 27
- André et al. (2010) André, P., Men’shchikov, A., Bontemps, S., et al. 2010, A&A, 518, L102
- Arzoumanian et al. (2011) Arzoumanian, D., André, P., Didelon, P., et al. 2011, A&A, 529, L6
- Arzoumanian et al. (2013) Arzoumanian, D., André, P., Peretto, N., & Könyves, V. 2013, A&A, 553, A119
- Ballesteros-Paredes et al. (2011) Ballesteros-Paredes, J., Vázquez-Semadeni, E., Gazol, A., et al. 2011, MNRAS, 416, 1436
- Bohlin et al. (1978) Bohlin, R. C., Savage, B. D., & Drake, J. F. 1978, ApJ, 224, 132
- Burkert & Hartmann (2004) Burkert, A. & Hartmann, L. 2004, ApJ, 616, 288
- Duarte-Cabral et al. (2011) Duarte-Cabral, A., Dobbs, C. L., Peretto, N., & Fuller, G. A. 2011, A&A, 528, A50
- Fischera & Martin (2012) Fischera, J. & Martin, P. G. 2012, A&A, 542, A77
- Gómez & Vázquez-Semadeni (2014) Gómez, G. C. & Vázquez-Semadeni, E. 2014, ApJ, 791, 124
- Griffin et al. (2010) Griffin, M. J., Abergel, A., Abreu, A., et al. 2010, A&A, 518, L3+
- Hacar et al. (2013) Hacar, A., Tafalla, M., Kauffmann, J., & Kovács, A. 2013, A&A, 554, A55
- Hartmann et al. (2001) Hartmann, L., Ballesteros-Paredes, J., & Bergin, E. A. 2001, ApJ, 562, 852
- Hartmann et al. (2012) Hartmann, L., Ballesteros-Paredes, J., & Heitsch, F. 2012, MNRAS, 420, 1457
- Hartmann & Burkert (2007) Hartmann, L. & Burkert, A. 2007, ApJ, 654, 988
- Heitsch (2013) Heitsch, F. 2013, ApJ, 769, 115
- Heitsch et al. (2009) Heitsch, F., Ballesteros-Paredes, J., & Hartmann, L. 2009, ApJ, 704, 1735
- Heitsch & Hartmann (2008) Heitsch, F. & Hartmann, L. 2008, ApJ, 689, 290
- Heitsch & Hartmann (2014) Heitsch, F. & Hartmann, L. 2014, MNRAS, 443, 230
- Heitsch et al. (2008a) Heitsch, F., Hartmann, L. W., & Burkert, A. 2008a, ApJ, 683, 786
- Heitsch et al. (2008b) Heitsch, F., Hartmann, L. W., Slyz, A. D., Devriendt, J. E. G., & Burkert, A. 2008b, ApJ, 674, 316
- Hennebelle (2013) Hennebelle, P. 2013, A&A, 556, A153
- Hennebelle & André (2013) Hennebelle, P. & André, P. 2013, A&A, 560, A68
- Hennemann et al. (2012) Hennemann, M., Motte, F., Schneider, N., et al. 2012, A&A, 543, L3
- Hildebrand (1983) Hildebrand, R. H. 1983, QJRAS, 24, 267
- Ibáñez-Mejía et al. (2016) Ibáñez-Mejía, J. C., Mac Low, M.-M., Klessen, R. S., & Baczynski, C. 2016, ApJ, 824, 41
- Inutsuka & Miyama (1992) Inutsuka, S.-I. & Miyama, S. M. 1992, ApJ, 388, 392
- Juvela et al. (2012) Juvela, M., Ristorcelli, I., Pagani, L., et al. 2012, A&A, 541, A12
- Kirk et al. (2015) Kirk, H., Klassen, M., Pudritz, R., & Pillsworth, S. 2015, ApJ, 802, 75
- Malinen et al. (2015) Malinen, J., Montier, L., Montillaud, J., et al. 2015, ArXiv e-prints [arXiv:1512.03775]
- Men’shchikov (2013) Men’shchikov, A. 2013, A&A, 560, A63
- Men’shchikov et al. (2012) Men’shchikov, A., André, P., Didelon, P., et al. 2012, A&A, 542, A81
- Miville-Deschênes et al. (2010) Miville-Deschênes, M.-A., Martin, P. G., Abergel, A., et al. 2010, A&A, 518, L104
- Montillaud et al. (2015) Montillaud, J., Juvela, M., Rivera-Ingraham, A., et al. 2015, A&A, 584, A92
- Naranjo-Romero et al. (2015) Naranjo-Romero, R., Vázquez-Semadeni, E., & Loughnane, R. M. 2015, ApJ, 814, 48
- Nutter et al. (2008) Nutter, D., Kirk, J. M., Stamatellos, D., & Ward-Thompson, D. 2008, MNRAS, 384, 755
- Palmeirim et al. (2013) Palmeirim, P., André, P., Kirk, J., et al. 2013, A&A, 550, A38
- Peretto et al. (2013) Peretto, N., Fuller, G. A., Duarte-Cabral, A., et al. 2013, A&A, 555, A112
- Pilbratt et al. (2010) Pilbratt, G. L., Riedinger, J. R., Passvogel, T., et al. 2010, A&A, 518, L1
- Planck Collaboration et al. (2016a) Planck Collaboration, Adam, R., Ade, P. A. R., et al. 2016a, A&A, 586, A135
- Planck Collaboration et al. (2016b) Planck Collaboration, Ade, P. A. R., Aghanim, N., et al. 2016b, A&A, 586, A138
- Poglitsch et al. (2010) Poglitsch, A., Waelkens, C., Geis, N., et al. 2010, A&A, 518, L2+
- Rivera-Ingraham et al. (2015) Rivera-Ingraham, A., Martin, P. G., Polychroni, D., et al. 2015, ApJ, 809, 81
- Rivera-Ingraham et al. (2016) Rivera-Ingraham, A., Ristorcelli, I., Juvela, M., et al. 2016, A&A, 591, A90
- Roussel (2013) Roussel, H. 2013, PASP, 125, 1126
- Schisano et al. (2014) Schisano, E., Rygl, K. L. J., Molinari, S., et al. 2014, ApJ, 791, 27
- Schneider et al. (2010) Schneider, N., Csengeri, T., Bontemps, S., et al. 2010, A&A, 520, A49
- Smith et al. (2014) Smith, R. J., Glover, S. C. O., & Klessen, R. S. 2014, MNRAS, 445, 2900
- Smith et al. (2016) Smith, R. J., Glover, S. C. O., Klessen, R. S., & Fuller, G. A. 2016, MNRAS, 455, 3640
- Tafalla & Hacar (2015) Tafalla, M. & Hacar, A. 2015, A&A, 574, A104
- Toalá et al. (2012) Toalá, J. A., Vázquez-Semadeni, E., & Gómez, G. C. 2012, ApJ, 744, 190
- Van Loo et al. (2014) Van Loo, S., Keto, E., & Zhang, Q. 2014, ApJ, 789, 37
- Vázquez-Semadeni et al. (2007) Vázquez-Semadeni, E., Gómez, G. C., Jappsen, A. K., et al. 2007, ApJ, 657, 870
- Vázquez-Semadeni et al. (2009) Vázquez-Semadeni, E., Gómez, G. C., Jappsen, A.-K., Ballesteros-Paredes, J., & Klessen, R. S. 2009, ApJ, 707, 1023
- Whitworth & Ward-Thompson (2001) Whitworth, A. P. & Ward-Thompson, D. 2001, ApJ, 547, 317
- Zamora-Avilés et al. (2012) Zamora-Avilés, M., Vázquez-Semadeni, E., & Colín, P. 2012, ApJ, 751, 77