X-ray diagnostics of massive star winds
Abstract
Observations with powerful X-ray telescopes, such as XMM-Newton and Chandra, significantly advance our understanding of massive stars. Nearly all early-type stars are X-ray sources. Studies of their X-ray emission provide important diagnostics of stellar winds. High-resolution X-ray spectra of O-type stars are well explained when stellar wind clumping is taking into account, providing further support to a modern picture of stellar winds as non-stationary, inhomogeneous outflows. X-ray variability is detected from such winds, on time scales likely associated with stellar rotation. High-resolution X-ray spectroscopy indicates that the winds of late O-type stars are predominantly in a hot phase. Consequently, X-rays provide the best observational window to study these winds. X-ray spectroscopy of evolved, Wolf-Rayet type, stars allows to probe their powerful metal enhanced winds, while the mechanisms responsible for the X-ray emission of these stars are not yet understood.
keywords:
stars: atmospheres, stars: early-type, stars: mass loss, stars: winds, outflows,1 Introduction
Stars across the Hertzsprung-Russell diagram (HRD) emit X-rays. The quiescent X-ray luminosity of coronal type stars, like our own Sun, is less than one per cent of their bolometric luminosity, . The X-ray luminosity of massive stars () constitutes even smaller fraction of their bolometric luminosity with only [Pallavicini, et al.(1981), (Pallavicini et al. 1981)]. Yet, despite this small output, X-rays provide invaluable diagnostics of massive star winds.
While it is not yet firmly established which physical processes lead to the generation of hot plasma emitting X-rays, the observational properties of X-ray emission from massive stars are well known [(Waldron & Cassinelli (2007)), (Waldron & Cassinelli 2007)]. The X-ray spectra are dominated by strong emission lines, and are consistent with being produced by fast expanding hot optically thin plasma. Spectral diagnostics indicate that the hot plasma observed in the X-ray band is permeated with the cool stellar wind best observed at UV wavelengths.
The classical diagnostics of OB star winds is provided by the modeling of their UV spectra. In stars with strong winds, the resonance lines of metal ions usually exhibit P Cygni type profiles. Fitting these lines with a model, e.g. based on the Sobolev approximation [Hamann (1981), (Hamann 1981)], provides information on the product of mass-loss rate, , and the ionization fraction. Only when the ionization fraction is well constrained, one can reliably estimate mass-loss rates. It was, however, noticed early that X-ray photons in stellar wind serve as additional source of ionization of metal ions, chiefly via Auger process [Cassinelli & Olson (1979), (Cassinelli & Olson 1979)]. This effect is often referred to as “superionization”. Therefore, to measure mass-loss rates, especially from stars with weaker winds, the calculations of ionization balance shall account for the influence of X-rays. [Oskinova et al.(2011), Oskinova et al. (2011)] studied the UV spectra of a sample of B-type stars. The observed spectra were modeled with the non-LTE stellar atmosphere model PoWR that accounts for the X-ray radiation. From comparison between models and observations, it was found that the winds of the stars in our sample are quite weak. The wind velocities do not exceed the escape velocity. The X-rays strongly affect the ionization structure of these winds. But this effect does not significantly reduce the total radiative acceleration. Even when X-rays are accounted for, there is still sufficient radiative acceleration to drive a stronger mass-loss than empirically inferred from fitting the UV resonance lines. These findings are in line with conclusions reached by [Prinja, R., K. (1989), Prinja (1989)].
2 The “weak wind problem”
Weak winds are also encountered in late O-type dwarfs [(Marcolino et al. (2009), (Marcolino et al. (2009)]. [Lucy, L. B. (2012), Lucy (2012)] suggested a model explaining the low mass-loss rates empirically derived for OB dwarfs. He proposed that shock-heating increases the temperature of the gas, leading to a temperatures of a few MK. The single component flow coasts to high velocities as a pure coronal wind. The model predicts that the bulk of stellar wind is hot. Only some small fraction of the wind remains cold and is embedded in the hot wind.
To study the wind of a typical O9V star, we analyzed high-resolution X-ray spectra of Col [Huenemoerder, Oskinova, Ignace, et al. (2012), (Huenemoerder et al. 2012)]. The analysis of the spectra did not reveal any significant traces of absorption of X-rays by the cool wind component, in agreement with Lucy’s prediction. The analyses of line ratios of He-like ions revealed that the hot matter is present already in the inner wind. On the other hand, the X-ray emission lines are broadened up to terminal wind velocity, . The shape of the X-ray emission line profiles can be well described as originating from a hot plasma expanding with a usual -velocity law. Moreover, the emission measure of the hot wind component is quite large, exceeding that of the cool wind. Considered together, these findings point out that the winds of O-dwarfs likely are predominantly in the hot phase, while the cool gas seen in the optical and UV constitutes only a minor wind fraction. Hence, the best observational window for studies of OB dwarfs is provided by X-rays.
3 X-ray pulsations in massive stars
Monitoring X-ray observations allow to study wind variability. Observations of pulsating B-type stars provide excellent means to investigate the links between stellar wind and stellar interior. Young B0-B2 type stars that are still burning hydrogen in their cores oscillate with periods of a few hours and are known as Cephei-type variables [Dziembowski & Pamiatnykh (1993), (Dziembowski & Pamiatnykh 1993)].
Recently, it has been shown that the X-ray emission from the magnetic star CMa pulsates in phase with the optical [Oskinova et al.(2014), (Oskinova et al. 2014)]. Strong phase dependent variability was also detected in the high-resolution X-ray spectrum. The variability in N vii Å line was attributed to changes in wind ionization structure with stellar pulsational phase. Spectral diagnostics revealed that the hot X-ray emitting plasma is located very close to the stellar photosphere. The physical mechanism causing the X-ray pulsations is not yet known, but one may speculate that surface magnetic fields may be involved in coupling the wind to subphotospheric layers. Coming X-ray and UV observations of a representative sample of Cephei variables will shed more light on this question.
4 X-ray variability of OB supergiants
Coherent and periodic variability is commonly observed in the UV lines of OB supergiants [Kaper et al. (1999), (Kaper et al. 1999)]. This variability is likely explained by the existence of corotating interaction regions (CIRs) in stellar winds [Mullan (1984), hamann2001, (Mullan 1984, Hamann et al. 2001)]. [Cranmer & Owocki (1996), Cranmer & Owocki (1996)] showed that CIRs could result from bright stellar spots. [Ramiaramanantsoa et al. (2014), Ramiaramanantsoa et al. (2014)] detected corotating bright spots on Per and suggested that they are generated via a breakout of a global magnetic field generated by subsurface convection. The CIRs may also be triggered by the (non)radial pulsations of the stellar surface [Lobel & Blomme (2008), (Lobel & Blomme 2008)].
[Oskinova et al. (2001), Oskinova et al. (2001)] found the X-ray light-curve of the O-type dwarf Oph being modulated on the rotation time scale, with a period similar to the one observed in UV lines. Similar conclusions on X-ray variability in O stars were reached by [Massa et al. (2014), Massa et al. (2014)] who analyzed X-ray observations of Per (O7.5III) obtained with the Chandra X-ray telescope and contemporaneous H observations. The X-ray flux was found to vary by %, but not in phase with the H variability. The observations were not long enough to establish periodicity.
Among the O-stars best monitored in X-rays is the O4 supergiant Pup. The XMM-Newton X-ray telescope observed it from time to time during a decade. Analysis of the obtained light curves revealed variations with an amplitude of % on a time scale longer than 1 d, while no coherent periodicity was detected [(Nazé et al. 2013), (Nazé et al. 2013)]. Interestingly, [Howarth & Stevens (2014), Howarth & Stevens (2014)] reported a period of d in optical photometry of this star, which they attributed to stellar pulsations.
In another O-type supergiant, Cep (O6.5I(n)), the X-ray flux also varies by % on timescales of days, possibly modulated with the same period as the H emission [(Rauw et al. 2015), (Rauw et al. 2015)]. The analysis of archival XMM-Newton observations of Ori (O7I) shows that the X-ray variability of this star has similar properties to that of Cep and Pup. X-ray variability with analogous character was found in Ori (O9.5II+B1V) from Chandra observations, where periodic fluctuations (not associated with its binary period) were identified [(Nichols et al. 2015), (Nichols et al. 2015)]. Even Wolf-Rayet (WR) stars with very strong winds show modulations in their X-ray emission on the rotation timescale [(Ignace et al. 2013), (Ignace et al. 2013)]. Summarizing, the evidence for X-ray variability on rotation time-scale is accumulating. This points to an association between X-ray emission, large scale structures in the stellar wind, and stellar spots.
5 X-ray emission lines in spectra of OB supergiants
Over the last decade, the analysis of emission lines observed in X-ray spectra has become a common tool for stellar wind studies. The profile of an emission line originating from an optically thin expanding shell was derived by [Macfarlane et al. (1991), Macfarlane et al. (1991)]. It was shown that continuum absorption in the stellar wind leads to characteristically blue-shifted and skewed line profiles, and suggested that the “skewness” of a line could be used to estimate the wind column density. This model was further extended and applied to X-ray emission line profiles [Waldron & Cassinelli (2001), Owocki & Cohen (2001), Ignace (2001), (Waldron & Cassinelli 2001, Owocki & Cohen 2001, Ignace 2001)]. Stellar wind clumping was included in the modeling by [Feldmeier et al. (2003), Feldmeier et al. (2003)]. They showed shown that clumping reduces the effective wind opacity and affects the shape of the emission line profiles. In general, lines emerging from clumped winds are less skewed than those produced in homogeneous winds even when the mass-loss rates are the same [(Oskinova et al. 2006), (Oskinova et al. 2006)].
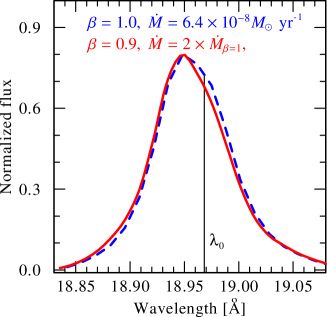
Besides continuum absorption and wind clumping, the shape of an X-ray emission line also depends on the assumed velocity field (as illustrated in Figure 1), wind geometry, abundances, ionization balance, hot plasma distribution, onset of X-ray emission and resonance scattering in the hot plasma. This incomplete list shows that, contrary to claims in the literature, it is hardly possible to derive just one parameter, such as mass-loss rate, from fitting the shapes of X-ray emission lines by simplistic models.
On the other hand, X-ray spectroscopy complemented by the analysis of UV and optical spectra using non-LTE stellar atmosphere models is a valuable tool to constrain stellar wind properties [Hervé et al. (2013), Puebla et al. 2016, (Hervé et al. 2013, Puebla et al. 2016)]. E.g., [Shenar et al. (2015), Shenar et al. (2015)] applied PoWR non-LTE stellar atmospheres for the analysis of X-ray, optical, and UV spectra of the O star Ori. It was possible to reproduce the UV and optical spectra as well as the X-ray emission lines consistently, and thus derive realistic wind parameters.
6 X-ray emission from blue hypergiants and Wolf-Rayet stars
Among those stars with the most powerful stellar winds are the blue hypergiants and the WR stars. X-ray spectroscopy provides interesting insights to their stellar winds.
Recently, we analyzed the X-ray spectrum of one of the most massive and luminous stars in the Milky Way, Cyg OB2-12 ((B3Ia+), obtained with the Chandra X-ray telescope. The analysis was complemented by modeling, using the PoWR atmosphere model (Oskinova et al., in prep.).
It was shown that the X-ray spectrum of Cyg OB2-12 is produced in a hot plasma with temperatures in excess of 15 MK. Given that the stellar wind of this star is rather slow, km s-1, it is difficult to explain high temperature by intrinsic wind shocks. From the ratio of fluxes in forbidden and intercombination lines in He-like ions followed that that the X-ray emitting plasma has quite a high density. Furthermore, the broadening of X-ray emission lines exceeds the one due to the stellar wind velocity. Taken together, these facts are best explained by a colliding winds scenario. Further support to the binary hypothesis is provided by the recent identification of a companion in the Cyg OB2-12 system [Maryeva et al. (2016), (Maryeva et al. 2016, and ref. therein)].
The low-resolution X-ray spectra of WR stars are well described by thermal plasmas with temperatures between 1 MK up to 50 MK [(Ignace et al. (2003), (Ignace et al. 2003, and ref. therein)]. High-resolution X-ray spectra are available so far only for one single WR star - EZ CMa (WR 6) [(Oskinova et al. (2012), (Oskinova et al. 2012)]. Their analysis shows that hot plasma exists far out in the wind. The X-ray emission lines are broad and strongly skewed (just as predicted by the [Macfarlane et al. (1991), Ignace (2001), Macfarlane et al. (1991) and Ignace (2001) models)] being consistent with plasma expanding with constant velocity. The abundances derived from the X-ray spectra are strongly non-solar, in accordance with the advanced evolutionary state of WR stars [Huenemoerder et al. (2015), (Huenemoerder et al. 2015)]. How X-rays are generated in winds of single WR stars is not yet understood. It is possible that, like in O type stars, X-ray generation is an intrinsic ingredient of the stellar wind driving [Gayley 2016, (Gayley 2016)].
To conclude, X-ray observations provide important diagnostics of massive stars and their winds at nearly all evolutionary stages.
References
- [Cassinelli & Olson (1979)] Cassinelli, J. P., Olson, G. L., 1979, ApJ, 229, 304
- [Cohen et al. (2014)] Cohen, D. H., Wollman, E. E., Leutenegger, M., et al., 2014, MNRAS, 439, 908
- [Cranmer & Owocki (1996)] Cranmer, S. R., Owocki, S.P., 1996, ApJ, 462, 469
- [Dziembowski & Pamiatnykh (1993)] Dziembowski, W. A., Pamiatnykh, A. A., 1993, MNRAS, 262, 204
- [Feldmeier et al. (2003)] Feldmeier, A.; Oskinova, L.; Hamann, W.-R., 2003, A&A, 403, 217
- [Gayley 2016] Gayley, K. G., 2016, AdSpR, 58, 719
- [Hamann (1981)] Hamann, W.-R., 1981, A&A, 93, 353
- [Hamann et al. (2001)] Hamann, W.-R., Brown, J. C., Feldmeier, A., et al., 2001, A&A, 378, 946
- [Hervé et al. (2013)] Hervé, A.; Rauw, G.; Nazé, Y., 2013, A&A, 551, 83
- [Howarth & Stevens (2014)] Howarth, I. D., Stevens, Ian R., 2013, MNRAS, 445, 287
- [Huenemoerder, Oskinova, Ignace, et al. (2012)] Huenemoerder, D. P., Oskinova, L. M., Ignace, R., et al., 2012, ApJ, 756, 34
- [Huenemoerder et al. (2015)] Huenemoerder, D. P., Gayley, K. G., Hamann, W.-R., et al., 2015, ApJ, 815, 29
- [Ignace (2001)] Ignace, R., 2001, ApJ, 549, 119
- [(Ignace et al. (2003)] Ignace, R.; Oskinova, L. M.; Brown, J. C., 2003, A&A, 408, 353
- [(Ignace et al. 2013)] Ignace, R., Gayley, K. G., Hamann, W.-R., et al. 2013, ApJ, 775, 29
- [Kaper et al. (1999)] Kaper, L., Henrichs, H. F., Nichols, J. S., et al., 1999, A&A, 344, 312
- [Lobel & Blomme (2008)] Lobel, A., Blomme, R., 2008, ApJ, 678, 408
- [Lucy, L. B. (2012)] Lucy, L. B., 2012, A&A, 544, 120
- [Macfarlane et al. (1991)] Macfarlane, J. J.; Cassinelli, J. P.; Welsh, B. Y., et al., 1991, ApJ, 380, 564
- [(Marcolino et al. (2009)] Marcolino, W. L. F., Bouret, J.-C., Martins, F., et al., 2009, A&A, 498, 837
- [Maryeva et al. (2016)] Maryeva, O. V., Chentsov, E. L., Goranskij, V. P., et al., 2016, MNRAS, 458, 491
- [Massa et al. (2014)] Massa, D., Oskinova, L., Fullerton, A. W., et al., 2014, MNRAS, 441, 2173
- [Mullan (1984)] Mullan, D. J., 1984, ApJ, 283, 303
- [(Nazé et al. 2013)] Nazé, Y., Oskinova, L. M., Gosset, E., 2013, ApJ, 763, 143
- [(Nichols et al. 2015)] Nichols, J., Huenemoerder, D. P., Corcoran, M. F., et al., 2015, ApJ, 809, 133
- [Oskinova et al. (2001)] Oskinova, L. M., Clarke, D., Pollock, A. M. T., 2001, A&A, 378, 21
- [(Oskinova et al. 2006)] Oskinova, L. M., Feldmeier, A., Hamann, W.-R., 2006, A&A, 372, 313
- [Oskinova et al.(2011)] Oskinova, L. M., Todt, H., Ignace, R., et al., 2011, MNRAS, 416, 1456
- [(Oskinova et al. (2012)] Oskinova, L. M., Gayley, K. G., Hamann, W.-R., et al., 2012, ApJ, 747, 25
- [Oskinova et al.(2014)] Oskinova, L. M., Nazé, Y., Todt, H., et al., 2014, Nature Communications, 5, 4024
- [Owocki & Cohen (2001)] Owocki, S.P., Cohen, D. H., 2001, ApJ, 559, 1108
- [Puebla et al. 2016] Puebla, R. E., Hillier, D. J., Zsargó, J., et al., 2015, MNRAS, 456, 2907
- [Ramiaramanantsoa et al. (2014)] Ramiaramanantsoa, T., Moffat, A. F. J., Chené, A.-N., et al., 2014, MNRAS, 441, 910
- [(Rauw et al. 2015)] Rauw, G., Hervé, A., Nazé, Y., et al., 2015, A&A, 580, 59
- [Shenar et al. (2015)] Shenar, T., Oskinova, L., Hamann, W.-R., et al., 2015, ApJ, 809, 135
- [Pallavicini, et al.(1981)] Pallavicini, R., Golub, L., Rosner, R., et al., 1981, ApJ, 248, 279
- [Prinja, R., K. (1989)] Prinja, R. K., 1989, MNRAS, 241, 721
- [Waldron & Cassinelli (2001)] Waldron, W. L., Cassinelli, J. P., 2001, ApJ, 548, 45
- [(Waldron & Cassinelli (2007))] Waldron, W. L., Cassinelli, J. P., 2007, ApJ, 668, 456