Atomic and Molecular Absorption in Redshifted Radio Sources
Abstract
We report on a survey for associated H i 21-cm and OH 18-cm absorption with the Giant Metrewave Radio Telescope at redshifts . Although the low redshift selection ensures that our targets are below the critical ultra-violet luminosity ( W Hz-1), which is hypothesised to ionise all of the neutral gas in the host galaxy, we do not obtain any detections in the six sources searched. Analysing these in context of the previous surveys, in addition to the anti-correlation with the ultra-violet luminosity (ionising photon rate), we find a correlation between the strength of the absorption and the blue – near-infrared colour, as well as the radio-band turnover frequency. We believe that these are due to the photo-ionisation of the neutral gas, an obscured sight-line being more conducive to the presence of cold gas and the compact radio emission being better intercepted by the absorbing gas, maximising the flux coverage, respectively. Regarding the photo-ionisation, the compilation of the previous surveys increases the significance of the critical ionising photon rate, above which all of the gas in the host galaxy is hypothesised to be ionised ( sec-1), to . This reaffirms that this is an ubiquitous effect, which has profound implications for the detection of neutral gas in these objects with the Square Kilometre Array.
keywords:
galaxies: active – quasars: absorption lines – radio lines: galaxies – ultra violet: galaxies – galaxies: fundamental parameters – galaxies: ISM1 Introduction
Redshifted H i 21-cm absorption can provide an excellent probe of the contents and nature of the early Universe, through surveys which are not subject to the same flux and redshift constraints suffered by optical studies. For instance, measurement of the contribution of the neutral gas content to the mass density of the Universe at redshifts (), where the Lyman- transition is not accessible to ground-based optical telescopes. This corresponds to the past 10 Gyr of cosmic history, which are of particular interest since this is when star formation was at its most vigorous and the stellar mass density in the Universe increased by more than a factor of four (Hopkins & Beacom, 2006). There is, however, mounting evidence that the star formation history is not best traced by intervening galaxies, detected in the Lyman- absorption of a background continuum source:
-
1.
While the star formation history exhibits a strong evolution (e.g. Hopkins & Beacom 2006; Lagos et al. 2014), the neutral gas content in damped Lyman- absorption systems (DLAs)111Intervening systems where the neutral hydrogen column density exceeds ., remains approximately constant with look-back time (e.g. Rao et al. 2006; Braun 2012).
- 2.
-
3.
The heavy element content of DLAs does not appear to be caused by star formation within the absorbers themselves, but possibly deposited via winds from nearby galaxies (Fukugita & Ménard, 2015).
- 4.
Therefore, in order to fully investigate any relation between the evolution of cold neutral gas and the star formation history, we should also quantify the population of sources in which the absorption is associated with the continuum source itself.
The detection of H i 21-cm is of further interest as the comparison of its redshift with that of other transitions has the potential to measure past values of the fundamental constants of nature (Tzanavaris et al. 2005, 2007), which may exhibit a spatial (Berengut et al., 2011; Webb et al., 2011), as well as a temporal (Murphy et al., 2003) variation. Radio data can yield at least an order of magnitude in precision in the measurement of the constants over the optical data (see Curran et al. 2004a). Furthermore, the OH radical can not only provide measurements of various combinations of constants through comparison with optical, H i or rotational (millimetre) transitions, but inter-comparison of the hyperfine 18-cm transitions can remove the systematics introduced by the possible velocity offsets present between species (Darling, 2003). However, the number of redshifted OH absorption systems remains a paltry five, all of which are at a redshifts of (Wiklind & Combes 1994, 1995, 1996, 1998; Chengalur et al. 1999; Kanekar & Chengalur 2002; Kanekar et al. 2003, 2005).
In addition to these, molecular absorption has also been detected in 25 DLAs, through vibrational transitions redshifted into the optical band at (compiled in Srianand et al. 2010 with the addition of Reimers et al. 2003; Fynbo et al. 2011; Guimarães et al. 2012; Srianand et al. 2012; Noterdaeme et al. 2015, 2017). However, extensive millimetre-wave observations have yet to detect absorption from any rotational molecular transition (e.g. Curran et al. 2004b), leading us to suspect that the choice of optically bright objects selects against dusty environments, which are more likely to harbour molecules in abundance. This is apparent when one compares the DLAs in which H2 has been detected, which have molecular fractions and optical – near-infrared colours of (Curran et al., 2011), with the five known OH absorbers, where and (Curran et al., 2006). This is a strong indicator that the reddening is due to dust, which protects the molecular gas from the ambient ultra-violet radiation.
Therefore by selecting very red objects, with colours of , we may expect OH column densities which can be detected with current large radio telescopes. However, there exists an additional constraint when searching for absorption by gas in the hosts of radio galaxies and quasars – specifically, that neutral hydrogen has never been detected where the ultra-violet ( Å) luminosity of the source exceeds W Hz-1. This “critical” luminosity applies to all redshifts for various heterogeneous (unbiased) samples, as seen through the non-detection of H i 21-cm absorption at W Hz-1 by Curran et al. (2008, 2011a, 2013b, 2013c, 2016a); Allison et al. (2012); Geréb et al. (2015); Aditya et al. (2016); Grasha et al. (2017). This is interpreted as the flux limited optical spectroscopic surveys, which yield the redshift, selecting the most ultra-violet luminous objects at high redshift (Curran et al., 2008), where the corresponding ionising photon rates of sec-1 are sufficient to ionise all of the neutral gas in a large spiral galaxy (Curran & Whiting, 2012).222Aditya et al. (2017) have recently detected H i 21-cm absorption at in TXS 1954+513, which they claim has an ultra-violet luminosity of W Hz-1. Although unreliable, this luminosity is still consistent with the critical value (see Sect. 3.1).
At the vast majority of radio sources for which redshifts are available are believed to have luminosities above the critical value (see figure 4 of Morganti et al. 2015). Thus, in order to increase the associated absorption statistics, we can select from the large population of radio sources of known redshift at with .333The magnitudes are generally more available than the , as well as being given in the Parkes Half-Jansky Flat-spectrum Sample catalogue (Drinkwater et al., 1997). This should yield UV luminosities below the critical W Hz-1 in the 1400 MHz band (, see figure 1 of Curran et al. 2013c). This magnitude selection also has the advantage of giving large blue – near-infrared colours, where we may expect for the five known OH absorbers, on the basis of their optical – near-infrared colours of (Curran et al., 2006).
From the first part of this survey, we (Curran et al., 2011b) obtained one detection from four targets, three of which were unaffected by RFI, following which we were awarded further observing time on the Giant Metrewave Radio Telescope (GMRT) to complete the remainder of the requested sample. Here we present our results and discuss their implications: In Sect. 2 we describe the sample selection, observations and analysis, in Sect. 3 we present our results, in Sect. 4 we discuss these in context of the previous H i 21-cm searches and in Sect. 5 we present our conclusions.
2 Observations and analysis
2.1 Sample selection
In order to obtain a sample of H i and OH absorbers, we selected sources for which both transitions would be redshifted into the 1420 MHz receiver band (which spans 1000–1450 MHz). To ensure sufficient flux against which to detect the absorption (Sect. 2.2), sources were selected from the Parkes Half-Jansky Flat-spectrum Sample (PHFS, Drinkwater et al. 1997; Francis et al. 2000), giving a total of ten targets with redshifts of . Lastly, the sources were prioritised by faintness, for which we chose (as quoted in the PHFS, Table 1), since this gave the ten faintest targets for which the estimated flux density at the redshifted H i 21-cm absorption frequency, , was confirmed to exceed 0.5 Jy.
| Source | PHFS magnitudes | Derived magnitudes | ||||||||
|---|---|---|---|---|---|---|---|---|---|---|
| [mag] | [mag] | [Jy] | [MHz] | [W Hz-1] | [sec-1] | |||||
| 0114+074 | 0.343 | 22.14 | 6.75 | — | — | — | — | |||
| 0137+012 | 0.260 | 19.44 | 5.62 | — | ||||||
| 0240–217 | 0.314 | 19.05 | 5.57 | |||||||
| 0454+066 | 0.405 | 19.79 | 5.37 | — | ||||||
| 1456+044 | 0.391 | 20.15 | 5.57 | — | ||||||
| 1509+022 | 0.219 | 19.83 | 5.41 | — | ||||||
Verifying that the magnitude selection did yield targets exceeding the critical UV luminosity/ionising photon rate,
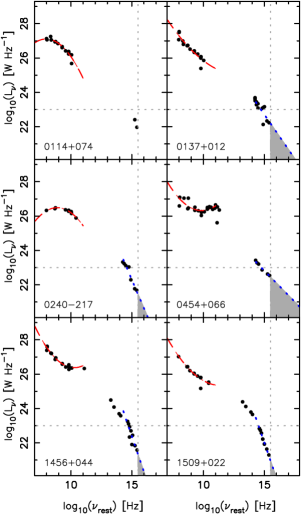
as described in Curran et al. (2013b), for each source we obtained the photometry from NASA/IPAC Extragalactic Database (NED), the Wide-Field Infrared Survey Explorer (WISE, Wright et al. 2010), Two Micron All Sky Survey (2MASS, Skrutskie et al. 2006) and the Galaxy Evolution Explorer (GALEX, data release GR6/7)444http://galex.stsci.edu/GR6/#mission databases. Each datum was corrected for Galactic extinction (Schlegel et al., 1998) and a power law was fit to the UV rest-frame data, allowing the ionising photon rate, , to be derived from
where is the spectral index and the intercept. This gives,
shown by the shaded regions in Fig. 1, all of which give rates below the critical sec-1 (Table 1).
Fitting the optical photometry by the same method gave the blue and near-infrared magnitudes, where the latter would be primarily obtained directly from the WISE and 2MASS data. From this we found brighter blue magnitudes than expected. Drinkwater et al. (1997) obtain the blue magnitudes for the PHFS from the COSMOS catalogue (Yentis et al., 1992), where the uncertainty quoted is mag, although Drinkwater et al. find that, due to a lack of calibration, some magnitudes may be erroneous by mag. In order to check this, in Fig. 2 we compare the blue magnitudes obtained from the fit to the SED of each PHFS source with those quoted in the catalogue.
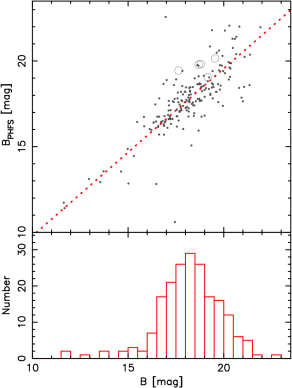
From a least-squares fit to the distribution, we see that, although our fits suggest larger values ( for the whole sample) than quoted in the PHFS (), the magnitudes of our targets may be consistent with the PHFS values within the uncertainties (Table 1). However, the large possible uncertainties in the magnitudes were not a consideration when selecting targets and so these sight-lines are generally not be as reddened as originally thought.
2.2 Observations and data reduction
All of the targets were observed over 26–31 January 2012, with the 1420 MHz receiver backed with the FX correlator over a bandwidth of 16 MHz spread over 512 channels in orthogonal polarisations. This gave a channel spacing of km (cf. a full-width half maximum of FWHM = 8 to 210 km for the five known OH absorbers, see Curran et al. 2007), while maintaining a redshift coverage of , in order to cover any uncertainties in the redshifts.555These are for 0137+012 (Ho & Kim, 2009), for 1456+044 and for 1509+022 (Hewett & Wild, 2010). Uncertainties are not available for the remaining three targets, but since the redshifts are quoted to three decimal places, the choice of should ensure ample coverage. The full 30 antenna array was requested, with each transition in each source being observed for a total of one hour, in order to reach a root mean-square (rms) noise level of mJy per channel. For a flux density of Jy, this gives a optical depth limit of per channel, or a sensitivity to per 8 km channel, which is close to the lower limit for all of the published H i 21-cm searches. For the OH 1667 MHz transition, this corresponds to a sensitivity to per 8 km channel, cf. for the five known OH absorbers (Kanekar & Chengalur, 2002; Kanekar et al., 2005).
For each source, 3C 48, 3C 147 and 3C 286 were used for bandpass calibration and a strong nearby point source for phase calibration. However, since this was performed only once every 30 minutes, self calibration of the delays usually produced a superior image. The data were flagged and reduced using the miriad interferometry reduction package, with flagging of the edge channels leaving the central 470 channels ( km ) from which a bad channel (144 in polarisation XX) was removed from all visibilities. After averaging the two polarisations, a spectrum was extracted from the cube. Regarding each source:
4C +07.04 (0114+074): The H i band was observed for a total of 1.05 hours.
Five antennas (14, 20, 22, 23 & 30) were non-functioning, with antennas 19 and 26 also being flagged due to a severe
bandpass ripple, leaving 300 baseline pairs. Self calibration of the phases produced a superior image in which the source
was unresolved by the synthesised beam.
The OH band was observed for a total of 1.27 hours and after flagging of the non-functioning antennas (14,20,22,23,30),
300 baseline pairs remained. Again, a far superior image was obtained through self calibration of the phases, giving a
synthesised beam of . The extracted spectrum shows a strong emission feature, which we
believe to be an artifact (see Sect. 3.2).
UM 355 (0137+012): H i was searched for a total of 1.05 hours. After flagging non-functioning antenna 20,
antennas 23, 28, 29 and 30 were removed, due to less than ideal phase calibration. Although all of the
remaining phases were well behaved, self calibration of this source could not produce a satisfactory image. The
calibration was then obtained from the phase calibrator LBQS 0056–0009, and the data from the unflagged 351
baseline pairs. The synthesised beam was giving the partially resolved main component and a separate
feature (see Sect. 3.3). The OH band was observed for a total of 1.28 hours. After removal of the non-functioning
antennas (12, 20, 22, 23 and 30), 300 good baseline pairs remained.
PKS 0240–217: The H i band was observed for a total of 0.90 hours. Only one antenna (20) was non-functioning,
leaving 406 baseline pairs. Some minimal RFI was removed from the first half of the observation and after self
calibration of the phases a high quality image was produced, although there is still some narrow-band RFI spikes present
in the extracted spectrum. Unfortunately, this is concentrated at MHz, close to the expected absorption
frequency (Fig. 3). The source was unresolved by the synthesised
beam.
For the OH band, non-functioning antennas (4 and 20) were flagged, leaving 378 baseline pairs. Again, by self
calibrating, an excellent image was produced from which the spectrum was extracted. The source was unresolved by the
synthesised beam.
4C +06.21 (0454+066): H i was searched for a total of 0.66 hours. In addition to antenna 20, antenna 4 was
found to be non-functioning with antenna 26 giving extremely noisy spectra. After flagging these, 351 baselines pairs
remained from which the image was produced, using 3C 120 for phase calibration. The source was unresolved by the
synthesised beam.
For the OH band, antenna 20 was non-functioning and after the removal of the badly behaving antenna 12, 378 baseline
pairs remained. However, RFI was apparent below 1182 MHz requiring the first 200 channels to be flagged, leaving 290.
The source was unresolved by the synthesised beam.
4C +04.49 (1456+044): H i was searched for a total of 0.47 hours. After removing non-functioning antennas (4
and 26), the non-functioning baseline pair 2–8 was also removed, leaving 377 pairs. Self calibration of the phases
proved unsatisfactory and so the nearby 3C 298 (1416+067) was used. Severe RFI below 1016 MHz required removal of the
first 70 remaining channels, leaving 420.
The beam reveals a double source (see Sect. 3.3).
For the OH band, non-functioning antennas (4 and 26) were removed, leaving 378 baseline pairs. RFI was present on all
baselines at MHz and using 3C 298 for the phase calibration also revealed the second feature present in the
lower frequency, resolved by the beam.
PKS 1509+022: Was searched in the H i band for a total of 0.73 hours. After flagging the non-functioning
antennas (4, 22, 23 and 26), phase calibration, using 3C 327.1, failed to produce a quality image even, after the
removal of poorly performing antennas (17, 24, 28 and 30), which left 231 baseline pairs. This was probably due to the
fact that this calibrator is over one hour in distance from the target source. Self calibration of the source required
removal of the aforementioned antennas before the phases could be calibrated. Even so, no good image could be produced
and so the spectrum was obtained by averaging visibilities of the remaining 231 baselines.
The OH band was observed for a total of 0.85 hours and, like the H i band observations, could not be calibrated, even
after the removal of non-functioning antennas. Further flagging, of the noisiest baseline pairs (where the rms exceeded 1 Jy), left 210 baseline pairs, which were
averaged together to obtain a spectrum.
3 Results
3.1 Observational results
In Fig. 3 we show the final spectra from which we have obtained no detections in the six targets searched,
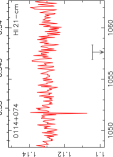
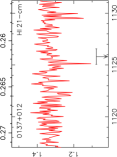
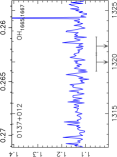
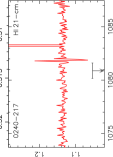
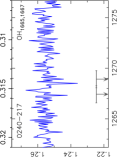
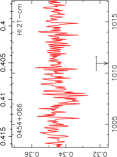
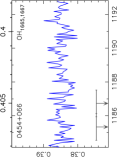
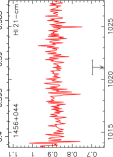
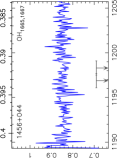

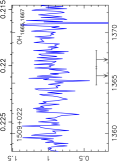
with the details summarised in Table 2.
| Source | Line | [Jy] | [Jy] | [km ] | [] | -range [MHz] | -range | ||
|---|---|---|---|---|---|---|---|---|---|
| 0114+074 | 0.343 | H i | 1.130 | 0.003 | 9.2 | 1048–1063 | 0.336–0.356 | ||
| … | … | OH | 1.233 | 0.004 | 7.9 | 1232–1247 | 0.337–0.354 | ||
| 0137+012 | 0.260 | H i | 1.335 | 0.052 | 8.7 | 1119–1134 | 0.252–0.269 | ||
| … | … | OH | 1.133 | 0.022 | 7.4 | 1315–1327 | 0.256–0.268 | ||
| 0240–217 | 0.314 | H i | 1.135 | 0.007 | 9.0 | 1073–1088 | 0.306–0.324 | ||
| … | .. | OH | 1.255 | 0.005 | 7.7 | 1262–1277 | 0.306–0.321 | ||
| 0454+066 | 0.405 | H i | 0.346 | 0.005 | 9.7 | 1002–1017 | 0.396–0.417 | ||
| … | … | OH | 0.385 | 0.002 | 8.2 | 1184–1193 | 0.398–0.409 | ||
| 1456+044 | 0.391 | H i | 0.884 | 0.033 | 9.6 | 1015–1028 | 0.382–0.400 | ||
| … | … | OH | 0.846 | 0.033 | 8.1 | 1193–1202 | 0.387–0.397 | ||
| 1509+022 | 0.219 | H i | 1.034 | 0.08 | 8.5 | 1153–1168 | 0.216–0.232 | ||
| … | … | OH | 0.972 | 0.16 | 7.1 | 1358–1373 | 0.214–0.228 |
In addition to our targets not being sufficiently red (Sect. 2.1) to detect OH (Curran et al., 2006), each of the five known redshifted systems OH was detected following a clear H i detection (Carilli et al., 1992, 1993, 1998; Chengalur et al., 1999; Kanekar & Briggs, 2003). Furthermore, the OH absorption strength is only expected to be times that of the H i 21-cm absorption (Curran et al., 2007). Therefore we will treat H i as a prerequisite for OH absorption and thus focus our discussion around the H i 21-cm results.
The total neutral hydrogen column density is related to the velocity integrated optical depth of the H i 21-cm absorption via,
| (1) |
where is the spin temperature of the gas, which is a measure of the excitation from the lower hyperfine level (Purcell & Field, 1956; Field, 1959), and is the velocity integrated optical depth of the absorption. The observed optical depth is related to this via
| (2) |
where the covering factor, , is a measure of the fraction of observed background flux () intercepted by the absorber. In the optically thin regime (where ), Equ. 1 can be rewritten as . From Fig. 4 (top panel)666In order to normalise the limits, each has been re-sampled to the same spectral resolution (20 km , as in Fig. 3), which is used as the FWHM to obtain the integrated optical depth limit, thus giving the limit per channel (see Curran 2012)., we see that the six targets have been searched in H i 21-cm to sensitivities comparable with previous detections.777The associated absorption searches have been compiled from de Waard et al. (1985); Mirabel (1989); van Gorkom et al. (1989); Uson et al. (1991); Carilli et al. (1992, 1998, 2007); Moore et al. (1999); Peck et al. (1999, 2000); Röttgering et al. (1999); Morganti et al. (2001); Ishwara-Chandra et al. (2003); Vermeulen et al. (2003); Curran et al. (2006, 2008, 2011a, 2011b, 2013b, 2013c, 2016a); Gupta et al. (2006); Orienti et al. (2006); Kanekar et al. (2009); Emonts et al. (2010); Salter et al. (2010); Chandola et al. (2011, 2013); Allison et al. (2012, 2015); Yan et al. (2012, 2016); Geréb et al. (2015); Srianand et al. (2015); Aditya et al. (2016, 2017).

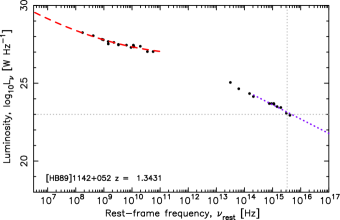
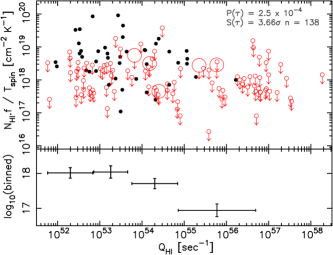
In the bottom panel we show the ionising photon rates for those sources for which there is sufficient blue/UV rest-frame photometry (Sect. 2.1). [HB89] 1142+052 now defines the highest value ( sec-1) where H i has been detected (Kanekar et al., 2009).888The absorption redshift of (Kanekar et al., 2009) corresponds to a velocity offset of km relative to and so we deem this as associated rather than intervening. This is close to the theoretical value of sec-1, which is sufficient to ionise all of the neutral atomic gas in a large spiral galaxy (Curran & Whiting, 2012), although from very limited Å photometry (Fig. 5).
For sec-1, there are 43 detections and 66 non-detections, that is a 39.4% detection rate for objects for which can be estimated. Applying this to the sec-1 sources, gives a binomial probability of of obtaining 0 detections and 29 non-detections, which is significant at , assuming Gaussian statistics. If we include the forthcoming results of Grasha et al. (2017)999Hereafter G17, which reports 0 new detections of H i 21-cm absorption out of 89 new searches over (see Grasha & Darling 2011)., this increases to .
Aditya et al. (2017) have recently detected H i 21-cm absorption at in TXS 1954+513, which they claim has an ultra-violet luminosity of W Hz-1, following the method of Curran et al. (2008). The luminosity is, however, based upon only two photometry measurements which are in the rest-frame optical band and extrapolated to the UV. This is insufficient data to calculate , which requires integration of the UV photometry above Hz (see Sect. 2.1). If, for the sake of argument, we approximate sec-1, our model (Curran & Whiting, 2012) yields a scale-length of kpc, cf. kpc for the Milky Way (Kalberla & Kerp, 2009). That is, this ionising photon rate is just sufficient to ionise all of the gas in a large spiral, which is consistent with the results of Curran & Whiting. Adding this value of to the other data (Fig. 4, bottom), would change the above significance to for the current data and including the forthcoming data. Due to the lack of photometry, however, our own UV fitting method (which requires the interpolation of at least four points at Hz, see Curran et al. 2013b) would reject a UV fit for this source and so we cannot assign an ultra-violet luminosity nor photo-ionisation rate.
3.2 Emission feature in 0114+074
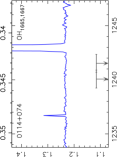
As seen in Fig. 3, there is a strong emission feature in the OH band of 0114+074. The feature was apparent in the averaged visibilities, before imaging, in both polarisations, close to the expected OH frequency (Fig. 6), although not apparent in the calibration sources.
The emission has an integrated flux density of Jy km , which gives L⊙. This is within the range of known OH mega-masers ( L⊙, e.g. Darling & Giovanelli 2002b; Lo 2005). However, given that the feature appears as absorption when off source, in conjunction with the fact that no 1665/1667 MHz doublet is apparent (e.g. Darling & Giovanelli 2002a; Harvey-Smith et al. 2016), we attribute this to an artifact rather than being the detection of an OH mega-maser.
3.3 Resolved structure in 0137+012 & 1456+044
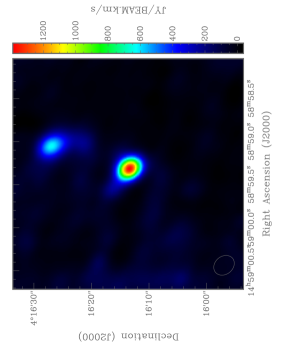
As mentioned in Sect. 2.2, more than one component was resolved in the observations of 0137+012 and 1456+044. In 0137+012 (Fig. 7, top) we see three separate features, previously detected at 1465 and 4885 MHz by Gower & Hutchings (1984), which they modelled as a damped precessing jet.
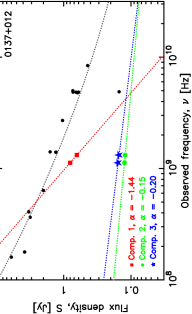
Component 1 is by far the strongest, with flux densities of and Jy at 1125 and 1321 MHz, respectively, giving an H i optical of depth limit of per 8.7 km channel. The other two components are significantly weaker (2 – Jy & Jy, giving and 3 – Jy & Jy, giving ). They also have similar spectral indices which may suggest a connection, although the two frequencies are insufficiently separated to infer anything definite (Fig. 7, bottom).
For 1456+044, the image revealed a double source (Fig. 8, top).
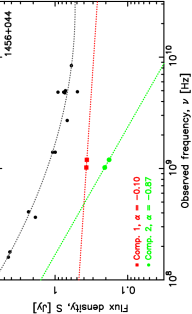
Component 1 has flux densities of and Jy at 1021 and 1198 MHz, respectively, giving an H i optical of depth limit per 8.5 km channel. For component 2, the flux densities are and Jy, giving an H i optical of depth limit . From Fig. 8 (bottom), while the main component appears to have a very flat spectrum, component 2 has a similar spectral index to the cumulative emission at the measured frequencies. Furthermore, it is possible to envision the cumulative SED as being the sum of those of the two components, although there appears to be some missing flux and, again, the observed frequencies are very close to each other.
4 Discussion
4.1 Factors affecting the detection rate
4.1.1 Ultra-violet luminosity and survey sensitivity
Although all six sources searched have UV luminosities below the critical value, none were detected in H i 21-cm absorption.

In Fig. 9, for the photo-ionising rate and other important parameters, we show how the detection rate varies with the parameter in question. These are obtained from the number of detections normalised by the total number of searches within each bin, which we bin per decade for (the first panel of Fig. 9). For our targets, whose values are shown by the vertical lines, we may expect a % chance of detection. A decrease in the detection rate with redshift was first shown by Curran et al. (2008), which was interpreted as the high redshifts selecting UV luminosities sufficient to excite the gas to below the detection limit.101010Röttgering et al. (1999) also obtained only H i 21-cm non-detections in six radio galaxies, but failed to realise the significance of the UV luminosity in their comparison with the highest redshift () H i 21-cm detection (Uson et al., 1991). This, B2 0902+34, has W Hz-1, cf. W Hz-1 for each of their sample. Because of the Malmquist bias, it can be difficult to ascertain whether the decreasing detection rate is caused by an evolutionary effect at high redshift (Curran & Whiting, 2010; Aditya et al., 2016), although ionisation of the gas at high UV luminosities is physically motivated and is found to apply at all redshifts, no matter the selection criteria (Sect. 1). Showing the line strength versus the photo-ionising rate (Fig. 10), we see a strong anti-correlation, which, for a given column density and covering factor (Sect. 3.1), would suggest an increase in the spin temperature due to an increased flux of Å photons (Bahcall & Ekers, 1969). Again, it is also clear that there is a value of above which H i 21-cm is not detected, although there is no “critical redshift” apparent.
For example, the two detections at (Moore et al. 1999; Uson et al. 1991, which have sec-1, Fig. 4). Therefore, contrary to Aditya et al. (2016), we reaffirm that the luminosity–redshift degeneracy can be broken and that the decrease in detection rate is caused by an increase in the UV luminosity.
Referring to the second panel of Fig. 9, from the sensitivities we expect a detection rate of %, cf. 26% for the whole sample, which rises to 29% with the removal of the sec-1 sources. This compares to the 25% found by Gupta et al. (2006) and the 40% by Vermeulen et al. (2003), although this was for compact objects, which trace less UV luminous sources (Curran & Whiting, 2010; Allison et al., 2012).111111The maximum expected detection rate is % on account of the chance of the radiation being intercepted by the galactic disk along our sight-line (see Curran & Whiting 2010 and references therein). From a % detection rate, we may expect (for binomial statistics) detections out of our six targets. This is within of zero detections and so our results are not extraordinary. Nevertheless, it would be of value to future surveys to analyse other possible factors which could affect the detection of H i 21-cm absorption.
4.1.2 Dust reddening
As discussed in Sect. 1, the correlation between molecular fraction and optical – near-infrared colour (Curran et al., 2011) is evidence of dust reddening, where the dusty sight-lines are more conducive to high molecular abundance. From a sample of five red quasars searched in associated H i 21-cm absorption, Carilli et al. (1998) obtained four detections, from which they suggested that optically selected samples, which have lower H i 21-cm detection rates, may bias against the detection of high column density absorbers. Following this, Curran et al. (2006) noted a trend between the H i 21-cm absorption strength and the optical – near-infrared colour, with Curran & Whiting (2010) reporting a correlation between and for the 58 searched associated absorbers for which the colours were available. Since we have based the current sample on their faint blue-magnitudes, in Fig. 11 we show the current distribution in terms of .
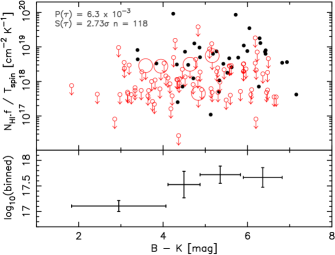
A generalised non-parametric Kendall-tau test gives a probability of [] of the correlation occuring by chance, with the inclusion of the forthcoming data (G17) increasing the significance to []. Furthermore, in the third panel of Fig. 9 we see a steep increase in the detection rate with the red colour. This and the strong positive correlation with the line strength, indicates that the reddening is caused by dust, the presence of which hinders excitation of the hydrogen above the lower hyper-fine () ground state.
4.1.3 Coverage of the background continuum flux
From Equ. 2, we see that the observed optical depth can be reduced by low coverage () of the background emission, an effect seen in both intervening and associated absorption (Curran 2012; Curran et al. 2013a, respectively). For a given (unknown) absorption cross-section, in the optically thin regime, the observed optical depth will therefore be proportional to the extent of the radio emission (see Curran et al. 2005a). Extended emission may be apparent through a steep spectrum, due to the radio jets being aligned normally to our line-of-sight (seen edge-on), thus maximising the apparent size of the source. Another signature of extended emission is a low/non-apparent turnover frequency, it being generally accepted that the turnover frequency of a radio source is anti-correlated with its extent (e.g. Fanti et al. 1990).
From a sample of near-by galaxies, Curran et al. (2016c) found that, while there was a large overlap in the spectral indices of the H i 21-cm detections and non-detections, detections did tend to occur towards sources with higher turnover frequencies.
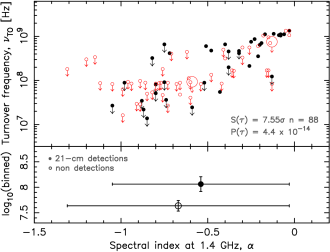
We obtain the turnover frequencies and the spectral indices from the fits described in Sect. 2.1 and plotting the H i 21-cm absorption searches in Fig. 12, we see a similar result where the detections have a mean turnover frequency of MHz, compared to MHz, for the non-detections. This is confirmed in Fig. 13 (see also the fourth panel of Fig. 9), where the positive correlation between the line strength and turnover frequency (suggesting an inverse correlation with source size), indicates that the covering factor is important.

However, as seen in the top panel of the figure, not having an evident turnover frequency does not preclude a detection, with this being possible at MHz. Therefore, it should be borne in mind that the spectral properties offer only an indirect measure of the emission region and the covering factor depends upon how this is related to the absorption cross-section, as well as the alignment between absorber and emitter (see Curran et al. 2013a).
4.1.4 Summary
In Table 3 we summarise the probability of detection for the six targets discussed in this work, based upon the above parameters. These are obtained from the number of detections normalised by the total number of searches within the bin which hosts the target (Fig. 9).
| Source | -range | Sensitivity | |||
|---|---|---|---|---|---|
| 0114+074 | 0.336–0.356 | — | 27% | — | 33% |
| 0137+012 | 0.252–0.269 | 31% | 22% | 22% | — |
| 0240–217 | 0.306–0.324 | 41% | 26% | 27% | 52 % |
| 0454+066 | 0.396–0.417 | 28% | 24% | 20% | — |
| 1456+044 | 0.382–0.400 | 44% | 24% | 26% | — |
| 1509+022 | 0.216–0.232 | 52% | 18% | 29% | — |
From these we see that, on an individual basis, the odds are against a detection with a maximum probability of 52% for a single parameter ( for 1509+022 and for 0240–217). This, however, will be tempered by the probability from the other parameters, which are not independent121212For example, the relationship between (the UV luminosity) and the colour, where will be anti-correlated with , particularly at . Since the radio and UV luminosities are correlated (Curran & Whiting, 2010), there will also be a relationship between and the search sensitivity., making the overall probability difficult to ascertain for each source.
So in addition to our hypothesis that we only expect detections where W Hz-1 ( sec-1), detection rates may be maximised through the selection of red, gigahertz peaked spectrum sources. The colour is indicative of a dusty environment, more conducive to the presence of cold neutral gas, and the turnover frequency indicative of an increased covering factor, due to the compact radio emission. If the projected extent of the radio emission is dictated by the orientation of the jets along the sight-line, this presents an issue for the model where the absorption occurs in the obscuring torus invoked by unified schemes of active galactic nuclei (e.g. Jaffe & McNamara 1994; Conway & Blanco 1995; Morganti et al. 2001; Pihlström et al. 2003; Gupta et al. 2006; Gupta & Saikia 2006), since this is less likely to intercept the sight-line in compact objects (e.g. Gupta et al. 2006). However, as well as occuring in outflowing gas (e.g. Vermeulen et al. 2003; Morganti et al. 2003, 2005a, 2005b, 2007; Allison et al. 2016), the bulk of the absorption is believed to occur in the large-scale galactic disk, rather than the sub-pc torus131313Although this does make a small contribution (Curran et al. 2016b)., which is expected to have a random orientation to the radio jets (Curran & Whiting 2010 and references therein).
5 Conclusions
We have undertaken a survey for associated H i 21-cm and OH 18-cm absorption in six radio sources with the GMRT. Despite selecting targets which have ionising photon rates lower than the critical value, above which the neutral gas is believed to be completely ionised, and reaching the sensitivities of previous detections, we do not detect either transition. Given that the OH absorption strength is expected to be times that of the H i 21-cm absorption (Curran et al., 2007), the non-detection of this radical is not surprising, especially in the knowledge that our targets are not as reddened as originally believed. Regarding the H i, by combining our results with previous searches, in addition to the ionising photon rate (UV luminosity), we find correlations between the detection rate and:
-
1.
The blue – near-infrared colour, which is indicative of the reddening being due to dust, the presence of which helps in maintaining a low gas spin temperature in the case of the detections.
-
2.
The turnover frequency of the radio SED of the source, which is believed to be anti-correlated with the size of the radio emission (e.g. Fanti et al. 1990). This itself is anti-correlated with the line strength, due to lower coverage of the measured flux, and so lower optical depths are expected for extended sources (Curran et al., 2013a).
The detection rate is, of course, also subject to the search sensitivity with a maximum rate of % for . A maximum of % may be expected, due to the orientation of the absorbing gas with respect to the continuum emission (Curran & Whiting, 2010), and so in addition to maximising the sample size, future surveys should also target optically faint/obscured, radio bright objects. Since this could preclude objects with measured optical redshifts, full band “spectral scans” towards sufficiently bright radio sources may be the way forward (e.g. Curran et al. 2005b; Allison et al. 2015).
We confirm that associated H i 21-cm absorption has never been detected above the theoretical value of sec-1 (Curran & Whiting, 2012). From the highest reliable detected value of sec-1 (a monochromatic Å luminosity of W Hz-1), the binomial probability of the observed 0 detections out of 29 searched above this value is just , which is significant at . Adding, the forthcoming results of Grasha et al. (2017), the probability of the 0 detections out of 63 searches is just , which is significant at . Hence, the case for a critical ultra-violet luminosity is strengthened. Given the unbiased (i.e. inhomogeneous) nature of the whole sample, this W Hz-1 ( sec-1) appears to be universal and the selection of sources of known optical redshift leads to the selection of higher luminosities at high redshift (see Morganti et al. 2015), where all of the gas is ionised. That is, even the Square Kilometre Array will not detect H i 21-cm absorption in these. This leads us to reiterate that spectral scans towards optically faint objects is the best strategy and this is where the SKA will excel due to its wide instantaneous bandwidth.
Acknowledgements
We wish to thank the anonymous referee for their helpful comments, as well as Katie Grasha and Jeremy Darling for a draft manuscript of their forthcoming paper. This research has made use of the NASA/IPAC Extragalactic Database (NED) which is operated by the Jet Propulsion Laboratory, California Institute of Technology, under contract with the National Aeronautics and Space Administration. This publication makes use of data products from the Wide-field Infrared Survey Explorer, which is a joint project of the University of California, Los Angeles, and the Jet Propulsion Laboratory/California Institute of Technology, funded by the National Aeronautics and Space Administration. This publication makes use of data products from the Two Micron All Sky Survey, which is a joint project of the University of Massachusetts and the Infrared Processing and Analysis Center/California Institute of Technology, funded by the National Aeronautics and Space Administration and the National Science Foundation. GALEX is operated for NASA by the California Institute of Technology under NASA contract NAS5-98034. This research has also made use of NASA’s Astrophysics Data System Bibliographic Services and asurv Rev 1.2 (Lavalley et al., 1992), which implements the methods presented in Isobe et al. (1986).
References
- Abazajian et al. (2004) Abazajian K. et al., 2004, AJ, 128, 502
- Adelman-McCarthy et al. (2008) Adelman-McCarthy J. K. et al., 2008, ApJS, 175, 297
- Aditya et al. (2017) Aditya J. N. H. S., Kanekar K., Prochaska J. X., Day B., Lynam P., Cruz J., 2017, MNRAS, 465, 5011
- Aditya et al. (2016) Aditya J. N. H. S., Kanekar N., Kurapati S., 2016, MNRAS, 455, 4000
- Allison et al. (2012) Allison J. R. et al., 2012, MNRAS, 423, 2601
- Allison et al. (2016) Allison J. R. et al., 2016, Astronomische Nachrichten, 337, 175
- Allison et al. (2015) Allison J. R. et al., 2015, MNRAS, 453, 1249
- Bahcall & Ekers (1969) Bahcall J. N., Ekers R. D., 1969, ApJ, 157, 1055
- Berengut et al. (2011) Berengut J. C., Flambaum V. V., King J. A., Curran S. J., Webb J. K., 2011, Phys. Rev. D, 83, 123506
- Braun (2012) Braun R., 2012, ApJ, 87, 749
- Carilli et al. (1998) Carilli C. L., Menten K. M., Reid M. J., Rupen M. P., Yun M. S., 1998, ApJ, 494, 175
- Carilli et al. (1992) Carilli C. L., Perlman E. S., Stocke J. T., 1992, ApJ, 400, L13
- Carilli et al. (1993) Carilli C. L., Rupen M. P., Yanny B., 1993, ApJ, 412, L59
- Carilli et al. (2007) Carilli C. L., Wang R., van Hoven M. B., Dwarakanath K., Chengalur J. N., Wyithe S., 2007, AJ, 133, 2841
- Chandola et al. (2013) Chandola Y., Gupta N., Saikia D. J., 2013, MNRAS, 429, 2380
- Chandola et al. (2011) Chandola Y., Sirothia S. K., Saikia D. J., 2011, MNRAS, 418, 1787
- Chengalur et al. (1999) Chengalur J. N., de Bruyn A. G., Narasimha D., 1999, A&A, 343, L79
- Conway & Blanco (1995) Conway J. E., Blanco P. R., 1995, ApJ, 449, L131
- Curran (2012) Curran S. J., 2012, ApJ, 748, L18
- Curran et al. (2013a) Curran S. J., Allison J. R., Glowacki M., Whiting M. T., Sadler E. M., 2013a, MNRAS, 431, 3408
- Curran et al. (2016a) Curran S. J., Allison J. R., Whiting M. T., Sadler E. M., Combes F., Pracy M. B., Bignell C., Athreya R., 2016a, MNRAS, 457, 3666
- Curran et al. (2007) Curran S. J., Darling J. K., Bolatto A. D., Whiting M. T., Bignell C., Webb J. K., 2007, MNRAS, 382, L11
- Curran et al. (2016b) Curran S. J., Duchesne S. W., Divoli A., Allison J. R., 2016b, MNRAS, 462, 4197
- Curran et al. (2004a) Curran S. J., Kanekar N., Darling J. K., 2004a, Science with the Square Kilometer Array, New Astronomy Reviews 48, Carilli C. L., Rawlings S., eds., Elsevier, Amsterdam, pp. 1095–1105
- Curran et al. (2004b) Curran S. J., Murphy M. T., Pihlström Y. M., Webb J. K., Bolatto A. D., Bower G. C., 2004b, MNRAS, 352, 563
- Curran et al. (2005a) Curran S. J., Murphy M. T., Pihlström Y. M., Webb J. K., Purcell C. R., 2005a, MNRAS, 356, 1509
- Curran et al. (2016c) Curran S. J., Reeves S. N., Allison J. R., Sadler E. M., 2016c, MNRAS, 459, 4136
- Curran et al. (2005b) Curran S. J., Webb J. K., Murphy M. T., Kuno N., 2005b, in Highlights of Astronomy, Vol. 13, as presented at the XXVth General Assembly of the IAU - 2003, Engvold. O., ed., ASP Conf. Ser., San Francisco, pp. 845 – 847
- Curran & Whiting (2010) Curran S. J., Whiting M. T., 2010, ApJ, 712, 303
- Curran & Whiting (2012) Curran S. J., Whiting M. T., 2012, ApJ, 759, 117
- Curran et al. (2011) Curran S. J. et al., 2011, MNRAS, 416, 2143
- Curran et al. (2011a) Curran S. J. et al., 2011a, MNRAS, 413, 1165
- Curran et al. (2006) Curran S. J., Whiting M. T., Murphy M. T., Webb J. K., Longmore S. N., Pihlström Y. M., Athreya R., Blake C., 2006, MNRAS, 371, 431
- Curran et al. (2013b) Curran S. J., Whiting M. T., Sadler E. M., Bignell C., 2013b, MNRAS, 428, 2053
- Curran et al. (2013c) Curran S. J., Whiting M. T., Tanna A., Sadler E. M., Pracy M. B., Athreya R., 2013c, MNRAS, 429, 3402
- Curran et al. (2011b) Curran S. J., Whiting M. T., Webb J. K., Athreya R., 2011b, MNRAS, 414, L26
- Curran et al. (2008) Curran S. J., Whiting M. T., Wiklind T., Webb J. K., Murphy M. T., Purcell C. R., 2008, MNRAS, 391, 765
- Darling & Giovanelli (2002a) Darling J., Giovanelli R., 2002a, AJ, 124, 100
- Darling & Giovanelli (2002b) Darling J., Giovanelli R., 2002b, ApJ, 572, 810
- Darling (2003) Darling J. K., 2003, PhRvL, 91, 011301
- de Waard et al. (1985) de Waard G. J., Strom R. G., Miley G. K., 1985, A&A, 145, 479
- Drinkwater et al. (1997) Drinkwater M. J. et al., 1997, MNRAS, 284, 85
- Emonts et al. (2010) Emonts B. H. C. et al., 2010, MNRAS, 406, 987
- Fanti et al. (1990) Fanti R., Fanti C., Schilizzi R. T., Spencer R. E., Nan Rendong, Parma P., van Breugel W. J. M., Venturi T., 1990, A&A, 231, 333
- Field (1959) Field G. B., 1959, ApJ, 129, 536
- Francis et al. (2000) Francis P. J., Whiting M. T., Webster R. L., 2000, PASA, 17, 56
- Fukugita & Ménard (2015) Fukugita M., Ménard B., 2015, ApJ, 799, 195
- Fynbo et al. (2010) Fynbo J. P. U. et al., 2010, MNRAS, 408, 2128
- Fynbo et al. (2011) Fynbo J. P. U. et al., 2011, MNRAS, 413, 2481
- Geréb et al. (2015) Geréb K., Maccagni F. M., Morganti R., Oosterloo T. A., 2015, A&A, 575, 44
- Gower & Hutchings (1984) Gower A. C., Hutchings J. B., 1984, PASP, 96, 19
- Grasha & Darling (2011) Grasha K., Darling J., 2011, in American Astronomical Society Meeting Abstracts, Vol. 43, p. 345.02
- Grasha et al. (2017) Grasha K., Darling J. K., Bolatto, A. D. Leroy A., Stocke J., 2017, ApJ, submitted
- Guimarães et al. (2012) Guimarães R., Noterdaeme P., Petitjean P., Ledoux C., Srianand R., López S., Rahmani H., 2012, AJ, 143, 147
- Gupta & Saikia (2006) Gupta N., Saikia D. J., 2006, MNRAS, 370, 738
- Gupta et al. (2006) Gupta N., Salter C. J., Saikia D. J., Ghosh T., Jeyakumar S., 2006, MNRAS, 373, 972
- Harvey-Smith et al. (2016) Harvey-Smith L. et al., 2016, MNRAS, 2180
- Hewett & Wild (2010) Hewett P. C., Wild V., 2010, MNRAS, 405, 2302
- Ho & Kim (2009) Ho L. C., Kim M., 2009, ApJS, 184, 398
- Hopkins & Beacom (2006) Hopkins A. M., Beacom J. F., 2006, ApJ, 651, 142
- Ishwara-Chandra et al. (2003) Ishwara-Chandra C. H., Dwarakanath K. S., Anantharamaiah K. R., 2003, JA&A, 24, 37
- Isobe et al. (1986) Isobe T., Feigelson E., Nelson P., 1986, ApJ, 306, 490
- Jaffe & McNamara (1994) Jaffe W., McNamara B. R., 1994, ApJ, 434, 110
- Kalberla & Kerp (2009) Kalberla P. M. W., Kerp J., 2009, Ann. Rev. Astr. Ap., 47, 27
- Kanekar & Briggs (2003) Kanekar N., Briggs F. H., 2003, A&A, 412, L29
- Kanekar et al. (2005) Kanekar N. et al., 2005, PhRvL, 95, 261301
- Kanekar & Chengalur (2002) Kanekar N., Chengalur J. N., 2002, A&A, 381, L73
- Kanekar et al. (2003) Kanekar N., Chengalur J. N., de Bruyn A. G., Narasimha D., 2003, MNRAS, 345, L7
- Kanekar et al. (2009) Kanekar N., Prochaska J. X., Ellison S. L., Chengalur J. N., 2009, MNRAS, 396, 385
- Lagos et al. (2014) Lagos C. D. P., Baugh C. M., Zwaan M. A., Lacey C. G., Gonzalez-Perez V., Power C., Swinbank A. M., van Kampen E., 2014, MNRAS, 440, 920
- Lavalley et al. (1992) Lavalley M. P., Isobe T., Feigelson E. D., 1992, in BAAS, Vol. 24, pp. 839–840
- Lo (2005) Lo K. Y., 2005, ARA&A, 43, 625
- Mirabel (1989) Mirabel I. F., 1989, ApJ, 340, L13
- Möller et al. (2004) Möller P., Fynbo J. P. U., Fall S. M., 2004, A&A, 422, L33
- Moore et al. (1999) Moore C. B., Carilli C. L., Menten K. M., 1999, ApJ, 510, L87
- Morganti et al. (2007) Morganti R., Holt J., Saripalli L., Oosterloo T. A., Tadhunter C. N., 2007, A&A, 476, 735
- Morganti et al. (2003) Morganti R., Oosterloo T. A., Emonts B. H. C., van der Hulst J. M., Tadhunter C. N., 2003, ApJ, 593, L69
- Morganti et al. (2005a) Morganti R., Oosterloo T. A., Tadhunter C. N., van Moorsel G., Emonts B., 2005a, A&A, 439, 521
- Morganti et al. (2001) Morganti R., Oosterloo T. A., Tadhunter C. N., van Moorsel G., Killeen N., Wills K. A., 2001, MNRAS, 323, 331
- Morganti et al. (2015) Morganti R., Sadler E. M., Curran S., 2015, Advancing Astrophysics with the Square Kilometre Array (AASKA14), 134
- Morganti et al. (2005b) Morganti R., Tadhunter C. N., Oosterloo T. A., 2005b, A&A, 444, L9
- Murphy et al. (2003) Murphy M. T., Webb J. K., Flambaum V. V., 2003, MNRAS, 345, 609
- Noterdaeme et al. (2017) Noterdaeme P. et al., 2017, A&A, 597, A82
- Noterdaeme et al. (2012) Noterdaeme P. et al., 2012, A&A, 540, A63
- Noterdaeme et al. (2015) Noterdaeme P., Srianand R., Rahmani H., Petitjean P., Pâris I., Ledoux C., Gupta N., López S., 2015, A&A, 577, A24
- Orienti et al. (2006) Orienti M., Morganti R., Dallacasa D., 2006, A&A, 457, 531
- Peck et al. (1999) Peck A. B., Taylor G. B., Conway J. E., 1999, ApJ, 521, 103
- Peck et al. (2000) Peck A. B., Taylor G. B., Fassnacht C. D., Readhead A. C. S., Vermeulen R. C., 2000, ApJ, 534, 104
- Péroux et al. (2012) Péroux C., Bouché N., Kulkarni V. P., York D. G., Vladilo G., 2012, MNRAS, 419, 3060
- Pihlström et al. (2003) Pihlström Y. M., Conway J. E., Vermeulen R. C., 2003, A&A, 404, 871
- Purcell & Field (1956) Purcell E. M., Field G. B., 1956, ApJ, 124, 542
- Rao et al. (2006) Rao S., Turnshek D., Nestor D. B., 2006, ApJ, 636, 610
- Reimers et al. (2003) Reimers D., Baade R., Quast R., Levshakov S. A., 2003, A&A, 410, 785
- Röttgering et al. (1999) Röttgering H., de Bruyn G., Pentericci L., Miley G., 1999, in The Most Distant Radio Galaxies, Röttgering H. J. A., Best P. N., Lehnert M. D., eds., p. 113
- Salter et al. (2010) Salter C. J., Saikia D. J., Minchin R., Ghosh T., Chandola Y., 2010, ApJ, 715, L117
- Schlegel et al. (1998) Schlegel D. J., Finkbeiner D. P., Davis M., 1998, ApJ, 500, 525
- Skrutskie et al. (2006) Skrutskie M. F. et al., 2006, AJ, 131, 1163
- Srianand et al. (2015) Srianand R., Gupta N., Momjian E., Vivek M., 2015, MNRAS, 451, 917
- Srianand et al. (2010) Srianand R., Gupta N., Petitjean P., Noterdaeme P., Ledoux C., 2010, MNRAS, 405, 1888
- Srianand et al. (2012) Srianand R., Gupta N., Petitjean P., Noterdaeme P., Ledoux C., Salter C. J., Saikia D. J., 2012, MNRAS, 421
- Tzanavaris et al. (2007) Tzanavaris P., Murphy M. T., Webb J. K., Flambaum V. V., Curran S. J., 2007, MNRAS, 374, 634
- Tzanavaris et al. (2005) Tzanavaris P., Webb J. K., Murphy M. T., Flambaum V. V., Curran S. J., 2005, PhRvL, 95, 041301
- Uson et al. (1991) Uson J. M., Bagri D. S., Cornwell T. J., 1991, PhRvL, 67, 3328
- van Gorkom et al. (1989) van Gorkom J. H., Knapp G. R., Ekers R. D., Ekers D. D., Laing R. A., Polk K. S., 1989, AJ, 97, 708
- Vermeulen et al. (2003) Vermeulen R. C. et al., 2003, A&A, 404, 861
- Webb et al. (2011) Webb J. K., King J. A., Murphy M. T., Flambaum V. V., Carswell R. F., Bainbridge M. B., 2011, PhRvL, 107, 191101
- Wiklind & Combes (1994) Wiklind T., Combes F., 1994, A&A, 286, L9
- Wiklind & Combes (1995) Wiklind T., Combes F., 1995, A&A, 299, 382
- Wiklind & Combes (1996) Wiklind T., Combes F., 1996, A&A, 315, 86
- Wiklind & Combes (1998) Wiklind T., Combes F., 1998, ApJ, 500, 129
- Wright et al. (2010) Wright E. L. et al., 2010, AJ, 140, 1868
- Yan et al. (2012) Yan T., Stocke J. T., Darling J., Hearty F., 2012, AJ, 144, 124
- Yan et al. (2016) Yan T., Stocke J. T., Darling J., Momjian E., Sharma S., Kanekar N., 2016, AJ, 151, 74
- Yentis et al. (1992) Yentis D. J., Cruddace R. G., Gursky H., Stuart B. V., Wallin J. F., MacGillivray H. T., Collins C. A., 1992, in Astrophysics and Space Science Library, Vol. 174, Digitised Optical Sky Surveys, MacGillivray H. T., Thomson E. B., eds., p. 67