11email: damiani@astropa.inaf.it 22institutetext: INAF - Osservatorio Astrofisico di Catania, via S. Sofia 78, 95123, Catania, Italy 33institutetext: Astrophysics Group, Keele University, Keele, Staffordshire ST5 5BG, United Kingdom 44institutetext: INAF - Osservatorio Astrofisico di Arcetri, Largo E. Fermi 5, 50125, Firenze, Italy 55institutetext: Centro de Astrobiología (CSIC-INTA), ESAC campus, Camino bajo del castillo s/n, 28 692 Villanueva de la Cañada, Madrid, Spain 66institutetext: Armagh Observatory, College Hill, Armagh BT61 9DG, UK 77institutetext: School of Mathematics & Physics, Queen’s University Belfast, Belfast BT61 7NN, UK 88institutetext: Faculty of Mathematics and Physics, University of Ljubljana, Jadranska 19, 1000, Ljubljana, Slovenia 99institutetext: Dipartimento di Fisica e Chimica, Università di Palermo, Piazza del Parlamento 1, 90134, Palermo, Italy 1010institutetext: Institute of Astronomy, University of Cambridge, Madingley Road, Cambridge CB3 0HA, UK 1111institutetext: GEPI, Observatoire de Paris, CNRS, Université Paris Diderot, 5 Place Jules Janssen, 92190 Meudon, France 1212institutetext: Moscow MV Lomonosov State University, Sternberg Astronomical Institute, Moscow 119992, Russia 1313institutetext: Dipartimento di Fisica e Astronomia, Sezione Astrofisica, Università di Catania, via S. Sofia 78, 95123, Catania, Italy 1414institutetext: Instituto de Física y Astronomiía, Universidad de Valparaiíso, Chile 1515institutetext: European Southern Observatory, Alonso de Cordova 3107 Vitacura, Santiago de Chile, Chile 1616institutetext: Instituto de Astrofísica de Andalucía-CSIC, Apdo. 3004, 18080, Granada, Spain 1717institutetext: INAF - Osservatorio Astronomico di Bologna, via Ranzani 1, 40127, Bologna, Italy 1818institutetext: Núcleo de Astronomía, Facultad de Ingeniería, Universidad Diego Portales, Av. Ejercito 441, Santiago, Chile 1919institutetext: Astrophysics Research Institute, Liverpool John Moores University, 146 Brownlow Hill, Liverpool L3 5RF, United Kingdom 2020institutetext: Departamento de Ciencias Fisicas, Universidad Andres Bello, Republica 220, Santiago, Chile 2121institutetext: INAF - Osservatorio Astronomico di Padova, Vicolo dell’Osservatorio 5, I-35122, Padova, Italy
Gaia-ESO Survey: global properties of clusters Trumpler 14 and 16 in the Carina Nebula. ††thanks: Based on observations collected with the FLAMES spectrograph at VLT/UT2 telescope (Paranal Observatory, ESO, Chile), for the Gaia-ESO Large Public Survey (program 188.B-3002).
Abstract
Aims. We present the first extensive spectroscopic study of the global population in star clusters Trumpler 16, Trumpler 14 and Collinder 232 in the Carina Nebula, using data from the Gaia-ESO Survey, down to solar-mass stars.
Methods. In addition to the standard homogeneous Survey data reduction, a special processing was applied here because of the bright nebulosity surrounding Carina stars.
Results. We find about four hundred good candidate members ranging from OB types down to slightly sub-solar masses. About one-hundred heavily-reddened early-type Carina members found here were previously unrecognized or poorly classified, including two candidate O stars and several candidate Herbig Ae/Be stars. Their large brightness makes them useful tracers of the obscured Carina population. The spectroscopically-derived temperatures for nearly 300 low-mass members allows the inference of individual extinction values, and the study of the relative placement of stars along the line of sight.
Conclusions. We find a complex spatial structure, with definite clustering of low-mass members around the most massive stars, and spatially-variable extinction. By combining the new data with existing X-ray data we obtain a more complete picture of the three-dimensional spatial structure of the Carina clusters, and of their connection to bright and dark nebulosity, and UV sources. The identification of tens of background giants enables us also to determine the total optical depth of the Carina nebula along many sightlines. We are also able to put constraints on the star-formation history of the region, with Trumpler 14 stars found to be systematically younger than stars in other sub-clusters. We find a large percentage of fast-rotating stars among Carina solar-mass members, which provide new constraints on the rotational evolution of pre-main-sequence stars in this mass range.
Key Words.:
Open clusters and associations: individual (Trumpler 14, Trumpler 16, Carina Nebula) – stars: pre-main-sequence1 Introduction
The Carina Nebula is one of the most massive HII regions known in the Galaxy. It contains a large population of massive OB stars (the Car OB1 association), several Wolf-Rayet stars, and the well known LBV star Carinae. Most of the stellar content of the Carina Nebula is found concentrated in a few clusters, notably Trumpler 16 (Tr 16, hosting Car itself) and Trumpler 14 (Tr 14), about 10′ NNW of Car. Less conspicuous clusters associated with the Nebula include Trumpler 15, Collinder 228 and Collinder 232. The distance to Car has been precisely determined to be 2.35 kpc (Smith 2006). Car OB1 contains some of the most massive O stars known, including rare examples of O3, and even O2 stars. The properties of the region were reviewed by Smith and Brooks (2007, 2008). More recently, the whole Carina star-formation region (SFR) was thoroughly investigated by means of a mosaic of Chandra X-ray observations (CCCP: Chandra Carina Complex Project; Townsley et al. 2011, and all papers in the series), after earlier X-ray studies of the central clusters Trumpler 16 and 14 with both Chandra (Albacete-Colombo et al. 2008) and XMM-Newton (Antokhin et al. 2008). The X-ray data have been crucial to demonstrate the existence of a population (both clustered and diffuse) of stars, undoubtedly associated with the SFR, being most likely low-mass young stars formed in the Nebula several millions years ago. Detailed studies of the stellar population in Carina have been until now exclusively directed towards characterizing its rich massive-star members, while are still largely missing for its lower-mass population. For example, DeGioia-Eastwood et al. (2001) reported optical photometry for only stars in Trumpler 16 and 14. Only fairly recently deep optical photometry on more than 4500 stars in the same region was published by Hur et al. (2012), allowing optical counterparts of faint X-ray sources to be studied. Spectroscopic studies of the low-mass PMS stars in these clusters are almost entirely lacking; Vaidya et al. (2015) present low-resolution spectra of 11 PMS stars.
The study of low-mass PMS stars at the distance of Carina, and sometimes embedded within obscuring dust and/or bright nebular emission, is time-consuming and technically challenging. At the same time, it is important to test whether the early evolution of stars under such “extreme” ambient conditions, dominated by the presence of hundreds OB stars, do differ from that in “quieter” SFRs (e.g. Taurus-Auriga, or also Orion). Recent results from X-ray and IR surveys suggest that stars formed in rich clusters (e.g., Carina, Cygnus X, NGC3603, Westerlund 1 and 2) may be an important, if not dominant, component of all stars in the Galaxy, thus more representative of the “average Milky-Way star” than stars formed in less rich SFRs like e.g., Tau-Aur, Chamaeleon, or IC348 (see e.g., Lada and Lada 2003). Therefore, the study of Carina stars across the whole mass spectrum is likely to be relevant for a better understanding of the general stellar population in the Galaxy.
It is not clear whether the various clusters in Carina are coeval, and if not, if this can be attributed to triggered or sequential star formation processes. Evidences for triggered formation in Carina have been discussed by Smith et al. (2010), but focusing on a different part of the nebula (the ’southern pillars’) than that studied here, with some overlap only in the Tr 16 SE obscured region. In the central part of Carina studied here, evidence for recent or ongoing star formation is less frequent than in the southern parts (Povich et al. 2011b). Among the central Carina clusters, Tr 14 was suggested to be 1-2 Myr younger than Tr 16, because of its more compact structure and other characteristics (Walborn 1995, Smith 2006). It is however unclear if Tr 16 can still be considered as a single cluster with a rather sparse population, or rather as several physical clusters, as suggested by the X-ray results of Feigelson et al. (2011).
In order to complement the studies of massive stars in Carina, and obtain a more complete understanding of the star formation processes which have taken place in its recent past, we present here the first spectroscopic study of a sizable population of hundreds lower-mass stars (down to approximately one solar mass), using data from the Gaia-ESO Survey (Gilmore et al. 2012, Randich et al. 2013). The same observational dataset was used in a previous work (Damiani et al. 2016, Paper I) to study the dynamics of the ionized gas in the Carina HII region from optical nebular emission lines.
This paper is structured as follows: in Section 2 we describe the composition of the observed sample; Section 3 discusses cluster membership for the observed stars; Section 4 discusses massive stars which happen to fall within our sample; Section 5 discusses the spatial clustering of stars; Section 6 is devoted to a discussion of reddening; Section 7 presents Color-magnitude diagrams; Section 8 compares results from the present data with those from X-ray data; Section 9 discusses the structure of the whole region; Section 10 discusses stellar ages, and Section 11 the rotational properties of Carina stars. Eventually, we summarize our results in Section 12.
2 Observations and data analysis
2.1 The observed sample
In this work we study a set of spectra of 1085 distinct stars in the Carina Nebula, obtained with the FLAMES/Giraffe multi-fibre spectrometer at the ESO VLT/UT2 telescope on April 6-9, 2014, and released as part of the iDR4 Gaia-ESO data release. The total number of individual spectra was 1465, but all spectra relative to the same star were coadded to improve signal-to-noise ratio (SNR). Simultaneously, spectra with the FLAMES/UVES high-resolution spectrograph were obtained, which will be presented separately (Spina et al. in prep.). All spectra considered here are taken using Giraffe setup HR15n (, wavelength range 6444-6818Å), as in all Gaia-ESO observations of cool stars in open clusters; the (known) OB stars in Carina are instead being observed using different Giraffe setups, to obtain a more comprehensive set of diagnostics, better suited to hot stars (the massive star spectra are not part of the current data release and will be studied in a later work). As a consequence, we will be able to give only a rough classification for the early-type stars which happen to fall within the sample studied here. The approach for deriving stellar parameters for later spectral types was instead described in Damiani et al. (2014) and Lanzafame et al. (2015).
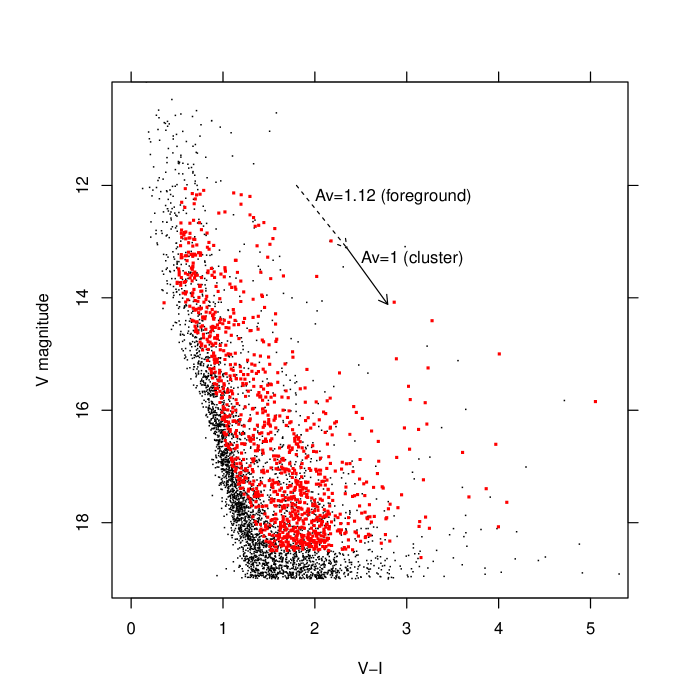
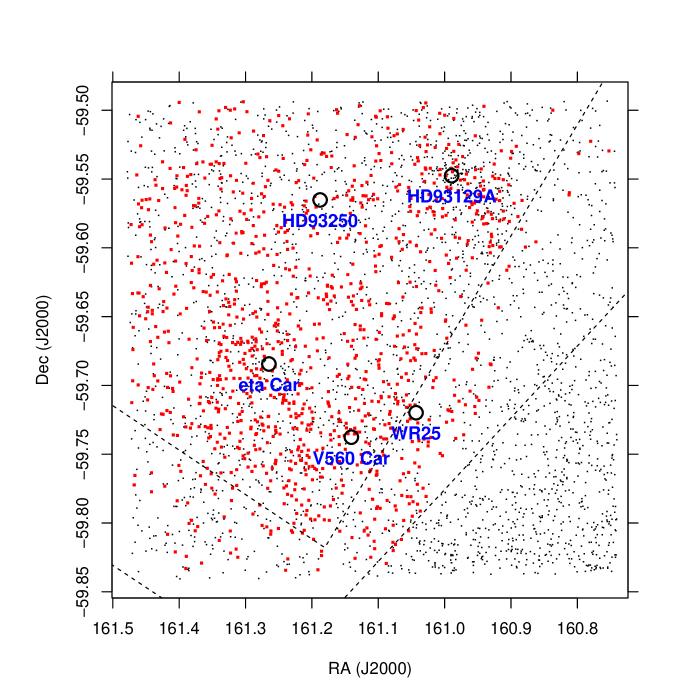
The basis for our FLAMES target selection was the optical photometry published by Hur et al. (2012). This study covered a field, approximately in size, comprising only the central portions of the entire Nebula, and thus limited to the large clusters Tr 16 and 14, and the less rich Collinder 232. Moreover, we have not observed with the HR15n setup stars brighter than (massive stars, observed with different Giraffe setups), nor fainter than , in order to obtain an acceptable minimum SNR. Since low-mass stars in the Carina SFR have not yet arrived on the Zero-Age Main Sequence (ZAMS), we also excluded stars in that region of the color-magnitude diagram (CMD); also a spatial region near the edge of the photometric field-of-view, apparently dominated by field stars, was not observed; finally, random sampling of the remaining stars was made to avoid an exceedingly long target list. This procedure follows the general strategy for target selection in the Gaia-ESO Survey described in Bragaglia et al. (in preparation). The CMD of both the Hur et al. (2012) input catalog and our spectroscopically observed stars is shown in Fig. 1. Fig. 2 shows instead the spatial distribution of input and observed stars. The median SNR of our 1085 spectra is 36.2.
2.2 Data analysis
The Gaia-ESO Survey data analysis process is distributed among several Working Groups, whose task is to apply homogeneous procedures to all datasets to ensure a high degree of internal coherence. As explained in Paper I, however, the Carina Nebula presents a number of unanticipated features, which are not dealt with accurately using standard procedures/pipelines, like the spatially nonuniform sky continuum level due to reflection nebulosity and the wide H wings due to both high-velocity ionized gas and reflection in the Nebula. This required to take a step back and redo part of the analysis, especially regarding a more appropriate subtraction of the sky spectrum, as described in the following. All derived parameters used here are released in the internal GESiDR4 data release, database table AstroAnalysis. This reports the detailed results from each analysis “node”, and their merged values produced by the relevant Working Group (WG12 in our case); because of the mentioned difficulties, results obtained from individual nodes sometimes using non-standard, ad-hoc procedures were preferred to WG12 results in the case of stellar parameters (from node “OAPA”) and of lithium equivalent widths (EW; node “OACT”), while radial and rotational velocities were taken as those produced by WG12 (or node “OAPA” when these latter were missing).
The details of the special background-subtraction procedure employed by the OAPA node before evaluating stellar parameters are given in Appendix A. In short, after having separately corrected all atmospheric sky features, nebular lines are corrected using each of the nearest five sky spectra: the range of corrections obtained is an estimate of the uncertainty involved in the procedure, while the median of the five corrected spectra is taken as the best estimate stellar spectrum, for stellar parameter derivation. Lithium EWs were computed by different nodes, with results in good mutual agreement, using slightly different methods as explained in Lanzafame et al. (2015); the EW set from the OACT node was chosen because of its largest sample coverage. The WG12 radial and rotational velocities include contributions from both the OACT node, using methods detailed in Frasca et al. (2015), and OAPA node, using cross-correlation as briefly described in Damiani et al. (2014); a very good agreement is found for stars in common.
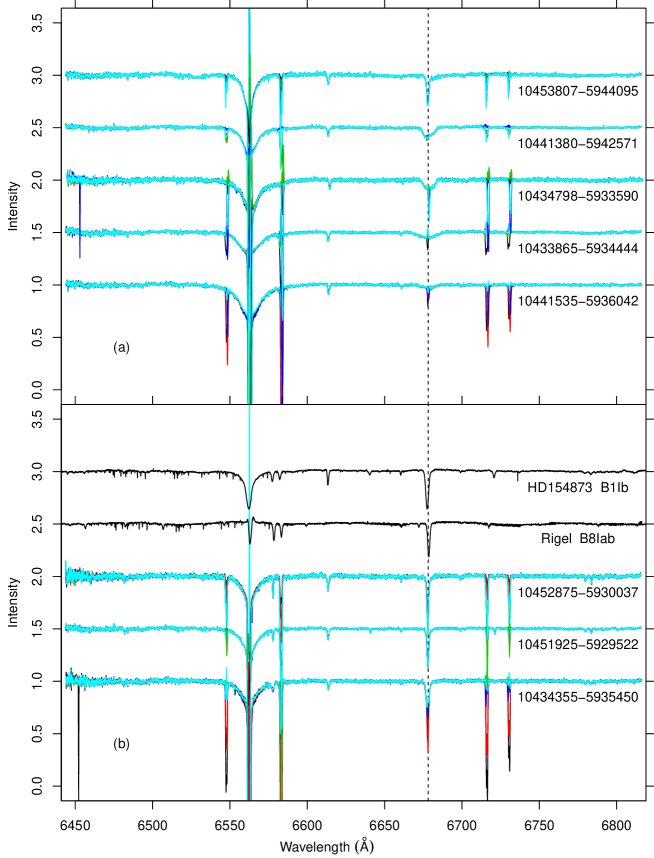
With the collection of five-fold nebular-subtracted stellar spectra obtained as explained in Appendix A, we proceeded with our estimates of stellar parameters (done five times per star), using the method explained in Damiani et al. (2014). This latter was purposely developed to deal with the spectral range and resolution of Giraffe HR15n data, and defines a set of spectral indices and their calibration to derive Teff, , and [Fe/H] for stars later than A2. The range spanned by each parameter in its own set of five determinations corresponds to the systematic error introduced by sky correction, often larger than the statistical error. Depending on the intensity ratio between the nebular H wings and and the stellar H wings, these latter may in some cases be exceedingly affected by nebular emission, and cannot be used as a temperature diagnostic, e.g. in A to mid-G stars111The most important features of stellar spectra in the HR15N wavelength range are described in Damiani et al. (2014).. For mid-A to lower-mass stars, fortunately, other indicators may be used to estimate temperatures (although the increased dependence on metallicity must be treated with caution). The problem is worst for early-A stars, where almost the only spectral line in HR15n range is H. Much weaker lines are found in the blue extreme of the HR15n range, where grating efficiency is however very low, and are therefore difficult to use in low-SNR spectra. In practice, many faint early-A stars are recognized in the Tr 14/16 dataset as those having a nearly flat, featureless continuum spectrum, with indefinite properties in the H region because of the predominant nebular emission. B-type stars are instead easily recognized because of their He I 6678Å line: the He I nebular line at the same wavelength has usually no wings (Paper I), and is much narrower than the stellar line, often broadened by fast rotation.
The wide nebular H wings are also of great nuisance when trying to selecting stars with intrinsic wide H emission because of accretion from a circumstellar disk (e.g. Classical T Tauri stars - CTTS - or Herbig Ae/Be stars - HAeBe). Here again, the five-fold nebular-subtracted star spectra are of invaluable help in separating cases where the apparent wide emission in the net spectrum arises from poorly subtracted nebular H wings (as it will not be present in all five net spectra) from truly wide H lines of CTTS/HAeBe stars.
2.3 Auxiliary data sets
The stellar population of the Carina nebula was the object of several recent studies. We have therefore cross-matched our spectroscopic targets with objects in several existing catalogues. A match with the CCCP X-ray source catalog (Broos et al. 2011a) yielded 352 matches among our 1085 sample stars. The match was made assuming a constant error on optical positions of 0.2 arcsec, individual catalogued X-ray position errors, and a 4- maximum distance. The number of spurious matches was estimated as 13, by artificially shifting one of the two position lists by arcmin. Then we considered the VPHAS DR2 Point Source Catalogue (Drew et al. 2014) with photometry in the bands and H. Using a maximum matching distance of 5 , and constant position errors of 0.2 arcsec for both optical and VPHAS catalogues, we obtain 1074 matches (of which estimated as spurious). However, the number of stars with a clean=yes photometric flag in all of , , and H bands, matching our target list, is of only 171. Last, we matched similarly our targets to the Young Stellar Object (YSO) catalogue of Zeidler et al. (2016), obtained from both VISTA and Spitzer near/mid-IR data. The number of matches is 64 ( spurious), of which however only 7 have catalogued magnitudes in all four Spitzer IRAC bands (). All of these latter were already members by spectroscopic criteria, see below.
3 Cluster membership
Since the chosen sample-selection strategy for Gaia-ESO Giraffe observations is inclusive of most possible members, membership of observed stars to each cluster must be determined post-facto. The emphasis here being on young, low-mass stars (FGK stars), the most useful membership indicators are the lithium line EW and strong X-ray emission, in addition to radial velocity (RV) as usual. Wide H emission wings, indicative of circumstellar accretion in pre-main-sequence (PMS) stars, is a strong evidence of extreme youth and probable membership to a SFR, even in the absence of a RV measurement (e.g., in cases of strong-emission stars without observable photospheric absorption lines). As described above, a star must show wide H emission consistently across the multiple (five) sky-subtraction options, in order to be considered a reliable CTTS/HAeBe. This conservative approach undoubtedly misses some real emission-line members, but is a minor issue for building a reliable member list, since the other membership criteria may compensate for this. Narrow, chromospheric H emission cannot be used here as a youth indicator, being swamped by the nebular emission lines whatever the sky-subtraction option chosen. In order to minimize the number of spurious members, a star is generally accepted as member only when it satisfies at least two criteria among: (with and to be determined), lithium EW mÅ, X-ray detection, and CTTS/HAeBe status. However, since each of these criteria may include significant numbers of contaminants (e.g., G stars up to an age of about 1 Gyr would fall above our lithium EW threshold), some additional screening was applied, as described below.
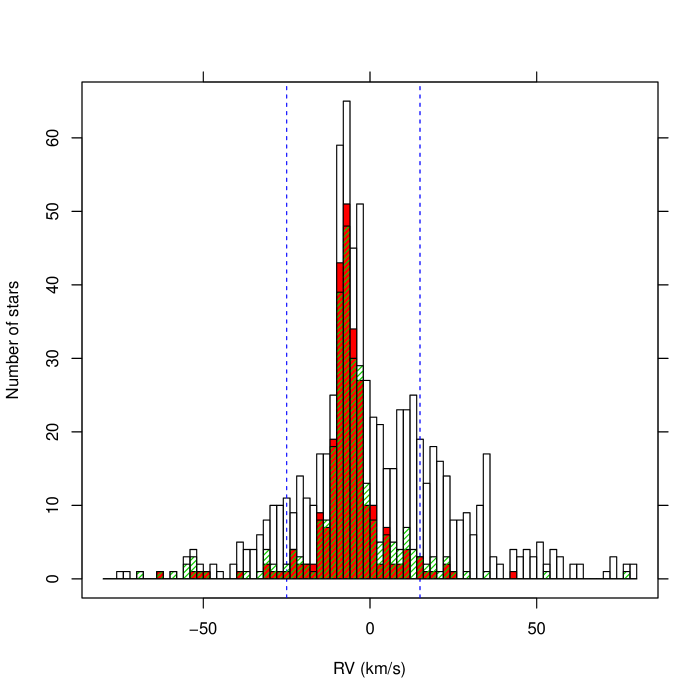
To help determining and , Figure 3 shows a histogram of RV for stars with K (and SNR). Colored histograms refer to lithium- and X-ray-selected candidates: they select essentially the same population of low-mass Carina members. From this Figure, we find that good values for and are respectively and 20 km/s, the latter being chosen to be rather inclusive since additional indicators are also used for final membership assessment222 The value of mean radial velocity is in good agreement with that of the local molecular gas, see e.g. Rebolledo et al. (2016, their Fig.5), with heliocentric km/s corresponding to km/s.. According to the above stated general rule, inside the dashed RV limits only one membership criterion (the RV criterion being fulfilled) is sufficient to consider a star as a member; outside of them, at least two indicators are needed. The number of stars shown in the total histogram is 755; scaled to this number, we expect 9 spurious optical-X-ray matches to be included in these histograms, distributed uniformly per star (not per RV interval): therefore, most of the spurious X-ray matches will lie inside the dashed lines, where most stars are found. This justifies in part the several bins containing X-ray detections in excess of lithium-rich stars. For the same reason, we expect 6-7 contaminants among candidate members found only from RV and X-ray criteria.
A handful of stars satisfying the “general” membership criteria above are found in the CMD very near the ZAMS at the cluster distance (or anyway at apparent ages Myr according to Siess et al. 2000 isochrones), even after accounting for reddening as in the following sections. Upon individual examination, only two333These are the candidate HAeBe star [HSB2012] 2504, and the star [HSB2012] 2692, showing strong lithium, IR excess in the 2MASS bands, and association with a YSO. of these 17 stars showed strong enough indications of membership to be retained in our list, while the others, mostly low-SNR spectra with poorly constrained parameters, were removed. Of these latter, six were simultaneously RV- and X-ray members, in very good agreement with their expected number.
Among our targets, additional candidate CTTS members were searched, but none found, using other catalogues: the VPHAS data, in particular using the diagram locus as in Kalari et al. (2015); the 2MASS data; and finally the Spitzer data from Broos et al. (2011a; table 6), considering disk-bearing stars with colors and . To this stage, the number of low-mass candidate Carina members (colder than K) found is 303, of which approximately 150 candidate CTTS.
We find also many stars with Teff above 6500 K, which already at this young age have no traces of lithium, and are sometimes rotating so fast that an accurate derivation of RV might not be possible. Moreover, it is known that A-type stars are not strong coronal X-ray emitters (e.g., Schmitt 1997), so that our member list is least reliable for stars earlier than type F (approximately K). Early-A and B-type stars, of which we find several tens, are instead rare in the field, so that most of them can be safely considered as Carina members (adding to the 303 low-mass candidates), even though their RVs might sometimes not be accurately determined because of fast rotation.
3.1 A young field-star population
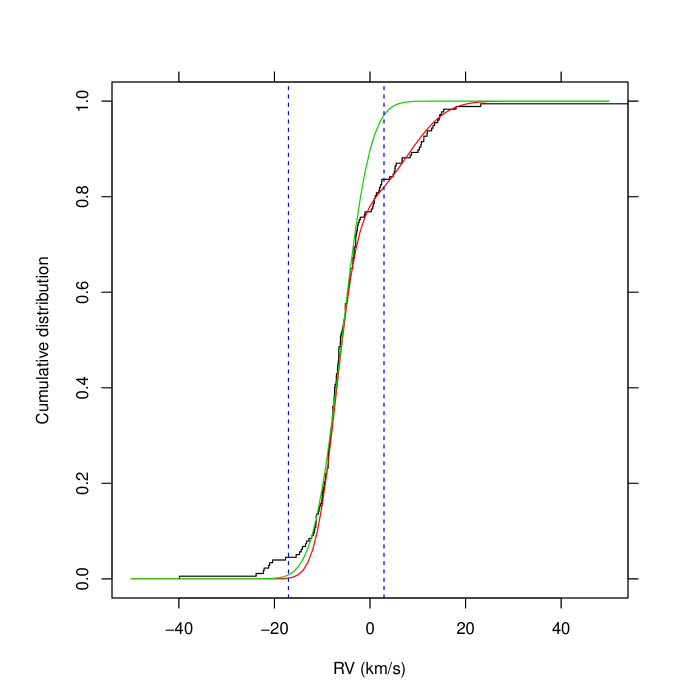
A more detailed examination of candidate members is done from their cumulative RV distribution, as shown in Figure 4. The black curve is the RV cumulative distribution for all single member stars with K, km/s, and SNR (177 stars). A cumulative Gaussian distribution fitted to the median RV range between km/s is shown with the green curve (maximum-likelihood parameters km/s, km/s). However, an obvious asymmetry is present between the two tails of the Gaussian distribution, with an excess of stars at km/s. Unrecognized binaries are only expected to produce symmetric tails. We inspected all spectra of stars with to check that no RV determination errors were present, to a level which might justify the observed discrepancy. The red curve shows therefore the cumulative distribution corresponding to two superimposed Gaussians, with maximum-likelihood parameters: km/s, km/s; and km/s, km/s. The main Gaussian distribution accounts for 77% of stars in the subsample considered here. The still mis-fit tail at km/s may be attributed to either binaries or an additional small population, of 6-7 stars, which was not examined further. The stars in the positive-velocity Gaussian are too many to be explained by spurious X-ray matches, whose number was quantified above: therefore, they are likely genuine X-ray bright and/or lithium rich stars, or young stars in general. Their discrepant RV distribution with respect to the main Carina population does not entitle us to consider them as Carina members. Based on their approximate RV we will refer to these stars as “RV10 stars”. There are 29 RV10 stars with km/s, K, km/s, and SNR.
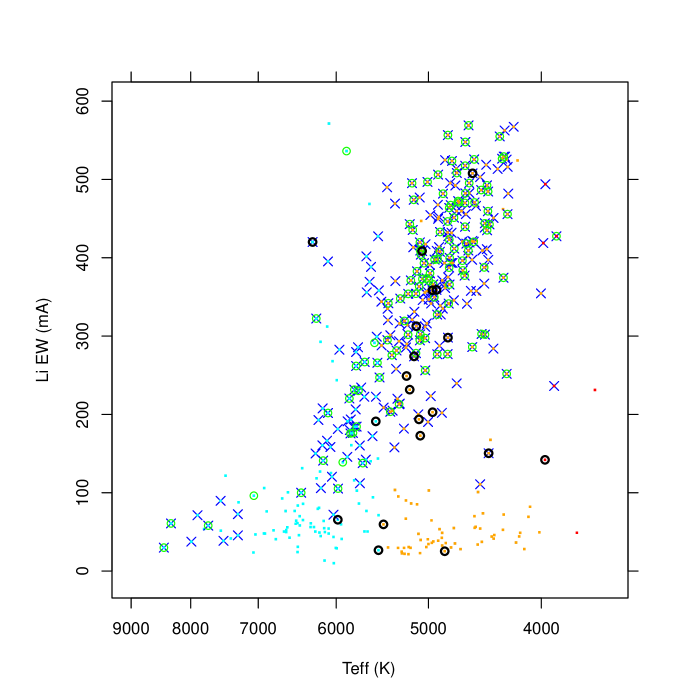
We investigate the nature of the RV10 group by means of the Teff-lithium EW diagram (Figure 5): the RV10 stars account for most of the low-lithium candidate members; however, more than one-half of the RV10 stars have Li EW mÅ, and follow the same relation with Teff as Carina members, to which are apparently coeval. All RV10 stars with Li EW mÅ have extinction (as determined in Section 6) higher than the foreground towards Carina (Hur et al. 2012). Nearly one-half of the RV10 stars have instead low extinction, suggesting that they are foreground stars; at the same time, many of these latter stars have significant Li EWs, indicating they are young stars (say Myr), in agreement with their frequent X-ray detection (18/29 stars). The spatial distribution of RV10 stars does not show clustering, and their location on the optical CMD often does not overlap the main cluster locus. We conclude that the RV10 are dominated by a group of (17) foreground young stars, unrelated to the Carina cluster, probably spanning a significant age range, and characterized by a common dynamics. Also their distribution is typical of young low-mass stars. We therefore speculate that they are a remnant from a now dissolved cluster, closer to us than the Carina nebula, in the same sky direction.
The 12 RV10 stars with are instead probable Carina low-mass members, whose net number becomes 286. Among them we find 8 SB2 binaries: this appears as a low percentage compared to other studies (e.g. Mathieu 1994); however, fast rotation, frequently found among Carina members (see Section 11) may render double-lined systems more difficult to detect, so we cannot draw firm conclusions on this subject for Carina stars. We do not consider these SB2 stars in the rest of the paper. The identifications and properties of Carina members are listed in Tables 3.1 and 3.1, while those of the RV10 group are in Tables 1 and 2.
longtableccccccccc
Identifications for late-type Carina members.
Column HSB2012 reports the identifier in Hur et al. (2012); column
CXOGNC is the identifier in Broos et al. (2011a); column ADM2008 is the
identifier in Albacete-Colombo et al. (2008); column YSO is the identifier
in Zeidler et al. (2016).
magnitudes, and colors are from Hur et al. (2012).
HSB2012 CXOGNC ADM2008 YSO RA Dec
(J2000) (J2000)
\endfirstheadcontinued.
HSB2012 CXOGNC ADM2008 YSO RA Dec
(J2000) (J2000)
\endhead\endfoot796 … … … 10:43:31.96 -59:33:56.4 16.36 0.93 1.15
800 104332.23-593511.3 … … 10:43:32.25 -59:35:11.5 16.20 0.80 1.11
908 104336.77-593315.2 … … 10:43:36.77 -59:33:15.2 14.72 0.68 1.17
907 … … … 10:43:36.77 -59:36:48.2 17.12 1.10 1.19
954 104338.76-593301.9 … … 10:43:38.80 -59:33:01.8 16.21 1.08 1.50
953 104338.81-593423.7 … … 10:43:38.80 -59:34:23.8 18.19 … 2.33
995 104340.13-593356.0 … 104340.14-593356.3 10:43:40.13 -59:33:56.1 18.32 … 2.09
998 104340.19-593449.5 … … 10:43:40.18 -59:34:49.6 17.04 1.55 2.13
1035 104341.45-593352.7 … … 10:43:41.45 -59:33:52.8 13.33 0.73 1.14
1051 104341.97-593352.6 … … 10:43:41.90 -59:33:53.0 17.86 … 1.86
1069 … … … 10:43:42.60 -59:32:52.6 18.20 … 2.17
1072 104342.69-593554.0 … … 10:43:42.69 -59:35:54.1 18.32 … 1.99
1095 104343.50-593612.8 … … 10:43:43.52 -59:36:13.2 17.59 1.22 1.79
1102 104343.88-593556.6 … … 10:43:43.89 -59:35:56.4 18.30 … 1.94
1114 104344.33-593425.6 … … 10:43:44.29 -59:34:25.7 13.97 0.97 1.43
1135 104344.84-593456.6 … … 10:43:44.85 -59:34:56.7 17.24 1.51 2.13
1157 … … 104345.81-592949.7 10:43:45.81 -59:29:49.7 15.31 0.99 1.39
1158 104345.85-593327.1 … … 10:43:45.81 -59:33:26.8 17.07 1.52 1.96
1159 104345.86-593346.6 … … 10:43:45.88 -59:33:46.7 15.97 1.05 1.44
1160 104345.91-593457.2 … … 10:43:45.90 -59:34:57.3 17.63 1.46 1.84
1168 104346.01-593328.8 … 104346.01-593328.7 10:43:46.01 -59:33:28.7 15.60 1.45 1.89
1167 104346.05-593305.7 … … 10:43:46.02 -59:33:05.5 16.00 0.79 1.14
1170 104346.16-593438.4 … … 10:43:46.10 -59:34:38.4 18.33 0.49 1.63
1183 104346.44-593442.3 … … 10:43:46.43 -59:34:42.4 12.47 0.56 1.02
1199 104346.87-593233.6 … … 10:43:46.88 -59:32:33.8 17.93 1.72 2.02
1204 104346.97-593318.2 … 104346.98-593318.3 10:43:46.98 -59:33:18.2 16.73 1.48 1.99
1268 … … 104348.78-593235.7 10:43:48.78 -59:32:35.7 17.74 1.56 1.85
1282 104349.07-593256.7 … … 10:43:49.12 -59:32:56.8 17.54 1.40 1.91
1286 104349.17-593402.8 … 104349.20-593403.0 10:43:49.20 -59:34:02.9 18.48 … 2.41
1316 104350.07-593626.1 … … 10:43:50.07 -59:36:26.2 17.55 1.42 2.15
1325 104350.42-593400.2 … … 10:43:50.43 -59:34:00.5 17.81 1.53 1.92
1370 104351.81-593550.1 … 104351.86-593550.4 10:43:51.87 -59:35:50.3 18.24 … 2.02
1389 104352.31-593922.2 … 104352.30-593922.3 10:43:52.30 -59:39:22.3 17.48 1.52 2.33
1405 104352.88-593301.7 … … 10:43:52.87 -59:33:01.8 16.17 … 2.05
1429 … … … 10:43:53.50 -59:32:01.2 17.40 1.52 1.78
1455 104354.36-593303.0 … … 10:43:54.37 -59:33:02.9 14.28 … 1.57
1470 104354.87-593129.3 … … 10:43:54.89 -59:31:29.4 16.49 1.50 1.82
1477 104355.13-593330.3 … … 10:43:55.10 -59:33:30.5 16.56 1.15 1.84
1483 104355.19-593228.2 … … 10:43:55.33 -59:32:27.9 18.16 … 2.10
1493 104355.71-593627.1 … … 10:43:55.71 -59:36:27.4 17.95 1.28 2.02
1501 … … … 10:43:55.94 -59:32:10.0 17.28 1.27 1.80
1503 … … 104355.99-594418.5 10:43:55.99 -59:44:18.6 17.87 1.38 2.06
1511 104356.20-593532.6 … … 10:43:56.20 -59:35:32.6 18.10 … 1.96
1528 104356.67-593021.9 … … 10:43:56.68 -59:30:21.8 13.81 1.01 1.09
1531 104356.68-593147.3 … … 10:43:56.74 -59:31:47.5 16.74 1.60 2.02
1539 104356.94-593217.7 … … 10:43:56.90 -59:32:17.6 17.97 1.43 1.87
1553 104357.43-593232.2 … … 10:43:57.40 -59:32:32.3 17.04 … 1.58
1569 104357.72-593324.1 … … 10:43:57.76 -59:33:23.9 14.06 0.84 1.19
1580 104358.04-593717.4 … 104358.04-593717.9 10:43:58.04 -59:37:18.0 17.60 1.57 2.08
1620 … … … 10:43:59.27 -59:43:36.3 18.26 … 2.55
1627 104359.52-593435.0 … … 10:43:59.53 -59:34:35.0 17.36 1.33 1.84
1646 104359.99-593012.9 … 104400.01-593013.0 10:44:00.01 -59:30:13.0 17.37 1.28 1.87
1661 … … … 10:44:00.67 -59:34:17.4 15.05 1.10 1.50
1665 104400.81-593439.1 … 104400.81-593439.1 10:44:00.82 -59:34:39.1 16.63 1.52 1.98
1668 104400.91-593351.1 … … 10:44:00.91 -59:33:51.3 17.61 1.63 2.19
1676 104401.10-593535.1 … 104401.12-593535.3 10:44:01.12 -59:35:35.3 14.98 0.66 1.13
1686 104401.59-593235.0 … … 10:44:01.59 -59:32:34.9 16.34 1.42 1.76
1690 104401.71-593249.4 … 104401.73-593249.5 10:44:01.70 -59:32:49.4 17.33 2.01 2.11
1689 104401.69-593101.6 … … 10:44:01.74 -59:31:01.6 15.55 1.18 1.49
1693 104401.73-593008.1 … 104401.79-593008.0 10:44:01.80 -59:30:08.0 17.03 1.21 1.65
1699 104402.09-593751.2 41 104402.09-593752.3 10:44:02.09 -59:37:52.3 14.84 1.07 1.50
1725 104403.00-593354.6 … … 10:44:03.01 -59:33:54.5 15.73 1.23 1.56
1734 104403.37-593137.2 … … 10:44:03.40 -59:31:37.2 16.01 1.44 1.72
1772 104404.77-593524.7 … … 10:44:04.83 -59:35:24.4 16.59 0.90 1.20
1783 104405.18-593232.1 … … 10:44:05.19 -59:32:32.1 17.28 1.44 1.92
1784 104405.19-593413.8 … … 10:44:05.21 -59:34:14.0 16.89 1.23 1.66
1805 104406.22-593131.0 … … 10:44:06.24 -59:31:30.9 17.77 1.65 1.93
1816 104406.70-593148.3 … … 10:44:06.71 -59:31:48.2 17.97 … 2.43
1822 104406.77-593234.6 … … 10:44:06.77 -59:32:34.7 17.88 1.93 2.22
1828 104406.83-592941.0 … … 10:44:06.85 -59:29:41.0 17.26 1.77 2.09
1832 … … … 10:44:07.01 -59:32:31.0 17.71 1.88 2.01
1834 104407.08-593110.8 … 104407.11-593110.8 10:44:07.11 -59:31:10.8 18.03 1.35 2.13
1848 … … … 10:44:07.77 -59:46:28.7 16.99 0.76 1.29
1859 104408.18-593246.6 … … 10:44:08.18 -59:32:46.5 16.66 1.42 1.71
1874 104408.71-593610.2 63 … 10:44:08.71 -59:36:10.5 15.58 1.09 1.41
1885 104408.95-593132.2 … … 10:44:08.97 -59:31:32.2 13.81 0.84 1.13
1904 104409.43-593425.1 … … 10:44:09.40 -59:34:25.3 15.69 … 1.39
1916 104409.85-593204.1 … … 10:44:09.87 -59:32:04.2 18.06 1.53 2.05
1933 … … 104410.20-593741.3 10:44:10.19 -59:37:41.5 18.41 … 2.18
1935 104410.19-593554.6 … … 10:44:10.20 -59:35:54.5 18.33 … 1.84
1938 104410.28-593000.9 … … 10:44:10.31 -59:30:01.1 17.70 1.24 1.67
1954 104410.83-593221.4 … … 10:44:10.87 -59:32:21.3 18.05 1.76 1.99
1962 … … 104411.10-594048.6 10:44:11.10 -59:40:48.7 17.75 1.26 1.93
1992 104412.27-593424.6 … 104412.28-593424.8 10:44:12.26 -59:34:24.6 17.34 1.25 1.84
1999 104412.44-593544.5 … 104412.52-593544.9 10:44:12.52 -59:35:45.0 18.44 … 2.32
2002 104412.59-593412.6 … … 10:44:12.55 -59:34:12.4 14.59 0.52 0.71
2007 … … … 10:44:12.84 -59:39:37.2 14.03 1.00 1.33
2016 104413.03-593321.9 … … 10:44:13.05 -59:33:21.9 18.18 1.65 2.00
2036 104413.83-594224.5 92 … 10:44:13.86 -59:42:24.9 17.73 1.21 1.82
2037 104413.91-594129.0 93 … 10:44:13.90 -59:41:29.3 17.55 1.39 1.92
2057 104414.86-593525.6 … … 10:44:14.88 -59:35:25.4 18.16 1.31 1.78
2062 104414.96-593050.6 … … 10:44:14.99 -59:30:50.5 18.43 … 1.94
2105 104416.31-593314.6 … 104416.36-593314.9 10:44:16.37 -59:33:14.9 17.76 1.37 1.86
2124 104417.10-593101.8 … 104417.12-593102.0 10:44:17.11 -59:31:01.9 17.05 1.17 1.60
2123 104417.12-594156.7 105 … 10:44:17.12 -59:41:56.8 17.49 1.95 2.10
2142 104417.69-594236.0 110 … 10:44:17.71 -59:42:36.0 18.27 … 1.87
2145 104417.80-594220.7 … … 10:44:17.84 -59:42:21.2 18.17 … 2.10
2148 104417.84-594356.3 111 … 10:44:17.95 -59:43:57.0 18.41 0.89 1.87
2157 … … … 10:44:18.27 -59:31:06.7 18.41 1.58 2.01
2184 104419.19-593151.2 … … 10:44:19.21 -59:31:51.0 18.28 … 2.15
2195 104419.52-594351.6 115 … 10:44:19.51 -59:43:51.9 18.37 1.46 2.02
2207 104420.13-594339.6 119 … 10:44:20.14 -59:43:39.6 18.36 0.99 1.86
2208 104420.17-594229.7 121 … 10:44:20.16 -59:42:29.7 17.45 1.35 1.85
2210 104420.00-593825.6 120 … 10:44:20.19 -59:38:26.5 18.35 … 1.89
2230 104421.05-594419.9 126 … 10:44:21.05 -59:44:19.9 17.74 1.10 1.65
2288 104423.32-593001.4 … 104423.32-593001.6 10:44:23.31 -59:30:01.5 17.39 1.46 1.91
2290 … … … 10:44:23.40 -59:35:56.2 18.50 1.16 1.54
2300 104423.67-594114.6 147 … 10:44:23.62 -59:41:15.1 16.94 1.35 1.73
2299 104423.63-593153.5 … … 10:44:23.65 -59:31:53.4 15.85 1.27 1.56
2305 104424.04-594055.8 151 … 10:44:24.05 -59:40:55.9 16.54 1.18 1.52
2331 104424.79-593959.2 155 … 10:44:24.83 -59:39:59.6 18.35 … 2.11
2335 104424.90-593702.6 156 … 10:44:24.89 -59:37:02.6 17.48 1.55 1.88
2337 104424.96-593647.8 157 … 10:44:24.98 -59:36:47.8 17.91 1.60 1.81
2348 104425.38-594354.9 160 … 10:44:25.40 -59:43:54.9 17.94 1.15 1.76
2359 104425.71-594353.3 164 … 10:44:25.65 -59:43:53.5 17.80 1.38 1.92
2363 104425.77-593354.6 … … 10:44:25.82 -59:33:54.1 18.37 1.40 1.84
2371 104426.28-594241.1 170 … 10:44:26.29 -59:42:41.2 17.43 1.25 1.77
2381 104426.57-593250.9 … … 10:44:26.61 -59:32:50.7 17.90 1.84 2.03
2399 … … … 10:44:27.30 -59:44:32.3 18.18 1.64 1.82
2405 104427.50-593353.9 … … 10:44:27.46 -59:33:53.9 17.88 1.30 1.75
2421 104428.09-593308.6 … … 10:44:28.10 -59:33:08.7 15.33 1.34 1.60
2433 104428.34-594123.7 182 … 10:44:28.35 -59:41:23.8 16.28 1.18 1.52
2439 104428.49-594145.0 184 104428.48-594145.1 10:44:28.47 -59:41:45.1 17.01 1.34 1.64
2460 104429.08-594143.1 191 … 10:44:29.08 -59:41:43.2 15.27 1.09 1.44
2477 104429.75-594332.7 200 … 10:44:29.77 -59:43:32.7 17.50 1.51 1.84
2479 104429.78-593413.4 … … 10:44:29.80 -59:34:13.3 17.06 1.43 1.71
2482 104429.89-593317.0 … 104429.90-593317.2 10:44:29.90 -59:33:17.0 18.08 1.70 2.12
2495 104430.30-593402.6 … … 10:44:30.30 -59:34:02.5 15.77 1.11 1.41
2504 … … … 10:44:30.50 -59:37:47.7 17.38 0.86 1.54
2506 104430.56-593924.9 209 … 10:44:30.55 -59:39:24.7 13.46 0.66 1.02
2513 104430.84-592948.4 … … 10:44:30.84 -59:29:48.1 17.59 1.40 1.81
2517 104431.01-594205.2 213 … 10:44:31.01 -59:42:05.2 18.27 … 1.92
2519 104431.13-594305.0 215 … 10:44:31.10 -59:43:04.9 18.21 … 1.93
2531 104431.86-593841.0 223 … 10:44:31.86 -59:38:41.6 17.93 … 1.84
2540 104432.25-593110.8 … … 10:44:32.27 -59:31:10.8 16.14 1.24 1.57
2551 104432.54-594351.6 231 … 10:44:32.54 -59:43:51.7 16.81 1.20 1.55
2553 104432.56-594406.6 230 … 10:44:32.56 -59:44:06.7 13.64 0.60 0.91
2554 104432.58-593303.5 … … 10:44:32.57 -59:33:03.3 14.18 0.40 0.68
2555 104432.63-593225.9 … … 10:44:32.67 -59:32:25.5 18.15 1.33 1.81
2565 104433.12-594002.0 237 … 10:44:33.10 -59:40:02.2 18.04 … 2.07
2569 104433.15-593356.2 … … 10:44:33.19 -59:33:55.6 17.93 … 1.91
2568 … … … 10:44:33.20 -59:36:43.0 17.99 1.50 2.18
2570 104433.23-593348.4 … 104433.21-593349.0 10:44:33.21 -59:33:49.0 17.48 1.72 2.19
2584 104433.97-593733.9 245 … 10:44:33.96 -59:37:34.0 17.79 1.64 2.00
2585 104434.01-594354.8 249 104434.02-594355.1 10:44:34.03 -59:43:55.3 16.50 1.14 1.78
2597 … … … 10:44:34.69 -59:33:30.7 18.03 1.79 2.13
2598 104434.80-593526.6 … 104434.80-593526.3 10:44:34.80 -59:35:26.3 15.86 1.49 1.90
2602 104434.94-594405.8 251 104434.93-594405.8 10:44:34.92 -59:44:06.0 17.43 … 1.84
2606 104434.99-594142.4 252 … 10:44:35.00 -59:41:42.4 18.48 … 2.04
2609 … … … 10:44:35.11 -59:40:04.6 18.22 … 2.60
2618 104435.54-594350.9 260 … 10:44:35.53 -59:43:51.0 17.40 1.60 1.87
2624 104435.87-594446.9 266 … 10:44:35.86 -59:44:47.0 17.28 1.26 1.59
2636 104436.33-594411.0 271 … 10:44:36.33 -59:44:11.1 17.34 1.35 1.74
2635 104436.39-593944.4 272 … 10:44:36.35 -59:39:44.3 18.19 0.82 2.02
2643 104436.68-594622.0 278 104436.66-594621.8 10:44:36.66 -59:46:21.8 17.78 1.36 1.93
2669 104437.81-594331.0 297 … 10:44:37.82 -59:43:31.0 18.45 0.98 1.82
2674 104438.08-594434.8 301 104438.08-594434.9 10:44:38.08 -59:44:35.0 16.64 1.33 1.72
2675 104438.10-594131.3 304 … 10:44:38.09 -59:41:31.4 17.29 1.46 1.90
2677 104438.17-594311.2 307 104438.16-594311.3 10:44:38.17 -59:43:11.4 16.52 1.48 1.82
2680 104438.22-594333.7 308 … 10:44:38.22 -59:43:34.0 18.02 1.40 1.88
2692 … … 104438.66-593007.8 10:44:38.64 -59:30:07.6 18.29 0.97 1.80
2708 … … … 10:44:39.15 -59:29:58.7 15.94 0.96 1.24
2726 104439.91-594358.1 325 … 10:44:39.90 -59:43:58.3 16.17 1.15 1.50
2755 104440.91-594524.7 334 … 10:44:40.87 -59:45:24.7 14.43 0.62 0.71
2760 104441.11-594422.9 339 104441.08-594422.9 10:44:41.09 -59:44:22.9 18.34 1.30 1.98
2761 104441.17-593819.4 342 … 10:44:41.14 -59:38:19.5 16.60 1.34 1.81
2763 104441.32-594408.6 345 … 10:44:41.31 -59:44:08.8 17.04 1.18 1.68
2769 104441.43-593841.5 … … 10:44:41.60 -59:38:41.7 18.35 … 2.02
2774 104441.76-594047.7 351 … 10:44:41.76 -59:40:47.8 16.20 1.29 1.74
2779 104441.98-594215.8 354 … 10:44:41.97 -59:42:16.0 16.95 1.18 1.58
2782 104442.16-594243.1 357 … 10:44:42.16 -59:42:43.2 18.36 … 2.00
2812 104443.54-594718.1 376 … 10:44:43.54 -59:47:17.9 17.02 1.42 1.85
2818 104443.94-593955.7 379 … 10:44:43.95 -59:39:55.7 17.94 … 1.89
2833 104444.63-593154.8 … … 10:44:44.61 -59:31:55.1 17.24 1.50 1.79
2846 104445.30-593919.1 392 … 10:44:45.28 -59:39:19.3 15.78 1.15 1.71
2866 104446.20-594449.2 400 … 10:44:46.21 -59:44:49.4 17.56 1.23 1.77
2872 104446.53-593413.3 … … 10:44:46.50 -59:34:13.4 13.22 0.44 0.76
2887 104447.43-593508.3 408 … 10:44:47.43 -59:35:08.1 17.52 1.32 2.43
2890 104447.62-594326.0 … … 10:44:47.58 -59:43:26.0 15.18 0.99 1.31
2898 104447.78-594606.7 413 104447.77-594606.7 10:44:47.78 -59:46:06.7 17.69 1.44 1.98
2902 104447.97-594309.2 416 … 10:44:47.97 -59:43:09.5 17.93 1.37 1.78
2908 104448.39-593143.6 … … 10:44:48.38 -59:31:43.6 16.21 1.11 1.45
2909 104448.37-594113.9 417 … 10:44:48.40 -59:41:14.0 16.06 1.51 2.12
2923 104448.97-594343.6 419 104448.98-594343.5 10:44:48.99 -59:43:43.5 16.73 1.43 1.88
2926 104449.00-594044.8 420 … 10:44:49.03 -59:40:44.6 16.44 1.65 2.19
2946 104449.66-594503.3 429 … 10:44:49.69 -59:45:03.3 17.94 1.11 1.70
2947 104449.75-594208.1 431 104449.75-594208.3 10:44:49.76 -59:42:08.1 17.88 1.46 2.10
2949 104449.77-594727.4 432 104449.78-594727.3 10:44:49.79 -59:47:27.3 18.02 1.82 2.28
2948 … 434 … 10:44:49.81 -59:43:57.5 17.50 1.19 1.59
2950 104449.84-593211.3 … … 10:44:49.82 -59:32:11.4 15.45 1.03 1.33
2966 104450.13-594523.6 441 104450.13-594523.6 10:44:50.12 -59:45:23.6 17.68 1.31 1.75
2967 104450.12-594738.7 440 … 10:44:50.14 -59:47:38.7 17.44 1.51 1.93
2970 104450.34-594017.4 446 … 10:44:50.37 -59:40:17.4 17.14 … 2.04
2972 104450.44-594540.9 447 … 10:44:50.43 -59:45:40.8 15.32 1.13 1.46
2985 104450.78-593410.3 … 104450.82-593410.2 10:44:50.82 -59:34:10.2 18.50 … 2.15
2987 104450.90-594435.4 451 104450.91-594435.5 10:44:50.91 -59:44:35.7 17.86 1.37 1.93
3019 104452.18-594515.1 467 104452.16-594515.2 10:44:52.12 -59:45:15.4 18.15 … 2.25
3021 104452.23-594155.1 468 … 10:44:52.24 -59:41:55.2 15.77 1.17 1.52
3032 104452.51-594159.9 470 … 10:44:52.53 -59:42:00.1 16.36 1.42 1.91
3041 104452.76-594319.0 473 … 10:44:52.75 -59:43:19.0 17.51 1.45 1.91
3044 … … … 10:44:52.85 -59:33:04.5 16.91 0.91 1.33
3051 104453.39-594353.0 479 … 10:44:53.40 -59:43:53.2 18.18 1.46 1.94
3065 104453.70-593309.1 … … 10:44:53.68 -59:33:09.2 16.49 1.04 1.30
3067 104453.71-594324.1 482 … 10:44:53.72 -59:43:24.5 16.13 1.14 1.70
3073 104453.87-594314.0 485 … 10:44:53.86 -59:43:14.1 15.82 1.08 1.43
3089 … … … 10:44:54.38 -59:40:00.5 14.19 0.48 0.77
3094 104454.48-594243.1 497 … 10:44:54.49 -59:42:43.2 17.96 1.37 2.05
3102 104454.76-593600.1 501 … 10:44:54.76 -59:36:00.6 17.39 1.09 1.37
3104 104454.82-594351.6 503 … 10:44:54.83 -59:43:51.7 16.95 1.31 1.73
3112 104455.10-594824.4 507 … 10:44:55.07 -59:48:24.4 18.13 1.58 2.26
3116 104455.27-594648.5 509 … 10:44:55.27 -59:46:48.7 18.21 1.22 1.70
3120 104455.42-594453.4 513 … 10:44:55.43 -59:44:53.5 17.19 1.61 2.11
3134 104456.11-593657.3 … … 10:44:56.08 -59:36:57.6 15.73 1.05 1.38
3136 104456.14-594538.1 521 … 10:44:56.14 -59:45:38.1 17.64 1.40 1.83
3158 … … … 10:44:56.90 -59:39:46.2 16.55 1.40 1.44
3161 104456.87-594145.3 531 … 10:44:56.90 -59:41:45.3 18.10 … 2.15
3198 104458.02-594224.4 553 104458.03-594224.4 10:44:58.00 -59:42:24.5 17.04 1.53 1.94
3196 104458.02-594709.4 552 … 10:44:58.00 -59:47:09.6 16.85 1.37 1.91
3200 104458.07-594628.1 554 … 10:44:58.10 -59:46:28.3 16.70 1.34 1.75
3217 104458.59-594246.0 562 104458.60-594246.1 10:44:58.62 -59:42:46.1 18.45 … 2.11
3219 104458.62-594039.0 563 … 10:44:58.70 -59:40:39.1 16.92 1.21 1.62
3244 104459.72-593406.9 … 104459.54-593407.3 10:44:59.53 -59:34:07.3 18.11 1.54 2.16
3271 104500.47-593937.5 589 … 10:45:00.50 -59:39:37.5 17.32 1.31 1.81
3287 104501.04-593235.5 … … 10:45:00.97 -59:32:36.3 15.94 0.90 1.00
3294 104501.07-593917.6 603 … 10:45:01.12 -59:39:17.7 17.37 1.39 1.79
3319 104501.98-594023.7 620 … 10:45:02.00 -59:40:23.8 16.22 1.36 1.73
3326 104502.25-594536.4 631 … 10:45:02.26 -59:45:36.4 18.40 … 2.15
3338 104502.90-594225.8 638 … 10:45:02.90 -59:42:26.0 18.07 1.69 2.16
3358 104503.62-594320.8 650 … 10:45:03.60 -59:43:20.9 16.39 1.23 1.52
3359 104503.67-594348.4 651 … 10:45:03.70 -59:43:48.6 18.33 … 2.05
3367 104503.91-593819.8 656 … 10:45:03.90 -59:38:20.1 16.42 1.17 1.77
3374 104504.23-594010.9 658 … 10:45:04.20 -59:40:10.9 16.67 … 1.62
3395 104505.07-593733.5 670 … 10:45:05.07 -59:37:33.6 15.77 1.13 1.47
3399 104505.11-593345.7 … … 10:45:05.18 -59:33:45.8 16.65 1.37 1.82
3409 104505.43-594358.6 679 … 10:45:05.40 -59:43:58.8 18.13 1.27 1.76
3412 104505.59-594530.7 680 … 10:45:05.60 -59:45:30.7 17.50 … 1.91
3415 104505.70-594343.7 682 … 10:45:05.71 -59:43:43.6 15.18 1.32 1.68
3425 104505.91-594023.9 691 … 10:45:05.90 -59:40:24.2 17.25 … 1.50
3427 104505.97-594341.1 692 … 10:45:05.93 -59:43:41.4 16.18 1.55 1.90
3435 … … … 10:45:06.15 -59:37:34.4 17.69 1.38 1.79
3438 104506.22-593940.1 698 … 10:45:06.20 -59:39:40.4 17.56 1.29 1.72
3443 … … … 10:45:06.28 -59:37:41.6 18.24 … 1.98
3442 … … … 10:45:06.30 -59:41:18.2 15.66 0.85 0.97
3454 104506.80-594446.2 709 … 10:45:06.81 -59:44:46.1 15.53 1.11 1.52
3480 104507.78-594026.3 721 … 10:45:07.80 -59:40:26.4 18.23 … 1.86
3485 104507.96-593725.3 726 … 10:45:07.95 -59:37:25.3 18.21 … 2.02
3488 … 727 … 10:45:08.20 -59:40:06.0 17.87 … 1.80
3505 104508.59-594017.0 734 … 10:45:08.60 -59:40:17.2 15.62 1.15 1.44
3508 104508.63-594134.5 736 … 10:45:08.70 -59:41:34.7 16.60 1.44 1.80
3524 104509.20-593851.6 748 … 10:45:09.23 -59:38:52.0 18.30 1.11 2.07
3531 104509.56-594043.5 753 … 10:45:09.60 -59:40:43.3 16.30 1.11 1.44
3541 … … … 10:45:09.70 -59:40:23.3 18.45 … 1.79
3536 104509.71-594245.6 756 … 10:45:09.72 -59:42:45.5 16.67 1.20 1.75
3549 104509.92-594121.4 760 … 10:45:09.90 -59:41:21.3 18.29 … 1.93
3554 104510.12-594352.9 763 … 10:45:10.08 -59:43:53.4 18.19 1.21 2.04
3557 104510.26-594229.6 767 … 10:45:10.30 -59:42:29.9 17.96 1.63 1.99
3558 104510.34-594028.8 769 … 10:45:10.40 -59:40:28.9 16.88 1.34 1.56
3578 104511.06-594457.2 786 … 10:45:11.08 -59:44:57.2 17.12 … 1.76
3577 104511.09-594533.5 787 104511.08-594533.5 10:45:11.08 -59:45:33.5 17.89 1.55 2.12
3617 104512.89-594504.4 814 … 10:45:12.84 -59:45:04.0 16.27 … 1.69
3628 104513.29-593521.0 816 … 10:45:13.28 -59:35:21.2 17.98 1.58 2.08
3633 104513.36-594005.7 819 … 10:45:13.40 -59:40:06.0 18.10 … 1.89
3636 104513.55-594404.3 822 … 10:45:13.55 -59:44:04.3 17.58 1.56 2.06
3644 … … … 10:45:13.68 -59:39:56.7 17.70 1.37 1.58
3650 104514.08-594315.5 830 … 10:45:14.06 -59:43:15.5 17.97 1.54 1.97
3660 104514.51-594246.9 834 … 10:45:14.52 -59:42:47.1 17.85 1.56 2.16
3668 104514.90-594441.6 839 … 10:45:14.90 -59:44:41.6 18.23 … 1.81
3683 … … … 10:45:15.29 -59:37:53.7 16.25 2.23 3.22
3692 104515.50-594012.8 845 … 10:45:15.51 -59:40:12.9 17.04 1.41 1.65
3716 104516.52-594214.9 853 … 10:45:16.60 -59:42:14.9 18.21 1.56 2.11
3722 104516.74-594007.7 857 … 10:45:16.76 -59:40:08.0 17.95 … 1.82
3732 … … … 10:45:17.26 -59:31:11.9 18.32 1.66 2.12
3749 104517.86-593709.9 871 … 10:45:17.89 -59:37:09.6 18.06 1.43 2.05
3808 104520.16-593919.3 886 … 10:45:20.14 -59:39:19.6 18.31 1.34 1.85
3830 104520.84-594012.7 892 … 10:45:20.88 -59:40:13.0 14.59 0.97 1.29
3834 104520.95-594548.7 894 … 10:45:20.97 -59:45:48.9 17.37 1.57 2.34
3846 104521.32-593546.3 … … 10:45:21.27 -59:35:46.4 18.13 1.29 1.74
3847 104521.36-594134.4 896 104521.36-594134.6 10:45:21.36 -59:41:34.6 18.02 1.47 2.07
3849 … … … 10:45:21.40 -59:39:28.5 18.27 1.34 1.93
3860 104521.73-594302.5 … … 10:45:21.73 -59:43:02.4 17.07 1.05 1.44
3873 104521.99-594052.6 903 104522.00-594052.7 10:45:22.00 -59:40:52.7 17.07 1.88 2.05
3875 104522.05-594145.7 905 … 10:45:22.06 -59:41:45.8 15.77 1.27 1.64
3879 104522.11-593755.0 906 … 10:45:22.14 -59:37:55.4 17.51 1.55 1.86
3909 104523.55-593914.0 913 … 10:45:23.56 -59:39:14.1 14.51 0.53 0.70
3916 104523.69-594144.6 916 … 10:45:23.70 -59:41:44.6 18.24 1.54 2.10
3954 … … … 10:45:24.83 -59:41:26.0 17.20 1.46 1.75
3956 … … … 10:45:24.97 -59:42:45.4 17.83 1.42 1.89
3970 104525.58-594350.9 928 … 10:45:25.58 -59:43:50.9 16.67 1.36 1.86
4049 104528.89-594347.9 958 … 10:45:28.87 -59:43:47.9 18.18 1.60 2.28
4187 104535.42-594544.9 987 … 10:45:35.42 -59:45:44.8 17.27 1.09 2.08
4218 104536.96-593320.4 … … 10:45:36.94 -59:33:20.5 15.98 1.15 1.32
4244 104538.35-594207.5 1002 … 10:45:38.34 -59:42:07.9 13.55 0.60 1.16
4274 … … … 10:45:39.70 -59:40:08.2 18.45 … 3.07
4282 104540.44-594830.6 1009 104540.30-594829.7 10:45:40.30 -59:48:29.7 16.43 1.52 2.38
4338 104543.71-594147.7 1020 104543.66-594148.1 10:45:43.67 -59:41:48.2 17.99 … 2.62
4366 104544.68-594134.1 … … 10:45:44.94 -59:41:34.6 14.15 0.52 0.64
4392 104546.27-594637.4 1027 … 10:45:46.07 -59:46:38.5 13.92 0.47 0.57
4415 104547.10-593419.8 … … 10:45:47.09 -59:34:19.9 17.52 1.26 1.65
longtablecrr@rr@rc@ccr@rr@rccc
Parameters of late-type Carina members.
Column HSB2012 reports the identifier in Hur et al. (2012).
SNR is the spectrum median signal/noise ratio.
RV is the heliocentric radial velocity.
Errors on Teff are statistical only. The gravity index is
defined in Damiani et al. (2014).
Column “log age” is the
photometric age. Column H reports “Y” if an excess H emission is
detected, either from accretion (CTTS) or chromospheric, distinct from
the nebular H emission. Column “SB2” is “Y” for SB2 binaries.
HSB2012 SNR RV
Teff Li EW
log age
H SB2
(km/s) (km/s)
(K) (mÅ) (yr)
\endfirstheadcontinued.
HSB2012 SNR RV
Teff Li EW
log age
H SB2
(km/s) (km/s)
(K) (mÅ) (yr)
\endhead\endfoot796 17.0 2.5 2.5 20.3 3.3 5694 218 0.75 137.8 12.0 1.01 0.015 … Y N
800 43.1 -0.7 6.2 74.2 8.1 5978 95 0.81 105.3 6.4 1.009 0.006 … Y N
908 62.5 -11.5 7.4 30.0 12.7 7541 92 1.77 89.7 3.9 0.999 0.004 … N N
907 28.5 -4.9 0.6 13.6 1.7 4869 95 0.31 202.0 6.6 0.969 0.009 6.98 N N
954 49.6 -6.5 8.0 69.0 2.7 5727 67 1.52 160.3 6.3 1.01 0.005 … N N
953 25.9 -3.6 1.4 24.8 1.5 4865 104 2.78 371.0 8.3 1.022 0.01 6.30 N N
995 16.6 -6.8 2.0 13.0 1.6 5019 172 2.44 373.8 11.0 0.999 0.016 … Y N
998 47.0 -9.3 7.0 92.4 1.4 4942 60 2.44 349.6 7.4 1.011 0.006 6.12 Y N
1035 130.4 -0.7 15.1 99.4 9.6 7498 43 1.67 38.6 2.3 0.998 0.002 … N N
1051 18.2 -5.2 2.0 15.0 0.5 5177 159 2.04 371.1 7.9 1.028 0.015 6.89 Y N
1069 21.1 -4.2 1.3 15.0 0.5 4453 101 1.86 435.1 8.6 0.995 0.012 … Y N
1072 17.8 -0.5 8.2 63.0 0.5 4676 125 1.80 396.3 18.0 0.982 0.015 6.62 Y N
1095 30.2 -29.5 17.5 87.7 9.3 6099 126 2.39 395.3 16.0 1.03 0.009 … N N
1102 18.6 -11.3 2.0 24.0 0.5 5601 206 2.46 388.3 11.0 1.004 0.014 … N N
1114 102.1 15.7 12.1 185.3 2.6 6158 45 1.61 … … 1.009 0.003 … Y N
1135 38.2 -2.3 1.3 33.7 1.5 4639 68 2.07 418.0 7.7 1.007 0.007 5.95 Y N
1157 35.7 -6.6 3.5 30.0 0.5 5833 114 1.33 175.7 6.9 0.998 0.007 … Y N
1158 37.1 -48.0 31.4 145.3 7.5 4888 68 1.98 407.7 12.0 1.015 0.007 6.22 Y N
1159 53.2 -15.7 25.3 132.0 20.5 6392 89 1.81 … … 1.009 0.005 … N N
1160 29.5 -8.7 1.7 30.0 0.5 5299 114 2.09 293.4 8.0 1.006 0.009 6.88 N N
1168 83.1 -18.6 29.6 171.3 3.2 6099 49 2.62 201.8 6.4 1.012 0.003 … Y N
1167 45.5 -20.1 32.9 20.8 10.0 7659 126 1.76 … … 0.992 0.006 … N N
1170 15.3 -5.2 3.1 24.0 0.5 4652 142 0.97 470.0 14.0 0.971 0.017 … Y N
1183 163.0 … … 63.4 10.0 … … … 27.6 1.9 1.001 0.002 … Y N
1199 21.1 -31.6 9.8 89.4 14.1 4838 116 2.05 524.7 19.0 1.037 0.012 6.46 N N
1204 35.4 -8.3 2.0 27.0 0.5 5092 84 2.26 363.3 5.8 1.011 0.007 6.24 Y N
1268 20.2 -5.9 1.2 28.1 2.3 4798 124 1.62 423.2 10.0 1.021 0.013 6.55 Y N
1282 28.2 -4.9 2.7 37.9 1.6 4808 99 1.78 427.4 8.7 1.02 0.009 6.37 N N
1286 17.2 -7.3 1.6 24.0 0.5 4858 152 2.96 481.8 12.0 1.002 0.015 6.33 Y N
1316 28.3 -7.4 1.9 21.0 0.5 5227 118 2.73 412.2 7.2 1.006 0.009 … N N
1325 36.0 -4.7 1.9 33.0 0.5 5081 84 2.10 302.2 7.5 1.017 0.007 6.69 Y N
1370 20.2 -8.7 1.1 18.0 0.5 5243 151 2.44 319.3 9.6 0.99 0.013 6.93 Y N
1389 46.7 -9.5 1.1 24.0 0.5 5126 68 3.06 354.1 6.3 1.01 0.006 6.25 Y N
1405 53.2 -4.3 1.8 38.6 2.6 4621 48 1.85 409.2 5.0 1.01 0.005 5.63 Y N
1429 27.9 -7.3 5.0 54.4 1.2 4884 95 1.58 338.8 8.7 1.009 0.009 6.50 N N
1455 45.5 -4.3 3.8 41.5 3.0 5785 85 1.72 184.3 6.2 1.011 0.006 5.95 N N
1470 49.6 -7.4 1.9 40.1 1.6 4998 61 1.82 346.7 5.4 1.008 0.005 6.23 N N
1477 46.3 -5.3 1.0 15.0 0.5 4994 66 1.85 370.4 4.8 1.009 0.006 6.24 Y N
1483 18.6 -6.6 3.4 33.0 0.5 4773 126 2.16 523.6 12.0 0.98 0.014 6.45 Y N
1493 24.6 -8.1 1.8 27.0 0.5 4906 116 2.14 449.6 8.6 1.004 0.011 6.53 N N
1501 31.8 -11.2 5.4 80.0 1.8 4813 87 1.52 432.4 10.0 1.015 0.008 6.38 N N
1503 32.3 -3.0 6.7 70.3 5.5 6643 141 3.38 … … 1.007 0.008 … Y N
1511 21.2 -3.5 6.6 47.0 1.6 5747 170 2.58 285.7 11.0 1.022 0.012 … N N
1528 121.5 -20.4 0.2 11.3 1.4 5708 32 0.65 … … 1.006 0.002 6.26 N N
1531 41.3 -15.0 4.8 77.3 4.5 4478 59 1.56 387.7 7.4 0.995 0.006 5.70 Y N
1539 20.0 -4.6 4.2 48.0 0.5 4610 128 1.44 419.5 12.0 0.996 0.013 6.55 N N
1553 26.6 -2.5 17.8 116.1 9.3 4974 115 1.23 341.6 16.0 0.996 0.01 6.63 N N
1569 76.4 -1.2 10.3 77.1 11.8 6401 61 1.27 … … 1.009 0.003 … N N
1580 31.8 15.7 3.0 28.5 10.0 5127 102 2.50 … … 1.003 0.008 … Y Y
1620 19.5 1.9 1.3 9.4 2.0 6241 191 4.19 322.4 8.2 1.027 0.013 … Y N
1627 28.4 -7.4 3.9 50.3 3.9 4501 68 1.19 302.7 8.6 0.979 0.009 6.19 Y N
1646 34.3 -3.6 1.4 21.0 0.5 4751 73 1.62 411.6 7.0 1.006 0.008 6.30 Y N
1661 59.6 -9.3 2.9 31.0 1.6 6250 73 1.82 150.1 4.5 1.004 0.004 … N N
1665 51.8 -3.5 5.0 77.6 3.4 5088 59 2.23 354.1 6.8 1.008 0.005 6.21 Y Y
1668 32.2 -5.1 15.1 113.1 5.1 4323 62 1.70 526.5 13.0 0.999 0.008 5.83 Y N
1676 54.6 -0.3 8.4 25.3 10.0 7728 108 1.78 58.0 4.9 0.994 0.005 … Y N
1686 61.2 -6.2 2.5 54.8 1.5 5057 50 1.71 346.0 4.9 1.006 0.004 6.26 N N
1690 37.0 -7.8 1.1 15.7 1.5 4887 77 2.33 432.9 5.8 0.994 0.007 6.19 Y N
1689 58.2 -3.8 12.0 105.0 8.8 5711 65 1.49 234.3 7.0 1.006 0.004 … N N
1693 21.7 -6.0 2.8 37.0 1.6 4677 119 1.04 420.6 10.0 0.992 0.012 6.35 N N
1699 95.2 -3.8 4.6 75.0 0.5 6157 40 1.78 141.0 5.1 1.005 0.003 … Y N
1725 67.0 -13.2 2.6 66.5 5.8 5367 53 1.50 204.8 5.0 1.004 0.004 6.44 N N
1734 63.5 -7.9 3.7 62.0 3.1 4966 46 1.54 360.9 5.0 1.008 0.004 6.10 N N
1772 28.5 -2.9 2.2 10.2 1.7 5726 138 0.88 112.1 6.4 0.983 0.009 … N N
1783 24.0 12.8 2.2 25.4 10.0 4364 89 1.16 … … 0.997 0.011 5.94 N Y
1784 48.7 5.5 26.8 167.1 4.2 5413 67 1.75 341.9 13.0 1.009 0.005 … Y N
1805 25.0 -8.3 7.9 93.0 0.5 4585 94 1.53 421.5 13.0 1.012 0.011 6.37 N N
1816 21.5 -0.7 4.9 73.7 4.7 3882 30 1.35 427.5 12.0 0.991 0.012 5.65 Y N
1822 25.1 -11.2 1.4 27.0 0.5 4301 66 1.73 562.5 8.9 0.976 0.01 5.91 N N
1828 34.0 -12.1 3.5 83.0 4.6 4446 61 1.67 459.4 12.0 1.014 0.008 5.85 Y N
1832 24.8 0.9 3.6 49.3 3.7 4398 75 1.41 284.0 10.0 0.993 0.011 … N N
1834 25.9 -4.7 0.7 18.0 0.5 4453 90 1.76 492.5 8.4 0.99 0.01 … Y N
1848 30.3 -16.1 46.9 72.1 10.0 … … … … … 0.996 0.009 … Y N
1859 46.1 5.2 1.8 19.6 10.0 4871 62 1.41 … … 1.001 0.006 6.26 N Y
1874 74.1 -9.3 15.1 128.9 6.0 5830 52 1.39 193.5 6.4 1.002 0.004 … N N
1885 98.6 1.1 11.0 40.0 15.7 6033 44 0.89 71.9 4.3 1.01 0.003 … N N
1904 57.6 -12.3 5.0 67.0 2.5 5463 63 1.16 208.7 5.0 1.007 0.005 … N N
1916 18.3 -27.8 12.7 96.0 0.5 3968 105 0.71 493.9 20.0 1.006 0.014 … N N
1933 24.1 5.2 1.0 13.7 1.7 4582 113 2.09 507.8 8.0 1.008 0.011 6.40 Y N
1935 17.4 12.9 33.3 1.2 10.0 4885 154 1.71 … … 1.007 0.015 6.92 N N
1938 19.3 0.3 1.1 15.7 2.1 4783 148 1.20 393.4 7.5 1.014 0.014 6.69 N N
1954 23.4 -8.5 2.3 35.1 1.5 4611 112 1.71 482.6 9.3 1.009 0.011 6.45 N N
1962 21.0 -3.3 2.8 27.0 0.5 4796 125 1.80 365.8 11.0 0.981 0.013 6.45 Y N
1992 26.9 -10.3 1.4 25.0 1.6 4800 104 1.60 387.4 7.8 0.996 0.01 6.35 Y N
1999 18.1 -6.8 3.9 75.5 4.0 4284 114 1.92 251.8 12.0 1.015 0.015 6.03 Y N
2002 55.9 -24.0 22.8 1.2 10.0 8268 116 1.08 … … 0.999 0.005 … N N
2007 79.6 -7.0 24.7 175.6 17.6 6457 53 1.62 … … 1.005 0.003 … Y N
2016 24.4 -4.5 0.9 18.0 0.5 4271 66 1.19 481.9 7.5 0.968 0.011 6.27 N N
2036 25.4 -3.3 5.4 47.3 3.1 4472 81 1.10 301.9 11.0 0.992 0.01 … Y N
2037 30.8 -12.8 1.7 15.0 0.5 3917 25 0.36 … … 0.935 0.008 5.90 Y N
2057 26.5 -13.3 1.4 21.0 0.5 4985 109 1.71 380.1 8.4 0.984 0.01 6.95 Y N
2062 19.6 -10.7 1.5 24.0 0.5 5087 149 2.15 476.9 12.0 0.995 0.014 6.96 N N
2105 18.3 2.4 2.9 33.0 0.5 4633 112 1.44 341.3 11.0 1.018 0.014 6.46 N N
2124 36.3 -8.7 3.3 57.7 1.6 5033 84 1.34 297.4 8.0 0.996 0.007 6.65 Y N
2123 38.6 -10.1 1.2 24.0 0.5 4275 42 1.42 516.0 6.5 0.971 0.007 5.86 N N
2142 21.8 -6.2 1.6 16.0 1.6 4799 135 1.67 463.6 8.3 0.995 0.012 6.81 Y N
2145 23.1 -53.1 31.0 149.0 14.9 5158 141 2.55 435.5 19.0 0.997 0.011 … Y N
2148 17.2 -7.6 1.9 23.5 10.0 4732 155 1.59 513.7 13.0 0.981 0.015 6.86 N N
2157 20.3 -1.2 0.9 15.3 1.9 4623 115 1.76 402.4 9.2 0.966 0.013 6.63 N N
2184 19.6 -10.0 1.2 14.3 1.6 4225 80 1.43 567.2 9.5 0.981 0.014 6.15 N N
2195 17.2 -13.5 2.3 13.5 2.8 4790 162 2.01 495.4 12.0 0.992 0.015 6.66 N N
2207 20.4 -1.0 2.9 27.0 0.5 5147 167 2.02 474.0 10.0 1.003 0.013 … Y N
2208 30.9 -6.7 5.1 80.4 1.4 4892 92 1.74 287.6 9.2 0.994 0.009 6.46 N N
2210 24.7 -10.6 19.5 90.7 8.6 4978 103 1.94 223.4 16.0 1 0.011 6.93 N N
2230 28.6 11.9 1.5 18.0 0.5 5122 114 1.52 312.6 8.4 1.014 0.009 6.96 N N
2288 22.2 -9.0 1.4 16.7 1.7 4672 109 1.60 383.8 8.4 0.996 0.012 6.26 Y N
2290 20.1 -3.4 2.4 18.5 10.0 4451 94 0.51 … … 0.986 0.013 7.15 Y N
2300 29.2 -4.4 4.0 36.0 0.5 5218 120 1.77 290.0 8.3 0.995 0.009 6.63 N N
2299 57.4 -20.2 11.0 108.0 0.5 5417 59 1.52 320.3 7.0 1.015 0.005 … N N
2305 54.6 -5.3 6.3 84.0 3.0 5248 59 1.32 181.8 6.2 1.002 0.005 6.67 N N
2331 29.4 -6.7 0.9 16.5 1.7 4572 81 1.91 420.4 7.1 1 0.009 6.45 Y N
2335 38.1 -2.5 3.3 66.8 3.8 4651 66 1.52 439.6 9.4 0.999 0.007 6.30 Y N
2337 26.0 -5.8 4.2 42.0 0.5 4565 95 1.23 470.6 11.0 1.001 0.01 6.56 Y N
2348 16.6 -4.8 20.9 70.1 10.0 4785 153 1.42 467.2 19.0 0.985 0.016 6.71 Y N
2359 25.4 -7.9 1.1 18.0 0.5 4741 110 1.71 492.3 10.0 0.984 0.01 6.46 N N
2363 20.1 -8.3 1.3 24.0 0.5 5152 154 1.98 413.4 12.0 1.019 0.013 … N N
2371 27.8 -9.2 5.1 51.0 3.0 4909 110 1.60 397.9 9.6 1.006 0.009 6.54 Y N
2381 26.0 -2.0 4.1 59.1 2.3 4277 79 1.25 455.7 10.0 1.005 0.01 6.10 Y N
2399 20.8 -9.0 2.5 24.0 0.5 4684 133 1.41 459.6 9.4 1.003 0.013 6.76 N N
2405 27.2 -14.4 2.6 47.6 3.7 4838 106 1.45 361.4 11.0 1.001 0.01 … N N
2421 70.0 6.3 25.0 183.4 9.0 5794 51 1.78 … … 1.015 0.004 … Y N
2433 64.6 -30.9 26.6 148.2 7.5 5325 48 1.37 281.5 9.6 1.013 0.004 6.65 Y N
2439 46.6 -7.9 1.0 21.0 0.5 5286 74 1.62 347.9 5.2 1.014 0.006 … Y N
2460 56.8 -5.1 14.9 122.1 4.8 5769 68 1.41 261.8 7.4 1.006 0.005 … Y N
2477 36.3 -17.7 3.9 64.7 2.4 4777 74 1.59 431.9 8.3 1.006 0.007 6.41 N N
2479 40.7 -14.7 1.3 27.0 0.5 5213 81 1.72 314.0 5.7 0.998 0.006 6.66 N N
2482 25.7 -8.3 8.1 84.4 3.0 4515 83 1.84 503.0 15.0 1.019 0.01 6.25 N N
2495 75.2 -8.4 6.9 79.0 1.8 6069 55 1.51 158.4 5.5 1.014 0.003 … N N
2504 32.7 13.6 20.0 48.3 10.0 7554 164 2.62 … … 0.997 0.008 … Y N
2506 133.9 -5.0 21.7 1.5 10.0 7900 45 1.59 … … 1 0.002 … N N
2513 21.8 24.6 15.6 57.0 4.3 4755 125 1.49 345.7 19.0 1.01 0.012 6.48 N N
2517 25.5 -8.7 2.4 24.0 0.5 4455 88 1.29 411.0 11.0 0.997 0.01 … N N
2519 22.9 -11.9 1.7 18.0 0.5 4897 123 1.92 413.6 7.9 1 0.012 6.78 N N
2531 28.8 9.2 7.1 54.9 3.8 4432 70 1.07 442.6 15.0 1.018 0.009 6.41 Y N
2540 54.2 -8.2 2.5 42.0 0.5 5294 63 1.47 316.2 5.3 1.012 0.005 … N N
2551 46.8 -6.5 1.5 27.0 0.5 4986 63 1.18 390.8 5.9 0.999 0.006 6.58 N N
2553 129.9 19.8 9.3 81.8 10.0 8100 48 1.41 … … 0.998 0.002 … Y N
2554 86.3 -16.4 7.9 35.1 10.0 7990 72 0.88 37.5 3.7 1.006 0.003 … N N
2555 25.8 -2.6 1.1 15.0 0.5 4953 109 1.73 366.0 8.8 0.995 0.01 6.91 Y N
2565 29.7 -6.6 14.7 45.0 0.5 4795 87 2.12 399.9 14.0 1.018 0.009 6.43 Y N
2569 25.6 -7.5 2.0 40.9 1.6 4729 98 1.67 459.6 12.0 1.013 0.01 6.54 N N
2568 31.5 -3.0 10.0 74.0 10.0 6374 154 3.48 … … 1.01 0.008 … Y Y
2570 29.8 19.8 5.1 67.8 10.0 5287 103 2.86 … … 0.997 0.009 … Y N
2584 36.6 -4.2 3.6 33.8 1.5 5205 85 2.36 301.8 7.3 1.004 0.007 6.69 Y N
2585 47.1 -3.0 1.5 21.0 0.5 5060 64 1.77 372.9 5.0 1.003 0.006 6.29 Y N
2597 16.1 0.9 2.4 15.0 0.5 3900 45 0.75 236.3 9.8 0.877 0.016 5.91 N N
2598 87.7 -22.3 19.7 174.8 4.8 5743 41 2.43 230.1 6.7 1.005 0.003 … Y N
2602 26.2 -3.0 6.2 46.0 4.3 4444 84 1.10 484.5 10.0 0.999 0.01 … Y N
2606 20.1 -8.8 2.5 15.0 0.5 4841 143 2.10 365.4 8.2 1.001 0.013 6.73 N N
2609 30.4 13.5 2.1 9.5 2.3 4848 88 3.38 … … 1.025 0.009 6.04 Y N
2618 31.5 -9.1 9.2 72.0 0.5 4820 91 1.70 457.4 10.0 1.002 0.008 6.37 Y Y
2624 29.9 -7.0 1.7 27.0 0.5 4899 96 1.16 452.3 8.1 0.991 0.009 6.68 N N
2636 31.9 -7.1 15.9 83.6 3.0 4960 89 1.58 355.7 11.0 0.988 0.008 6.59 N N
2635 22.8 -55.1 3.8 18.1 10.0 … … … … … 1.04 0.011 … Y Y
2643 21.0 -3.0 3.3 35.3 1.5 5188 156 2.21 442.9 10.0 1.008 0.012 … Y N
2669 21.2 -9.2 14.6 61.7 3.4 4568 97 1.25 525.6 16.0 1.012 0.012 6.87 Y N
2674 53.7 -7.4 0.9 15.7 1.5 5082 59 1.65 409.2 4.3 1.001 0.005 6.42 Y N
2675 47.7 -3.7 8.7 83.1 4.8 4804 56 1.76 341.5 9.2 1.005 0.006 6.27 Y N
2677 68.8 -1.0 3.3 68.0 1.6 5032 45 1.84 256.2 5.8 0.99 0.004 6.26 Y N
2680 19.6 -7.4 2.6 21.0 0.5 4472 115 1.23 444.0 9.0 0.997 0.014 … Y N
2692 18.8 5.5 5.4 18.0 0.5 6287 165 2.55 420.1 13.0 1.004 0.014 … Y N
2708 58.1 -3.6 2.7 33.0 0.5 6166 74 1.20 160.5 4.4 1.007 0.005 … N N
2726 52.9 -9.4 13.1 103.8 1.7 5086 58 1.15 294.5 8.1 1.012 0.005 6.44 Y N
2755 60.3 -9.2 1.1 18.3 1.2 6184 72 0.12 105.9 3.7 0.996 0.004 … N N
2760 17.4 -6.5 1.6 16.7 1.7 4650 134 1.74 517.5 11.0 0.967 0.015 6.63 Y N
2761 64.2 -6.5 1.4 21.0 0.5 5423 51 2.10 294.9 4.1 1.004 0.004 … Y N
2763 37.2 -7.0 6.1 69.5 2.3 4814 71 1.26 277.0 10.0 1.006 0.007 6.39 Y N
2769 19.5 6.2 4.8 96.0 0.5 4494 135 1.58 409.2 17.0 1.007 0.013 6.49 N N
2774 66.9 -14.6 12.3 87.0 7.4 5805 59 2.11 176.3 6.4 1.009 0.004 … Y N
2779 45.8 -8.5 1.2 25.0 1.6 5617 83 1.67 369.3 5.6 1.017 0.006 6.97 N N
2782 24.8 -15.5 3.6 22.3 1.7 4587 92 1.69 397.4 9.1 0.997 0.011 6.59 N N
2812 37.8 -24.1 39.2 188.6 6.6 5426 91 2.18 490.0 15.0 1.015 0.007 6.70 N N
2818 29.9 1.3 23.1 48.7 6.2 5125 101 2.07 278.2 12.0 1.016 0.009 6.86 Y N
2833 36.8 -8.3 2.5 81.0 0.5 4810 70 1.51 375.2 9.5 1.004 0.007 6.36 N N
2846 77.6 -13.9 10.0 76.8 1.7 5763 47 2.02 184.4 4.9 1.002 0.003 … Y N
2866 30.8 -2.5 2.6 45.0 0.5 4814 93 1.47 446.3 10.0 1.002 0.009 6.55 Y N
2872 115.5 3.5 13.4 97.3 10.0 7892 53 1.01 71.3 3.1 1.002 0.002 … N N
2887 38.0 12.4 5.6 82.0 11.4 3543 1476 0.29 … … 0.913 0.007 … Y N
2890 48.9 -23.8 2.1 23.5 3.0 6215 89 1.39 192.8 5.3 1.015 0.005 … N N
2898 31.8 -9.4 4.1 71.6 2.7 4648 82 1.73 547.8 13.0 0.995 0.008 6.30 Y N
2902 21.3 -5.2 3.7 40.8 1.7 4845 136 1.52 393.3 11.0 0.99 0.012 6.75 N N
2908 50.5 -12.2 4.0 60.0 2.2 5291 68 1.20 213.8 5.3 0.998 0.005 6.65 N N
2909 81.0 -2.1 13.8 127.8 13.4 5392 38 2.77 203.4 6.4 1.014 0.003 … Y N
2923 38.8 1.4 9.6 109.4 9.0 4585 55 1.42 286.0 9.7 1.015 0.007 5.94 Y N
2926 68.1 11.9 29.3 124.3 21.5 5283 46 2.86 … … 1.011 0.004 … Y N
2946 15.4 5.1 10.9 37.7 4.2 5063 185 1.59 408.6 17.0 1.004 0.017 6.97 N N
2947 24.8 -7.5 4.7 49.0 1.6 5769 148 2.91 279.7 8.5 0.993 0.011 … N N
2949 22.2 -4.6 1.4 18.0 0.5 4648 116 2.41 482.3 8.4 0.996 0.012 6.15 Y N
2948 15.4 -2.0 2.5 21.5 10.0 5348 212 1.56 157.9 14.0 1.025 0.017 … N N
2950 54.5 -1.0 9.3 109.0 6.2 5659 66 1.11 142.3 7.1 1.005 0.005 … N N
2966 24.5 -10.5 3.1 30.0 0.5 5653 156 2.06 401.8 9.2 0.994 0.011 … N N
2967 26.8 -3.0 1.5 24.7 1.5 5029 110 2.07 417.3 8.1 0.998 0.01 6.52 N N
2970 47.3 -39.9 8.1 40.7 4.6 5672 71 2.72 266.9 6.9 1.001 0.006 … Y N
2972 50.0 -3.0 30.3 166.5 7.5 5788 74 1.47 231.6 9.9 1.013 0.005 … Y N
2985 19.4 -5.2 2.0 27.0 0.5 4309 81 1.58 529.2 12.0 0.994 0.014 6.27 Y N
2987 20.9 -18.9 11.9 77.6 3.2 4548 104 1.48 357.6 16.0 0.988 0.013 6.37 N N
3019 16.1 -10.0 4.5 32.0 1.6 4619 129 2.30 569.0 13.0 0.982 0.016 6.23 Y N
3021 84.1 -11.6 10.9 108.2 8.3 5870 46 1.65 145.8 6.0 1.01 0.003 … N N
3032 70.4 -7.2 3.6 71.7 4.7 5981 57 2.59 181.3 5.5 1.006 0.004 … N N
3041 25.1 -10.3 13.7 78.9 3.8 4727 99 1.68 508.2 14.0 1.01 0.01 6.31 Y N
3044 23.6 -17.7 2.3 30.0 3.0 5101 142 0.81 200.1 9.7 1.004 0.011 6.84 N N
3051 25.1 0.2 8.9 52.3 2.4 4311 68 1.10 374.5 13.0 0.986 0.011 6.36 Y N
3065 46.2 -10.8 1.2 19.2 1.7 5585 78 1.02 172.2 5.2 0.99 0.006 … N N
3067 52.7 -5.8 3.6 60.0 30.0 7288 102 2.84 72.6 4.1 1.002 0.005 … N N
3073 76.4 -5.6 1.8 37.5 1.7 5676 50 1.34 222.5 4.1 1.011 0.003 … N N
3089 77.4 -15.0 20.0 … … … … … … … 1 0.003 … Y N
3094 18.3 -3.5 6.9 50.6 2.0 4284 92 1.31 525.3 12.0 0.979 0.015 6.11 N N
3102 20.5 2.0 8.7 43.8 3.5 4788 125 0.58 … … 0.982 0.013 6.91 N N
3104 34.3 0.7 5.5 65.0 2.2 4768 84 1.31 393.4 8.3 0.997 0.008 6.27 N N
3112 18.2 -6.2 4.5 29.4 3.3 5962 217 3.36 282.6 12.0 1.023 0.015 … N N
3116 18.0 -6.2 1.4 15.0 0.5 4474 138 0.86 438.5 11.0 0.987 0.015 6.81 N N
3120 33.9 -21.2 1.6 22.7 2.4 4505 66 1.80 486.5 6.7 1.009 0.008 5.86 Y N
3134 72.7 -14.1 2.3 27.0 1.7 6110 58 1.47 166.4 3.9 1.005 0.004 … N N
3136 28.4 -7.8 3.4 47.6 3.0 5141 111 1.95 331.1 9.2 0.994 0.009 … N N
3158 60.5 -2.8 0.9 12.0 0.5 4430 29 0.27 … … 0.927 0.004 … Y N
3161 25.0 -6.6 10.8 86.3 1.6 … … … 373.2 15.0 1.001 0.011 … N N
3198 44.0 -11.7 1.6 31.8 1.7 4754 60 1.78 451.2 6.9 1.017 0.006 6.10 Y N
3196 40.1 -4.7 17.6 130.1 10.3 5547 95 2.36 222.6 10.0 1.016 0.006 … N N
3200 48.8 -5.1 26.0 164.0 1.6 5375 63 1.94 275.6 10.0 1.007 0.005 … Y N
3217 18.0 -7.8 2.2 14.3 1.4 4981 152 2.43 454.5 9.4 0.984 0.015 6.77 N N
3219 36.7 -8.7 1.9 16.3 1.7 5015 77 1.37 357.4 6.1 1.003 0.007 6.58 N N
3244 27.0 -9.6 0.9 18.0 0.5 4613 87 2.09 495.3 8.8 0.986 0.01 6.29 Y N
3271 43.0 5.3 5.6 34.2 2.7 4961 72 1.73 358.5 7.3 1.006 0.006 6.52 Y N
3287 51.5 0.7 0.8 18.0 0.5 5004 58 0.09 190.3 4.2 0.987 0.005 6.69 N N
3294 37.7 -62.0 1.1 75.9 10.0 5032 78 1.76 311.9 10.0 0.991 0.007 6.62 N N
3319 56.0 -11.3 11.5 81.0 3.5 5044 51 1.63 393.1 6.4 1.006 0.005 6.24 Y N
3326 17.3 -4.1 6.3 48.8 2.7 4396 107 1.72 450.8 15.0 0.997 0.015 … N N
3338 24.4 -7.1 3.8 30.0 0.5 4706 105 2.21 470.7 9.4 1.01 0.011 6.31 Y N
3358 65.0 -7.2 6.4 82.3 1.7 5392 53 1.42 301.1 6.7 0.997 0.004 … N N
3359 16.3 -15.2 35.8 108.0 0.5 5009 168 2.34 496.8 24.0 1.017 0.016 6.80 Y N
3367 67.2 -7.7 7.6 67.5 1.7 5316 51 1.94 220.0 5.8 1.007 0.004 … N N
3374 59.5 -22.2 2.0 22.1 1.6 5227 56 1.52 285.4 4.4 1.003 0.004 6.63 N N
3395 81.0 -5.4 13.0 119.5 5.6 5773 45 1.47 206.4 6.3 1.009 0.003 … N N
3399 48.2 53.0 1.1 15.0 0.5 4263 33 0.80 … … 0.978 0.005 5.75 Y Y
3409 15.9 6.7 2.1 7.0 … 4811 181 1.43 298.0 11.0 0.986 0.017 6.88 N N
3412 41.0 -7.7 3.6 73.3 2.4 5016 74 2.04 316.2 10.0 1.005 0.006 6.55 N N
3415 65.9 -0.2 12.6 141.0 0.5 5508 48 1.82 247.1 8.7 1.011 0.004 6.22 Y N
3425 26.7 -2.3 27.9 83.0 3.5 4940 102 1.03 397.6 11.0 0.995 0.01 6.81 Y N
3427 54.9 -9.4 1.5 18.6 2.1 5846 73 2.49 220.3 4.1 1.007 0.005 … Y N
3435 35.5 -5.5 1.9 24.0 0.5 5085 85 1.81 419.7 7.0 0.991 0.007 6.82 Y N
3438 39.8 -9.8 2.2 18.8 1.5 5204 83 1.73 353.9 6.2 1.002 0.007 6.91 Y N
3443 21.6 -11.4 11.5 38.0 3.7 4729 128 1.83 239.7 13.0 0.987 0.012 6.62 N N
3442 68.7 -21.0 2.2 17.2 2.9 6431 58 0.82 100.0 3.3 1 0.004 … Y N
3454 64.4 -8.0 23.8 158.0 1.8 5840 60 1.63 180.0 7.3 1.022 0.004 … N N
3480 22.7 0.0 4.4 77.4 4.5 3985 38 0.36 418.8 14.0 0.979 0.011 6.30 N N
3485 18.9 -8.0 2.3 14.0 1.6 5342 187 2.53 469.2 11.0 0.995 0.014 6.96 N N
3488 23.6 11.3 2.1 22.9 10.0 4911 116 1.66 … … 1.004 0.011 6.75 N N
3505 70.1 -7.5 3.0 42.0 2.5 5531 49 1.31 265.9 3.9 1.002 0.004 … Y N
3508 48.6 5.5 17.8 91.2 8.7 5164 61 1.89 321.0 10.0 1.005 0.005 6.40 N N
3524 21.1 -9.7 5.6 27.0 0.5 4443 91 1.61 397.3 11.0 0.984 0.012 … N N
3531 39.2 -8.3 2.6 27.0 0.5 5538 96 1.30 299.2 5.6 1.008 0.007 … N N
3541 15.3 -4.2 6.3 76.5 4.8 5036 176 1.78 355.5 16.0 0.978 0.017 … N N
3536 37.5 -2.8 8.9 72.9 1.5 4915 79 1.55 327.4 8.6 1.001 0.007 6.27 Y N
3549 21.0 -11.3 3.6 18.0 0.5 4297 73 1.06 529.1 9.4 0.978 0.013 6.43 N N
3554 22.2 -10.0 1.5 15.0 0.5 4461 90 1.59 518.7 8.4 0.982 0.012 … N N
3557 21.0 -8.7 3.4 27.0 0.5 4907 123 2.08 467.6 11.0 0.995 0.013 6.57 N N
3558 39.3 -8.8 13.7 88.5 1.7 4880 66 1.09 327.6 9.4 1.002 0.007 6.48 N N
3578 32.2 -7.0 1.6 24.0 0.5 5524 112 2.01 427.4 6.9 0.997 0.008 … N N
3577 18.2 -7.1 1.3 14.4 1.4 5115 175 2.59 382.7 10.0 1.009 0.014 6.58 Y N
3617 31.2 -22.3 3.3 32.6 2.8 6163 137 2.20 207.7 7.0 1 0.008 … N N
3628 27.3 -6.8 1.4 24.0 0.5 5165 117 2.53 495.2 8.1 0.976 0.01 6.67 Y N
3633 18.5 -89.7 0.9 99.0 0.5 4812 141 1.73 556.6 20.0 1.002 0.014 6.68 Y N
3636 26.0 -8.7 5.9 49.3 1.7 5515 141 2.69 358.3 8.9 0.999 0.01 … N N
3644 33.9 -12.2 1.5 12.0 0.5 4591 60 0.78 … … 0.897 0.008 6.74 Y N
3650 18.0 18.0 2.0 9.9 2.9 5144 173 2.25 274.1 9.4 1.027 0.015 6.79 N N
3660 30.3 -1.4 11.5 96.0 5.5 4655 76 2.15 377.2 16.0 1.031 0.009 6.21 Y N
3668 15.2 -3.3 1.6 17.0 1.6 4478 136 1.08 367.0 9.9 0.982 0.017 … N N
3683 101.4 12.0 0.3 7.4 1.7 4439 21 4.20 150.4 2.4 1.056 0.003 … N N
3692 36.4 -3.3 8.0 51.0 0.5 5649 92 1.82 355.8 7.7 0.988 0.007 6.96 N N
3716 16.8 0.6 8.3 45.0 0.5 4003 54 0.90 354.5 14.0 0.988 0.016 6.10 N N
3722 22.8 -7.8 2.4 15.0 0.5 5075 127 1.88 404.0 7.9 1.003 0.012 … Y N
3732 19.0 -14.3 5.8 72.0 0.5 4906 157 2.36 506.1 15.0 1.006 0.014 6.61 Y N
3749 24.9 -5.5 16.5 81.0 5.7 4598 91 1.83 357.7 17.0 0.984 0.01 6.38 N N
3808 23.5 -8.3 1.6 12.0 0.5 4644 99 1.44 455.7 9.7 0.986 0.011 6.79 N N
3830 71.6 -0.5 18.3 106.0 13.7 6051 59 1.24 120.4 6.4 1.011 0.004 … N N
3834 26.1 8.5 15.0 112.4 29.9 5291 117 3.20 … … 1.007 0.01 … Y N
3846 18.6 -11.6 2.6 21.0 0.5 5338 195 1.90 370.2 10.0 0.98 0.014 … N N
3847 21.7 -7.0 18.3 93.5 3.0 4716 104 2.03 472.4 15.0 0.992 0.012 6.38 Y N
3849 19.7 -8.5 20.6 78.8 5.5 4551 114 1.47 466.3 15.0 1.009 0.014 6.61 N N
3860 24.3 2.2 3.7 42.0 0.5 4914 125 0.87 276.8 12.0 0.996 0.011 6.75 Y N
3873 48.1 5.0 13.9 130.1 6.2 5488 73 2.66 343.9 11.0 1.003 0.005 … N N
3875 70.7 -11.5 33.3 179.6 3.7 5299 43 1.63 213.0 7.9 1.015 0.004 … Y N
3879 29.9 -6.8 3.4 43.7 1.7 5421 123 2.19 334.9 7.9 1.018 0.009 … N N
3909 56.4 2.3 5.6 61.7 12.7 7287 96 0.62 45.6 4.1 1.006 0.005 … N N
3916 18.3 -6.2 3.6 26.1 1.5 4860 173 2.26 335.1 11.0 0.971 0.014 6.56 N N
3954 35.5 -15.6 13.4 140.0 4.5 5485 98 1.99 288.1 11.0 1.027 0.007 … N N
3956 29.8 -8.2 1.1 21.0 0.5 4919 100 1.86 408.8 8.1 1 0.009 6.63 N N
3970 41.1 -7.2 3.9 57.0 0.5 5330 83 2.16 258.1 7.0 1.003 0.006 … N N
4049 15.4 -5.3 2.1 24.9 2.3 4361 117 1.95 513.4 12.0 0.986 0.017 5.98 N N
4187 30.6 -3.2 9.8 58.7 7.7 7190 172 3.65 … … 1.008 0.009 … N N
4218 57.2 -5.5 0.6 15.0 0.5 4514 37 0.15 110.8 3.7 0.948 0.005 6.03 N N
4244 114.3 -2.2 6.0 94.3 1.7 8318 54 2.12 60.8 2.3 1.005 0.002 … Y N
4274 19.0 14.5 1.2 15.1 10.0 4921 164 4.54 359.0 8.6 1.048 0.014 5.86 N N
4282 45.7 -41.8 43.3 76.4 10.0 7901 134 4.66 … … 1.014 0.006 … Y N
4338 23.3 -11.3 2.9 36.0 3.3 4343 82 2.68 554.9 8.4 1.004 0.011 5.63 Y N
4366 28.6 -20.6 16.5 4.7 10.0 7298 191 0.51 … … 1.015 0.009 … N N
4392 69.9 -2.6 5.0 48.2 15.7 6834 78 0.21 … … 1.001 0.004 … N N
4415 20.0 -0.8 11.7 89.3 10.0 5867 198 1.93 191.2 14.0 1.011 0.013 … N N
| HSB2012 | CXOGNC | ADM2008 | YSO | RA | Dec | |||
|---|---|---|---|---|---|---|---|---|
| (J2000) | (J2000) | |||||||
| 394 | 104314.98-593341.3 | … | … | 10:43:14.99 | -59:33:41.3 | 14.67 | 0.94 | 1.09 |
| 1262 | 104348.74-593430.4 | … | … | 10:43:48.59 | -59:34:31.2 | 17.72 | 1.76 | 2.03 |
| 1788 | 104405.37-593043.5 | … | … | 10:44:05.42 | -59:30:43.5 | 14.53 | 0.90 | 1.03 |
| 2169 | … | … | … | 10:44:18.67 | -59:48:05.4 | 16.09 | 0.96 | 1.02 |
| 2270 | … | … | … | 10:44:22.78 | -59:38:52.5 | 18.44 | … | 1.75 |
| 2296 | 104423.64-593941.8 | 146 | … | 10:44:23.56 | -59:39:41.4 | 16.34 | 0.91 | 1.34 |
| 2561 | … | … | … | 10:44:32.97 | -59:38:05.9 | 17.38 | 0.94 | 1.22 |
| 2797 | … | … | … | 10:44:42.77 | -59:38:01.4 | 17.03 | 1.14 | 1.14 |
| 2959 | 104450.11-593429.3 | … | … | 10:44:49.99 | -59:34:29.5 | 16.75 | 1.32 | 1.72 |
| 3030 | 104452.43-594130.1 | 469 | … | 10:44:52.40 | -59:41:30.1 | 16.66 | 0.94 | 1.15 |
| 3167 | 104457.05-593826.5 | 534 | … | 10:44:57.06 | -59:38:26.9 | 13.70 | 1.01 | 1.19 |
| 3229 | … | … | … | 10:44:58.90 | -59:40:08.4 | 15.66 | 1.18 | 1.27 |
| 3290 | 104501.02-594515.5 | 600 | … | 10:45:01.03 | -59:45:15.6 | 14.54 | 0.91 | 1.06 |
| 3688 | … | … | … | 10:45:15.44 | -59:35:21.4 | 17.29 | 1.48 | 1.81 |
| 3844 | 104521.23-593258.2 | … | … | 10:45:21.20 | -59:32:58.4 | 18.06 | 1.26 | 1.63 |
| 3926 | 104524.13-593131.1 | … | … | 10:45:24.14 | -59:31:31.6 | 14.20 | 0.63 | 0.71 |
| 4310 | 104541.60-593820.2 | 1014 | … | 10:45:41.60 | -59:38:20.2 | 14.46 | 0.87 | 1.00 |
| HSB2012 | SNR | RV | Teff | Li EW | log age | H | SB2 | ||||||||
|---|---|---|---|---|---|---|---|---|---|---|---|---|---|---|---|
| (km/s) | (km/s) | (K) | (mÅ) | (yr) | |||||||||||
| 394 | 31.1 | 10.3 | 1.1 | 24.0 | 0.5 | 5189 | 105 | 0.39 | 231.6 | 7.2 | 0.984 | 0.009 | … | N | N |
| 1262 | 30.6 | 13.2 | 1.6 | 10.9 | 2.5 | 3830 | 17 | 0.42 | … | … | 0.862 | 0.008 | … | Y | N |
| 1788 | 84.4 | 23.2 | 0.4 | 12.0 | 0.5 | 5082 | 38 | 0.20 | 172.8 | 3.1 | 0.984 | 0.003 | … | N | N |
| 2169 | 40.1 | 14.2 | 0.6 | 13.9 | 1.6 | 5095 | 76 | 0.19 | 193.7 | 5.2 | 0.985 | 0.007 | … | N | N |
| 2270 | 17.4 | 4.8 | 2.5 | 17.9 | 10.0 | 3816 | 25 | 0.00 | … | … | 0.847 | 0.015 | … | Y | N |
| 2296 | 59.0 | 15.4 | 2.2 | 18.7 | 1.5 | 5548 | 66 | 1.10 | 191.1 | 5.3 | 1.012 | 0.004 | … | N | N |
| 2561 | 31.7 | 14.6 | 0.9 | 12.0 | 0.5 | 4731 | 73 | 0.21 | … | … | 0.974 | 0.008 | … | Y | N |
| 2797 | 42.1 | 14.9 | 1.1 | 12.3 | 2.4 | 5115 | 69 | 0.45 | … | … | 0.988 | 0.006 | … | Y | N |
| 2959 | 41.4 | 92.5 | 2.7 | 27.0 | 0.5 | 4295 | 40 | 0.64 | … | … | 0.984 | 0.006 | … | Y | N |
| 3030 | 42.5 | 10.8 | 1.3 | 24.0 | 2.7 | 5465 | 84 | 0.67 | 59.6 | 5.4 | 1.001 | 0.006 | … | N | N |
| 3167 | 112.9 | 10.7 | 0.7 | 15.0 | 0.5 | 4842 | 26 | 0.29 | 25.3 | 1.6 | 0.992 | 0.002 | … | N | N |
| 3229 | 68.3 | 4.1 | 0.7 | 12.0 | 0.5 | 5519 | 50 | 0.94 | 26.6 | 2.7 | 0.994 | 0.004 | … | Y | N |
| 3290 | 65.5 | 8.7 | 2.0 | 45.0 | 0.5 | 4959 | 44 | 0.16 | 202.8 | 4.4 | 0.98 | 0.004 | … | N | N |
| 3688 | 30.9 | 11.3 | 1.2 | 10.4 | 1.7 | 4124 | 41 | 0.51 | … | … | 0.85 | 0.008 | … | Y | N |
| 3844 | 16.7 | 6.7 | 1.4 | 12.0 | 0.5 | 3971 | 54 | 0.00 | 142.0 | 9.3 | 0.92 | 0.016 | … | Y | N |
| 3926 | 28.6 | 8.4 | 1.0 | 9.6 | 2.6 | 5981 | 137 | 0.00 | 65.5 | 6.1 | 0.978 | 0.009 | … | N | N |
| 4310 | 59.3 | 10.0 | 1.0 | 21.0 | 0.5 | 5221 | 56 | 0.22 | 249.0 | 4.0 | 0.986 | 0.004 | … | N | N |
| HSB2012 | CXOGNC | ADM2008 | YSO | RA | Dec | |||
|---|---|---|---|---|---|---|---|---|
| (J2000) | (J2000) | |||||||
| 3579 | … | … | … | 10:45:11.09 | -59:40:07.8 | 15.85 | 1.96 | 5.05 |
| 2595 | … | … | … | 10:44:34.42 | -59:42:57.8 | 15.87 | 2.49 | 3.20 |
| 3504 | … | … | … | 10:45:08.53 | -59:43:30.2 | 18.10 | … | 3.25 |
| HSB2012 | SNR | RV | Teff | Li EW | log age | H | SB2 | ||||||||
|---|---|---|---|---|---|---|---|---|---|---|---|---|---|---|---|
| (km/s) | (km/s) | (K) | (mÅ) | (yr) | |||||||||||
| 3579 | 133.3 | 22.1 | 2.3 | 24.7 | 4.6 | 2819 | 24 | … | 487.5 | 2.1 | 1.019 | 0.002 | … | N | N |
| 2595 | 96.9 | 17.7 | 1.4 | 18.9 | 1.6 | 3598 | 150 | 2.20 | 231.3 | 2.1 | 1.061 | 0.003 | … | N | N |
| 3504 | 32.0 | 43.1 | 0.7 | 7.5 | 1.7 | 4424 | 69 | 4.24 | 167.5 | 5.9 | 1.051 | 0.008 | … | N | N |
landscape
| 2MASS Id | SIMBAD Id | RA | Dec | SpT | Notes | |||
|---|---|---|---|---|---|---|---|---|
| 10430716-5931209 | [HSB2012] 230 | 10:43:07.16 | -59:31:20.9 | 15.06 | 1.08 | 1.76 | … | B type |
| 10432086-5929595 | [HSB2012] 538 | 10:43:20.86 | -59:29:59.6 | 14.43 | 0.39 | 0.72 | … | B type |
| 10433865-5934444 | Cl Trumpler 14 43 | 10:43:38.66 | -59:34:44.5 | 12.17 | 0.42 | 0.71 | … | B type |
| 10434798-5933590 | Cl Trumpler 14 45 | 10:43:47.98 | -59:33:59.1 | 13.2 | 0.44 | 0.73 | … | B type |
| 10435224-5936585 | [HSB2012] 1385 | 10:43:52.24 | -59:36:58.5 | 12.24 | 0.4 | 0.7 | … | B type |
| 10435250-5942503 | [HSB2012] 1395 | 10:43:52.50 | -59:42:50.4 | 16.47 | 1.1 | 1.8 | … | B type |
| 10435723-5932411 | Cl* Trumpler 14 VBF 65 | 10:43:57.24 | -59:32:41.2 | 12.85 | 0.31 | 0.55 | … | B type |
| … | [HSB2012] 1618 | 10:43:59.20 | -59:33:21.5 | 13.44 | 0.39 | 0.67 | … | B type |
| 10440320-5937380 | Cl* Trumpler 14 Y 461 | 10:44:03.20 | -59:37:38.1 | 12.67 | 0.3 | 0.54 | … | B type |
| 10440384-5933099 | Cl Trumpler 14 38 | 10:44:03.84 | -59:33:10.0 | 13.23 | 0.34 | 0.55 | … | B type |
| 10440590-5944277 | Cl* Trumpler 14 Y 339 | 10:44:05.91 | -59:44:27.7 | 15.34 | 0.78 | 1.36 | … | B type |
| 10440976-5944480 | [HSB2012] 1913 | 10:44:09.76 | -59:44:48.0 | 15.2 | 0.74 | 1.35 | … | B type |
| 10441215-5933511 | Cl Trumpler 16 130 | 10:44:12.15 | -59:33:51.2 | 12.92 | 0.35 | 0.55 | … | B type |
| 10441249-5943276 | Cl* Trumpler 14 MJ 251 | 10:44:12.50 | -59:43:27.6 | 14.4 | 0.57 | 1.13 | … | B type |
| 10441282-5933321 | Cl Trumpler 16 131 | 10:44:12.83 | -59:33:32.2 | 13.56 | 0.37 | 0.59 | … | B type |
| 10441380-5942571 | Cl Trumpler 16 245 | 10:44:13.80 | -59:42:57.1 | 12.33 | 0.5 | 1.2 | B0V | B type |
| 10441535-5936042 | Cl* Trumpler 14 Y 467 | 10:44:15.36 | -59:36:04.3 | 13.22 | 0.44 | 0.67 | … | B type |
| 10441968-5943078 | Cl Trumpler 16 247 | 10:44:19.69 | -59:43:07.9 | 13.54 | 0.29 | 0.52 | … | B type |
| 10442048-5930470 | Cl* Trumpler 14 Y 11 | 10:44:20.48 | -59:30:47.0 | 13.49 | 0.35 | 0.52 | … | B type |
| 10442451-5945441 | Cl* Trumpler 14 Y 300 | 10:44:24.52 | -59:45:44.1 | 15.18 | 0.67 | 1.13 | … | B type |
| 10442909-5948207 | Cl* Trumpler 14 MJ 328 | 10:44:29.10 | -59:48:20.7 | 12.66 | 0.88 | 1.45 | … | B type |
| 10442945-5933437 | Cl* Trumpler 14 Y 50 | 10:44:29.46 | -59:33:43.8 | 13.25 | 0.37 | 0.59 | … | B type |
| 10443132-5930376 | Cl* Trumpler 14 Y 30 | 10:44:31.33 | -59:30:37.7 | 12.3 | 0.33 | 0.55 | … | B type |
| 10443341-5933189 | 2MASS J10443341-5933189 | 10:44:33.42 | -59:33:19.0 | 16.27 | 0.46 | 1.38 | … | B type |
| 10444710-5939201 | Cl Trumpler 16 44 | 10:44:47.11 | -59:39:20.2 | 13.49 | 0.61 | 1.02 | B3: | B type |
| 10444848-5947493 | [HSB2012] 2913 | 10:44:48.49 | -59:47:49.4 | 16.2 | 1.5 | 2.23 | … | B type |
| 10445036-5934468 | Cl* Trumpler 14 Y 60 | 10:44:50.36 | -59:34:46.9 | 13.6 | 0.44 | 0.72 | … | B type |
| 10445160-5943136 | Cl Trumpler 16 47 | 10:44:51.60 | -59:43:13.6 | 12.85 | 0.38 | 0.64 | B3: | B type |
| 10445201-5939322 | [HSB2012] 3017 | 10:44:52.02 | -59:39:32.2 | 14.78 | 1.01 | 1.58 | … | B type |
| 10445602-5938530 | Cl Trumpler 16 215 | 10:44:56.02 | -59:38:53.0 | 13.33 | 0.6 | 1.14 | … | B type |
| … | [HSB2012] 3150 | 10:44:56.80 | -59:40:02.5 | 13.19 | 0.39 | 0.62 | … | B type |
| 10445837-5932062 | Cl* Trumpler 14 MJ 451 | 10:44:58.38 | -59:32:06.3 | 13.24 | 0.44 | 0.7 | … | B type |
| … | Cl Trumpler 16 38 | 10:45:00.20 | -59:40:05.2 | 13.28 | 0.34 | 0.55 | B5: | B type |
| 10450198-5934058 | Cl* Trumpler 14 Y 89 | 10:45:01.99 | -59:34:05.9 | 15.11 | 0.75 | 1.27 | … | B type |
| … | Cl Trumpler 16 69 | 10:45:07.90 | -59:41:34.1 | 12.96 | 0.41 | 0.69 | … | B type |
| 10450792-5939011 | Cl Trumpler 16 51 | 10:45:07.93 | -59:39:01.2 | 12.8 | 0.33 | 0.55 | B | B type |
| 10450836-5938475 | Cl Trumpler 16 52 | 10:45:08.37 | -59:38:47.5 | 12.62 | 0.38 | 0.68 | B3: | B type |
| … | [HSB2012] 3545 | 10:45:09.90 | -59:42:13.9 | 12.39 | 0.36 | 0.58 | … | B type |
| 10451271-5939066 | Cl Trumpler 16 54 | 10:45:12.72 | -59:39:06.6 | 12.83 | 0.39 | 0.6 | B3: | B type |
| 10451355-5943318 | Cl* Trumpler 14 Y 206 | 10:45:13.55 | -59:43:31.8 | 14.17 | 0.47 | 0.83 | B | B type |
| 10451588-5929563 | Cl* Trumpler 14 MJ 525 | 10:45:15.89 | -59:29:56.4 | 12.06 | 0.36 | 0.59 | … | B type |
| 10451622-5941411 | Cl Trumpler 16 238 | 10:45:16.22 | -59:41:41.2 | 13.55 | 0.47 | 0.84 | B | B type |
| 10451717-5947013 | [HSB2012] 3729 | 10:45:17.18 | -59:47:01.4 | 17.5 | 1.68 | 2.94 | … | B type |
| 10451730-5941204 | Cl Trumpler 16 239 | 10:45:17.30 | -59:41:20.4 | 13.6 | 0.41 | 0.66 | … | B type |
| 10451798-5941095 | Cl Trumpler 16 240 | 10:45:17.99 | -59:41:09.5 | 13.85 | 0.42 | 0.68 | … | B type |
| 10451809-5938223 | [HSB2012] 3755 | 10:45:18.09 | -59:38:22.4 | 16.27 | 0.9 | 1.45 | … | B type |
| 10451899-5941427 | Cl Trumpler 16 241 | 10:45:18.99 | -59:41:42.7 | 14.06 | 0.42 | 0.73 | … | B type |
| 10452216-5942436 | [HSB2012] 3880 | 10:45:22.17 | -59:42:43.7 | 17.13 | 1.83 | 2.68 | … | B type |
| 10452310-5944458 | Cl* Trumpler 14 Y 256 | 10:45:23.11 | -59:44:45.8 | 13.6 | 0.51 | 0.88 | … | B type |
| 10452415-5942313 | Cl* Trumpler 14 Y 193 | 10:45:24.16 | -59:42:31.4 | 13.38 | 0.4 | 0.68 | B | B type |
| 10453134-5941133 | Cl* Trumpler 16 MJ 585 | 10:45:31.34 | -59:41:13.3 | 12.67 | 0.37 | 0.64 | … | B type |
| 10453254-5942359 | Cl* Trumpler 14 Y 151 | 10:45:32.55 | -59:42:35.9 | 13.07 | 0.53 | 0.9 | … | B type |
| 10453607-5945295 | 2MASS J10453607-5945295 | 10:45:36.07 | -59:45:29.6 | 16.79 | 0.93 | 1.8 | … | B type |
| 10453660-5944110 | [S87b] IRS 41 | 10:45:36.61 | -59:44:11.1 | 13.62 | 1.07 | 2.02 | … | B type |
| 10453807-5944095 | Cl* Trumpler 16 MJ 599 | 10:45:38.08 | -59:44:09.5 | 13.05 | 0.77 | 1.51 | … | B type |
| 10453819-5942157 | Cl* Trumpler 14 Y 150 | 10:45:38.20 | -59:42:15.7 | 13.8 | 0.51 | 0.92 | … | B type |
| 10454060-5937041 | Cl* Trumpler 16 MJ 602 | 10:45:40.61 | -59:37:04.2 | 13.24 | 0.43 | 0.75 | … | B type |
| 10454118-5936392 | Cl* Trumpler 16 MJ 603 | 10:45:41.18 | -59:36:39.2 | 13.02 | 0.56 | 0.85 | … | B type |
| 10433663-5934509 | Cl Trumpler 14 53 | 10:43:36.64 | -59:34:51.0 | 13.58 | 0.56 | 0.98 | … | B SG |
| 10434355-5935450 | Cl Trumpler 14 61 | 10:43:43.56 | -59:35:45.1 | 13.53 | 0.55 | 1.03 | … | B SG |
| 10440384-5934344 | Cl* Trumpler 14 Y 519 | 10:44:03.84 | -59:34:34.4 | 13.07 | 0.33 | 0.54 | … | B SG |
| 10440992-5946185 | [HSB2012] 1920 | 10:44:09.93 | -59:46:18.6 | 15.81 | 1.91 | 3.04 | … | B SG |
| 10445393-5945240 | Cl* Trumpler 14 Y 226 | 10:44:53.94 | -59:45:24.0 | 13.59 | 0.36 | 0.62 | … | B SG |
| 10451925-5929522 | Cl* Trumpler 14 MJ 540 | 10:45:19.25 | -59:29:52.2 | 12.49 | 0.5 | 0.95 | … | B SG |
| 10452648-5946188 | [HSB2012] 3994 | 10:45:26.49 | -59:46:18.9 | 16.13 | 1.04 | 1.93 | … | B SG |
| 10452875-5930037 | [HSB2012] 4044 | 10:45:28.76 | -59:30:03.8 | 13.66 | 0.91 | 1.52 | … | B SG |
| 10454365-5939540 | Cl* Trumpler 14 Y 142 | 10:45:43.65 | -59:39:54.0 | 12.95 | 0.34 | 0.59 | … | B SG |
| 10453674-5947020 | [S87b] IRS 42 | 10:45:36.75 | -59:47:02.0 | 15.08 | 1.64 | 2.89 | … | O type |
| 10453024-5948206 | [S87b] IRS 38 | 10:45:30.25 | -59:48:20.6 | 17.64 | 2.27 | 4.09 | … | O type? |
| 10433352-5934383 | Cl* Trumpler 14 Y 501 | 10:43:33.53 | -59:34:38.3 | 14.5 | 0.48 | 0.78 | … | near A0 |
| 10433948-5931460 | Cl* Trumpler 14 VBF 149 | 10:43:39.49 | -59:31:46.0 | 14.61 | 0.52 | 0.86 | … | near A0 |
| 10434041-5932584 | Cl* Trumpler 14 Y 598 | 10:43:40.42 | -59:32:58.4 | 13.63 | 0.62 | 1.01 | … | near A0 |
| 10434176-5932588 | Cl* Trumpler 14 Y 599 | 10:43:41.76 | -59:32:58.8 | 14.4 | 0.56 | 1.01 | … | near A0 |
| 10434269-5934435 | Cl* Trumpler 14 MJ 96 | 10:43:42.70 | -59:34:43.6 | 14.32 | 0.54 | 0.89 | … | near A0 |
| 10434766-5942391 | [HSB2012] 1231 | 10:43:47.67 | -59:42:39.2 | 17.88 | 1.31 | 2.11 | … | near A0 |
| 10435515-5933344 | [HSB2012] 1476 | 10:43:55.16 | -59:33:34.4 | 14.08 | 0.44 | 0.79 | … | near A0 |
| 10435886-5943036 | Cl* Trumpler 14 Y 402 | 10:43:58.86 | -59:43:03.7 | 15.43 | 0.65 | 1.14 | … | near A0 |
| 10440976-5943383 | Cl* Trumpler 14 Y 400 | 10:44:09.76 | -59:43:38.4 | 14.85 | 0.53 | 0.97 | … | near A0 |
| … | [HSB2012] 1950 | 10:44:10.70 | -59:42:51.2 | 15.45 | 0.57 | 1.08 | … | near A0 |
| 10444195-5942472 | Cl Trumpler 16 228 | 10:44:41.96 | -59:42:47.3 | 13.72 | 0.32 | 0.5 | … | near A0 |
| 10445290-5939245 | DETWC Tr 16 J104452.9-593924 | 10:44:52.90 | -59:39:24.6 | 16.55 | 1.19 | 1.78 | … | near A0 |
| 10450403-5946292 | Cl* Trumpler 14 Y 268 | 10:45:04.03 | -59:46:29.3 | 14.73 | 0.54 | 0.94 | … | near A0 |
| … | [HSB2012] 3378 | 10:45:04.40 | -59:41:47.5 | 13.47 | 0.45 | 0.66 | … | near A0 |
| 10450477-5933198 | Cl* Trumpler 14 Y 80 | 10:45:04.77 | -59:33:19.9 | 13.64 | 0.49 | 0.77 | … | near A0 |
| … | [HSB2012] 3593 | 10:45:11.70 | -59:41:16.3 | 13.64 | 0.35 | 0.55 | … | near A0 |
| … | [HSB2012] 3648 | 10:45:14.00 | -59:41:42.0 | 13.02 | 0.4 | 0.63 | … | near A0 |
| 10451484-5943341 | 2MASS J10451484-5943341 | 10:45:14.85 | -59:43:34.1 | 13.85 | 0.7 | 1.14 | … | near A0 |
| 10452008-5942084 | Cl* Trumpler 14 Y 190 | 10:45:20.09 | -59:42:08.4 | 13.99 | 0.45 | 0.74 | B | near A0 |
| 10452660-5943475 | Cl* Trumpler 14 Y 235 | 10:45:26.61 | -59:43:47.5 | 14.72 | 0.56 | 0.91 | … | near A0 |
| 10452732-5945187 | 2MASS J10452732-5945187 | 10:45:27.33 | -59:45:18.7 | 17.05 | 1.04 | 2.01 | … | near A0 |
| 10453920-5943105 | 2MASS J10453920-5943105 | 10:45:39.21 | -59:43:10.6 | 15.65 | 0.57 | 1.09 | … | near A0 |
| 10454039-5938374 | [HSB2012] 4287 | 10:45:40.39 | -59:38:37.4 | 15.75 | 0.72 | 1.25 | … | near A0 |
| 10454449-5939258 | Cl* Trumpler 14 Y 135 | 10:45:44.50 | -59:39:25.9 | 14.61 | 0.68 | 1.03 | … | near A0 |
| 10452263-5930223 | 2MASS J10452263-5930223 | 10:45:22.64 | -59:30:22.4 | 14.02 | 0.54 | 0.96 | … | B type - HAeBe |
| 10440993-5934360 | Cl* Trumpler 14 VBF 93 | 10:44:09.93 | -59:34:36.0 | 13.56 | 0.24 | 0.68 | … | near A0 - HAeBe |
| 10443883-5933470 | 2MASS J10443883-5933470 | 10:44:38.84 | -59:33:47.0 | 13.88 | 0.42 | 0.76 | … | near A0 - HAeBe |
| 10445220-5944212 | 2MASS J10445220-5944212 | 10:44:52.20 | -59:44:21.3 | 12.66 | 0.4 | 0.74 | … | near A0 - HAeBe |
| 10450972-5945448 | Cl* Trumpler 14 Y 265 | 10:45:09.73 | -59:45:44.9 | 15.23 | 0.7 | 1.19 | … | near A0 - HAeBe |
| 10453372-5949596 | [HSB2012] 4157 | 10:45:33.72 | -59:49:59.7 | 14.74 | 0.93 | 1.58 | … | near A0 - HAeBe |
| 10435015-5934068 | Cl* Trumpler 14 Y 555 | 10:43:50.16 | -59:34:06.8 | 13.89 | 0.74 | 1.23 | … | HAeBe |
| 10440112-5935352 | 2MASS J10440112-5935352 | 10:44:01.12 | -59:35:35.3 | 14.98 | 0.66 | 1.13 | … | HAeBe |
| 10442806-5948127 | [HSB2012] 2420 | 10:44:28.07 | -59:48:12.7 | 16.14 | 0.93 | 1.57 | … | HAeBe |
| 10443030-5937326 | [HSB2012] 2494 | 10:44:30.30 | -59:37:32.7 | 16.72 | 0.72 | 1.73 | … | HAeBe |
| 10443050-5937477 | [HSB2012] 2504 | 10:44:30.50 | -59:37:47.7 | 17.38 | 0.86 | 1.54 | … | HAeBe |
| 10450445-5937298 | Cl* Trumpler 14 Y 102 | 10:45:04.46 | -59:37:29.8 | 13.89 | 0.56 | 0.95 | … | HAeBe |
| 10450994-5943492 | DETWC Tr 16 J104510.0-594349 | 10:45:09.94 | -59:43:49.3 | 16.51 | 0.91 | 1.46 | … | HAeBe |
| 10452107-5941444 | Cl Trumpler 16 242 | 10:45:21.07 | -59:41:44.5 | 12.85 | 0.47 | 0.83 | B | HAeBe |
| 10452605-5940025 | 2MASS J10452605-5940025 | 10:45:26.06 | -59:40:02.5 | 13.52 | 0.49 | 0.84 | … | HAeBe |
| 10453834-5942078 | [S87b] IRS 44 | 10:45:38.34 | -59:42:07.9 | 13.55 | 0.6 | 1.16 | … | HAeBe |
| 10454029-5948297 | [HSB2012] 4282 | 10:45:40.30 | -59:48:29.7 | 16.43 | 1.52 | 2.38 | … | HAeBe |
4 Massive stars
Our observed sample selection was made with the aim of studying low-mass stars in Carina, starting from A-type stars. However, a number of earlier-type stars are serendipitously found among the spectra studied here. Those O-type and B-type stars are intrinsically more luminous than the rest of the sample, but some were included here because of their higher extinctions or, in some cases, because they are located at significantly longer distances (the Carina Nebula is close to the tangent of a spiral arm). Although HR15n spectra are not ideal for a detailed classification of hot stars, we attempt here to assign a qualitative classification of these stars, whose importance in the study of the Carina SFR cannot be neglected. The spectroscopic information is complemented with a study using archival photometry.
4.1 Spectroscopic analysis
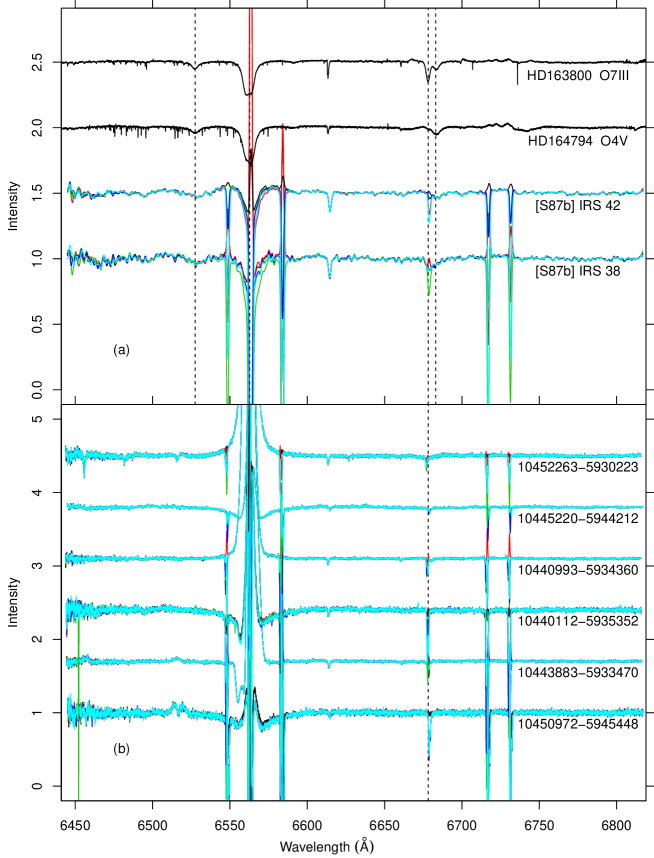
As mentioned in Sect. 2, the HR15n wavelength range contains the He I 6678.15Å line, which is a very useful diagnostics to select B-type stars. Of course, care must be used since at nearly the same wavelength a Fe I line is found in cooler stars, so that establishing a B-type spectrum also requires absence of metallic lines, and especially the group of lines between 6490-6500Å (Damiani et al. 2014), strong enough to remain recognizable even in fast rotators. As explained in Sect. 2 above (and see Paper I for details), H and He I lines, which are the most intense lines in the HR15n range for late-B stars, and the only detectable at low SNR, are both coincident with nebular sky lines, whose contribution is often impossible to subtract accurately. Therefore, classification of late-B stars on the basis of the present data may only be approximate. In practice it is often impossible to confirm or exclude the presence of a weak He I line in the spectrum of a fast-rotating star without metallic lines, to discriminate between a late-B and an early-A type, and therefore we will assign to these stars a generic ”late-B/early-A” type. In tens of other cases, He I is safely detected, but again nebular lines make the determination of the stellar He I EW unreliable: these stars were thus classified as ”B-type” without better detail. Examples of B-type stars in our dataset are shown in Fig. 6-. In this Figure, differences in the adopted sky correction are evident only in the cores of nebular lines H, [N II] 6548,6584Å, He I, and [S II] 6717,6731Å.
Some of the B stars show a characteristic C II doublet at 6578-6583Å, which is typical of mid-B stars, but is enhanced in bright giants or supergiants (Grigsby et al. 1992, Sigut 1996, McErlean et al. 1999). We therefore consider these stars as candidate B supergiants, although some of them may be main-sequence B stars as well. We show some of these spectra in Figure 6-, together with spectra of two known B supergiants (top two spectra) from the UVES/POP dataset (Bagnulo et al. 2003).
The Gaia-ESO spectra of two of our stars show features suggesting an O stellar type: these are the He ii lines at 6527 Å and 6683 Å. Their spectra are shown in Figure 7- (bottom two spectra), compared with known O stars from UVES/POP. The intensity ratio between He i 6678 Å and the neighboring He ii 6683 Å line would be a sensitive measure of spectral type; however, the nebular contamination at 6678 Å is strong for both stars, since they are highly reddened and faint, which prevents accurate derivation of their spectral types. Furthermore, a large fraction of OB stars are spectroscopic binaries (Sota et al. 2014) and an examination of these lines in the sample covered by spectroscopic surveys such as OWN (Barbá et al. 2010), IACOB (Simón-Díaz et al. 2011), or CAFÉ-BEANS (Negueruela et al. 2015) reveal a number of cases where a B+B SB2 (each star with a He i 6678 Å line) masquerades as a single object with both He i and He ii lines. Finally, He ii 6527 Å is close to a broad DIB. Therefore, their identification as O stars based on their spectra is tentative at this stage. Both stars have already appeared in the literature on Carina stars, first as bright IR sources in Smith (1987 - the corresponding designation is reported in Fig. 7-), then as candidate massive stars from both X-ray and IR observations (Sanchawala et al. 2007, Povich et al. 2011a); no optical spectra were however published for these stars before.
Finally, 17 stars are good or possible candidates as Herbig Ae/Be stars, having an A/B type and definite (regardless of sky-subtraction option chosen) wide emission at H. We show some examples of these stars’ spectra in Figure 7-. Some of the spectra show also absorption or emission in the Fe II lines at 6456.38, 6516.08Å, indicative of hot gas. While many of these stars’ spectra show clearly wide H absorption wings, underlying the circumstellar H emission, in some cases the absorption component is overwhelmed by the wide emission component: in these cases the HAeBe nature is suggested by either a He I line, by the Fe II lines, or by the optical photometry, better consistent with an A-B type than with a lower-mass CTTS.
All massive stars found in our spectral dataset are listed in Table LABEL:bstars. The ’SIMBAD Id’ column shows that all of these stars have also appeared in the SIMBAD database; however, for only 12 of them a B spectral type was already determined: therefore, the large majority of our early-type stars are new entries in the massive-star population of Carina, including all HAeBe stars. Incidentally, our complete spectral sample also includes two stars for which SIMBAD lists a B spectral type (with no reference given), while our spectra show definitely later (F and K) spectral types, as shown in Figure 8.
We have also matched our stellar sample with the lists of candidate massive stars from Sanchawala et al. (2007) and Povich et al. (2011a). Of the seven matches with the Sanchawala et al. (2007) candidates, we confirm a type earlier than early-A for 4 (at most 5) stars; only four of our stars match the Povich et al. (2011a) candidates, and all of them are confirmed as early-type stars. The combined list contains 11 massive star candidates, of which only 2-3 are not confirmed. Again, these are small numbers with respect to the number of new early-type stars found for the first time in our Gaia-ESO spectra (110 stars in Table LABEL:bstars), in a spatial region much smaller than the whole Carina region covered by the Povich et al. (2011a) study.
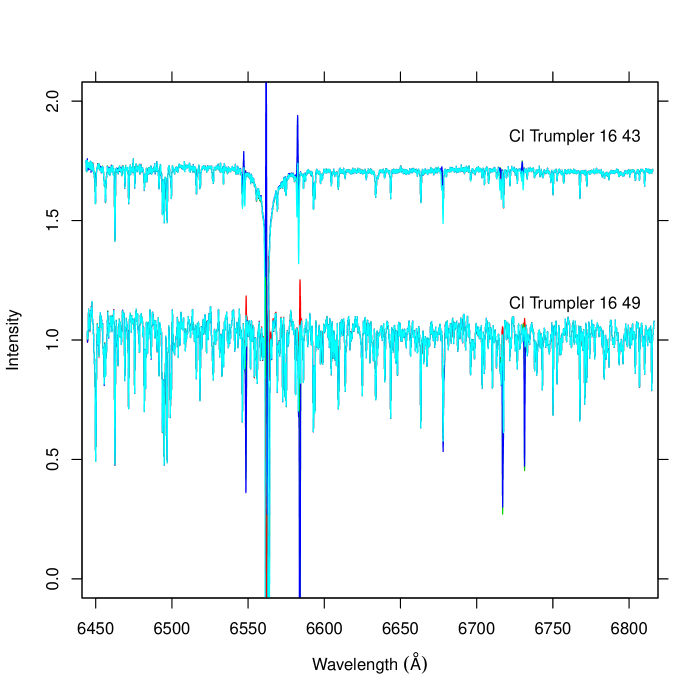
4.2 Photometric analysis with CHORIZOS
Some of the massive stars identified in this section are potentially interesting because their colors suggest large extinctions ( or higher) which are rarely found for objects immersed in H ii regions. For that reason we selected 10 stars from Table LABEL:bstars that are potential candidates for being highly extinguished. For seven of the stars photometry is available from Hur et al. (2012) and 2MASS (Table 6) while for the remaining three only photometry exists (Table 7).
We processed the photometry described above using the CHORIZOS code (Maíz Apellániz 2014) in order to measure the extinction experienced by the stars and, to the degree in which it is possible, their effective temperature and logarithmic distance . The procedure followed is similar to the one used in other papers such as Maíz Apellániz et al. (2015). With the purpose of obtaining independent assessments of these stars’ properties, the results from the spectroscopic analysis above were not used as inputs here. We start by detailing the photometry case:
-
•
We used the Milky Way grid of Maíz Apellániz (2013), grid parameters are effective temperature () and photometric luminosity class (LC). The latter quantity is defined in an analogous way to the spectroscopic equivalent, but maps discrete classes I-V to a continuous variable in the range [0-5.5]. For objects with kK the spectral energy distributions (SEDs) are TLUSTY (Lanz and Hubeny 2003).
-
•
The extinction laws were those of Maíz Apellániz et al. (2014), which are a single-family parameter with the type of extinction defined by (monochromatic analogous of , see Maíz Apellániz 2013). The amount of reddening is parameterized by .
-
•
LC was fixed to 5.0 (“main sequence”) in all cases except for HSB2012 3994, for which it was fixed to 1.0 (“supergiant”). , , , and were left as free parameters.
The photometry case was similar but it required an additional step. The problem with lacking -band photometry is that and become quasi-degenerate (even if LC is known). and , however, are strongly constrained, as the different combinations of valid and yield almost identical values of the two extinction parameters. Therefore, the procedure we followed was to select a reasonable fixed value of and leave , , and as free parameters.
-
•
We find values of between 3.6 and 4.9, higher than the Galactic average but typical for an H ii region.
-
•
ranges between 1.3 and 2.8, reflecting the known strong differential extinction. The three stars with no -band photometry have the three highest values of , as expected.
-
•
Typically, is determined with better precision than either or even though, to a first approximation, . This is not incorrect because the likelihood in the - plane is an elongated quasi-ellipsoid with negative slope i.e. and are anticorrelated. This effect is commonly seen in fits to extinguished hot stars with CHORIZOS or similar codes.
-
•
The most important result regarding the extinction is the location of four stars (S87b IRS 41, S87b IRS 42, HSB2012 1920, and S87b IRS 38) in the - plane. A comparison with Figure 2 of Maíz Apellániz (2015) reveals that they are in a region where no other known Galactic OB stars are located. That is because for low values of it is possible to find a large range of values but for large reddenings tends to be close to the average 3.1 value. In other words, those four stars are exceptional in having large values of both and , and their extinctions laws deserve a more detailed study.
-
•
We plot in Fig. 9 the dependence of of the CHORIZOS fit with reddening. For , the fits are reasonably good even for values of , indicating the validity of the extinction laws of Maíz Apellániz et al. (2014) for low . For , there are good fits for low values of the reddening but grows increasingly large as increases, indicating that the extinction laws of Maíz Apellániz et al. (2014) need to be modified for large values of . This is not surprising, given that those laws were derived using stars with lower reddenings and here we are extrapolating to much larger values.
-
•
For two of the B-type stars (as determined from the spectroscopy) with photometry (HSB2012 3017 and HSB2012 3994) the CHORIZOS-derived is consistent with them being mid-B stars. For the other five objects with photometry (from the spectroscopy, three B types, one B SG and one O type), the uncertainties in are larger and the values lean towards them being O stars. However, we should be cautious of that result, especially for the cases with high . They could be late-O stars (with weak He ii 6683 Å) or the fitted values for could be biased by the extinction law (Maíz Apellániz et al. 2014).
-
•
HSB2012 3994 has an exceptionally large fitted distance (beyond the expected extent of the Galactic disk). One possible solution is that it is not a supergiant but instead a lower luminosity star. Even then, it is likely to lie beyond the Carina Nebula.
-
•
Three other stars (HSB2012 230, HSB2012 1395, and HSB2012 2913) are also likely to lie beyond the Carina Nebula. On the other hand, the fitted for HSB2012 3017, S87b IRS 41, and S87b IRS 42 are compatible with them belonging to the Carina Nebula Association. It should be pointed out that the latter list includes the two stars with the highest values of . That is an expected effect because for stars beyond the Carina Nebula one expects a larger contribution to extinction from the diffuse ISM and, hence, a lower .
| Star | LC | |||||||||||
|---|---|---|---|---|---|---|---|---|---|---|---|---|
| kK | mag | pc | mag | |||||||||
| HSB2012 3017 | 22.2 | 2.5 | 5.0 | 3.62 | 0.08 | 1.291 | 0.039 | 3.50 | 0.07 | 4.688 | 0.077 | 1.9 |
| HSB2012 230 | 41.8 | 5.3 | 5.0 | 3.95 | 0.07 | 1.393 | 0.023 | 3.88 | 0.11 | 5.531 | 0.036 | 0.8 |
| HSB2012 1395 | 42.3 | 5.2 | 5.0 | 4.20 | 0.08 | 1.384 | 0.022 | 4.11 | 0.11 | 5.831 | 0.040 | 0.7 |
| HSB2012 2913 | 40.8 | 6.0 | 5.0 | 3.69 | 0.05 | 1.828 | 0.026 | 3.85 | 0.12 | 6.756 | 0.040 | 0.2 |
| HSB2012 3994 | 18.5 | 3.2 | 1.0 | 4.57 | 0.10 | 1.290 | 0.045 | 4.51 | 0.05 | 5.902 | 0.114 | 3.7 |
| S87b IRS 41 | 42.4 | 4.4 | 5.0 | 4.92 | 0.09 | 1.351 | 0.020 | 3.37 | 0.09 | 6.669 | 0.034 | 6.4 |
| S87b IRS 42 | 42.0 | 4.2 | 5.0 | 4.60 | 0.06 | 1.932 | 0.021 | 3.22 | 0.09 | 8.860 | 0.033 | 11.3 |
| Star | |||||||
|---|---|---|---|---|---|---|---|
| mag | mag | ||||||
| HSB2012 3880 | 3.64 | 0.06 | 2.106 | 0.030 | 7.636 | 0.040 | 1.4 |
| HSB2012 1920 | 3.93 | 0.06 | 2.238 | 0.030 | 8.757 | 0.026 | 4.6 |
| S87b IRS 38 | 4.07 | 0.05 | 2.825 | 0.030 | 11.394 | 0.034 | 30.4 |
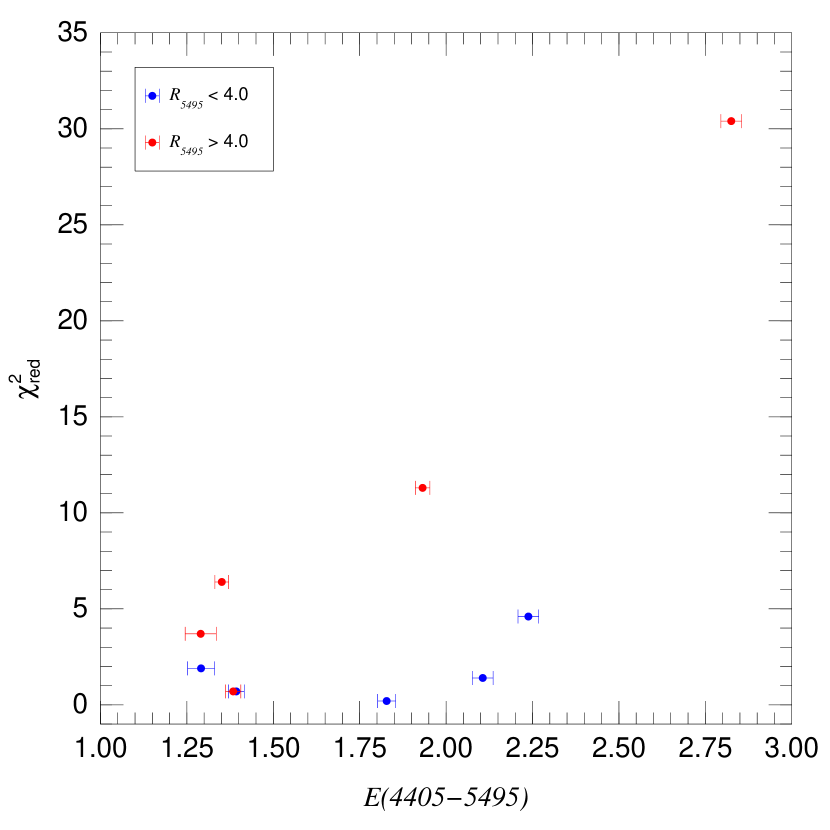
We should note that the uncertainties derived by CHORIZOS are relatively small but not unrealistic because for over a decade we have worked to eliminate the systematic errors that have plagued other works. That includes recalculating the zero points for different photometric systems (Maíz Apellániz 2005, 2006, 2007), complementing and testing different atmosphere grids (Maíz Apellániz 2013a), deriving a new family of extinction laws that provides significant better fits to photometric data than pre-existing ones (Maíz Apellániz 2013b, Maíz Apellániz et al. 2014a), obtaining a library of data on reference stars to serve as a test bed for all of the above (Maíz Apellániz et al. 2004, (Maíz Apellániz and Sota 2008, Maíz Apellániz et al. 2011), and integrating everything into the code.
5 Spatial groups
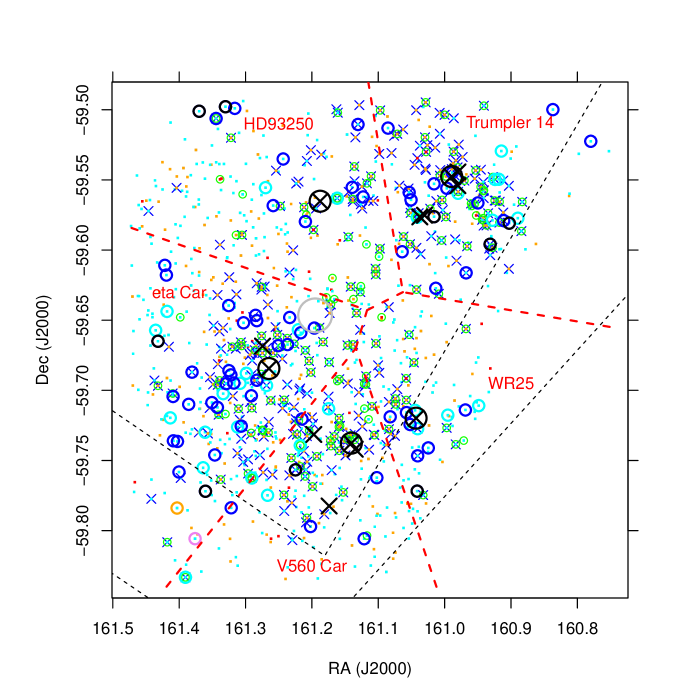
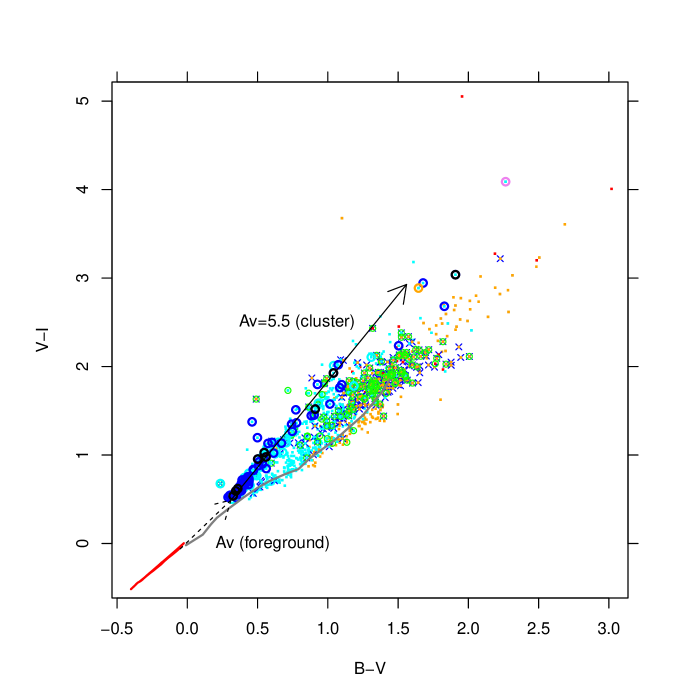
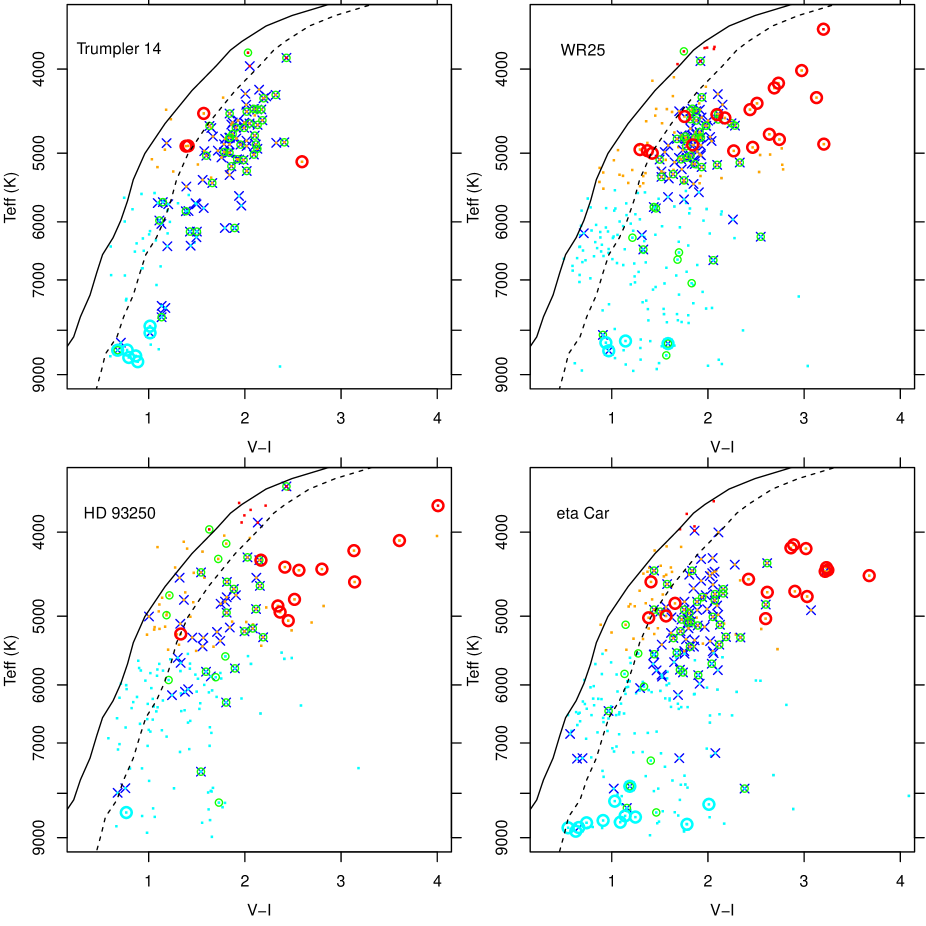
The Carina Nebula is known to host a morphologically complex stellar population, distributed among approximately 20 sub-clusters and a sparse population according to Feigelson et al. (2011), of which Tr 14 and Tr 16 are only the most massive. Therefore, we define here several spatial groupings into which we conveniently split our sample stars. Among clusters defined in Feigelson et al. (2011), numbers 1, 3-6, 9-12, 14 fall in the region studied here. This is however a too detailed subdivision considering the number of optical spectra available here, so we prefer a simpler categorization. In Figure 10 we show the spatial distribution of all stars observed in Gaia-ESO, and known massive stars as a reference. The most massive stars are also coincident with the brightest X-ray sources (see Fig.1 in Antokhin et al. 2008), and are those exerting the strongest influence on their neighborhood. Accordingly, we define five spatial regions, delimited by red dashed segments in the Figure, centered on stars HD93129A (O2If*O3.5, central star of Tr 14), V560 Car (= HD93205, O3.5V((f))O8V), HD93250 (O4IIIfc:, central star of Collinder 232), WR25 (= HD93162, O2.5If*/WN6), and Car.
6 Reddening
Determination of optical extinction towards individual stars is very important to establish how they are distributed along the line of sight. A number of studies (e.g., Smith 1987, Hur et al. 2012) have determined that the foreground extinction towards Carina is relatively low (, or ), while higher-reddening stars in the same region show an anomalous reddening law with . In the central part of Carina being studied here, highly obscured member stars have been found by means of X-ray observations (Albacete-Colombo et al. 2008; CCCP). Therefore, even considering only Tr 14/16 (and not the embedded clusters of Feigelson et al. 2011), cluster members are found over a large range of extinction values. The spatially highly non-uniform distribution of extinction is also made obvious by the two prominent SE and SW dark dust lanes.
Figure 11 shows a color-color diagram (using photometry from Hur et al. 2012), where in particular the colors of the early-type stars (large circles) found from our spectroscopy are useful to study the intra-cluster reddening law. The intrinsic colors of massive stars (down to A0) are described by the red line (3-Myr non-rotating solar-metallicity isochrone from Ekström et al. 2012, henceforth Geneva444 http://obswww.unige.ch/Recherche/evoldb/index/Isochrone/), while those of lower-mass stars by the grey line (ZAMS from Kenyon and Hartmann 1995, henceforth KH95). Despite the lack of a detailed classification for the massive stars (Sect. 4), it is expected that most of them will be late-B/early-A stars, with colors . On this basis, the slope of the dashed arrow in Fig. 11 suggests that the foreground reddening law is (slightly larger than the value 1.32 in Bessell et al. 1998), while inside Carina this ratio becomes 1.95 (slope of the black solid arrow), slightly larger than the value found by Hur et al. (2012) of from photometry alone. Figure 11 also shows that some of the B-type stars redder than appear to have a lower ratio, more like a normal reddening law, although their spatial distribution shows no obvious pattern. Moreover, the two candidate O stars found in Sect. 4 are both found at very large reddenings (orange and violet circles), corresponding to intra-cluster extinction . Among stars with , the mentioned O star is the only candidate cluster member: the handful of other stars found in that color range are therefore obscured background giants, whose detection permits us to estimate the total optical extinction of the Nebula, and its spatial variation, as we will discuss below and in Section 9.
We have determined individual extinction values for our stars from their photometric colors, Teff derived from our spectroscopy, and the Teff-color relation from KH95 for ZAMS stars555Although the KH95 relation may be superseded by more recent calibrations, its usage here for deriving is appropriate for best consistency with the Teff calibration in Damiani et al. (2014).; the colors were converted to using the above reddening laws as appropriate, i.e. differently for foreground extinction only () and foregroundintra-cluster extinction, each with its reddening law. Because of our inability to assign a detailed spectral type and photometric color to the early-type stars, their extinction was computed by de-reddening their photometry to match the 3-Myr isochrone from Ekström et al. (2012). Figure 12 shows, separately for the different spatial groups (defined in Section 5), Teff vs. diagrams for all of our stars. The solid line is the KH95 calibration at zero reddening, while the dashed line is the same curve at ; it is clear that most low-mass cluster members fall a little to the right of the latter curve. In this Figure we also show the placement of giant stars (defined from the index in Damiani et al. 2014) as red circles: as anticipated above, most of these giants lie at large reddening values666The employed KH95 calibration is appropriate to ZAMS stars, and therefore the reddening values derived by applying it to giants are only approximate, but sufficient for our classification as background stars., and likely beyond the Carina Nebula. In the Trumpler 14 region virtually no background stars are seen: this might be related to a relatively higher extinction compared to other sightlines, and also to our incomplete target sampling combined with a locally enhanced member-to-field star density ratio.
7 Color-magnitude diagram
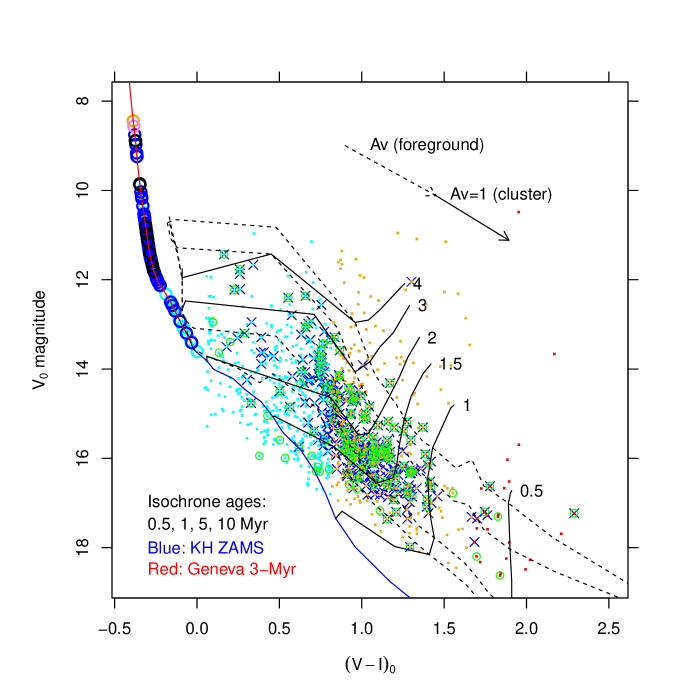
We show in Figure 13 the dereddened CMD of our sample stars, We find probable cluster members of masses down to one solar mass (or slightly below). The nonuniform reddening however prevents from establish a mass completeness limit: in places where reddening is largest we cannot be sure of detecting even O stars (our candidate O star [S87b] IRS 38 has ). Nonuniform reddening causes bright stars to be over-represented among optically selected samples such as this one, hence the relatively large number of B stars relative to solar-mass stars we find in our sample. This dataset is therefore unsuitable for studies (e.g. of the IMF) requiring statistically representative samples. From the Figure it is also apparent the scarcity of cluster members in the range 0.2-0.5, corresponding to late-A and F stars. The same lack of members can be observed in Fig. 12 at Teff near 7000 K. Since lower-mass stars are found in larger numbers, this cannot be due to excessive reddening towards the F stars. One possible explanation for the small number of F-type members is the relatively fast traversal time across their radiative tracks in the CMD. In addition, we might lack the ability to assess their membership, as mentioned already in Sect. 3 for the A-type stars. Since F-type stars are generally found to be as strong X-ray emitters as G-type stars, we will consider again them in the context of the Carina X-ray data below.
Ages for the low-mass stars estimated from the isochrones in Fig. 13 are distributed mostly in the range 1-5 Myr, in agreement with previous studies (e.g., Tapia et al. 2003, Carraro et al. 2004, Hur et al. 2012). As noted by e.g. Smith and Brooks (2008) or Wolk et al. (2011), not all clusters in Carina have the same age (Tr 14, in particular, is more compact and probably younger than Tr 16). The problem of establishing their age relationship will be discussed in Section 10.
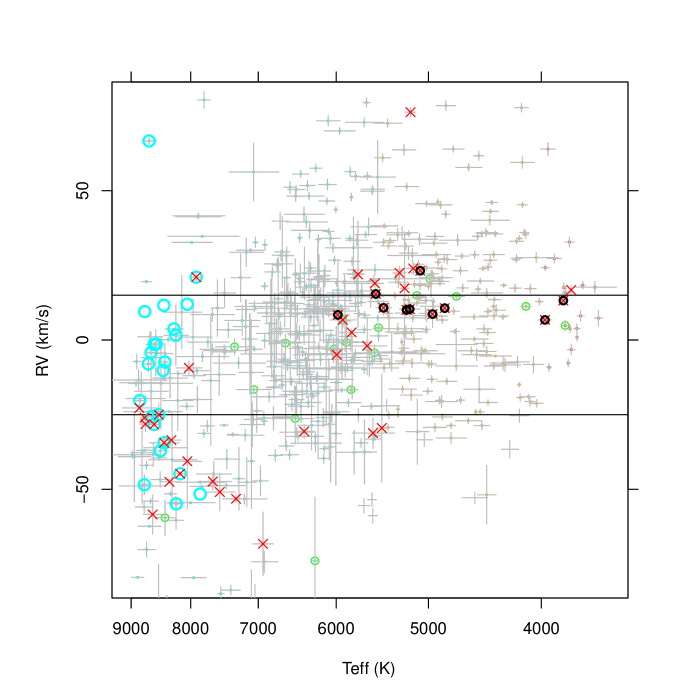
8 X-ray data
In the subregion comprising Tr 16 and WR25 we find approximately 180 low-mass candidate Carina members. Considering that our target selection involved a % down-sampling of all candidate members from optical photometry down to , we can extrapolate to members down to that magnitude limit: this is much smaller than the number of X-ray sources (1035) found in the same region by Albacete-Colombo et al. (2008). An even larger number was found in the CCCP X-ray survey, although based on the same Chandra observation in the field of Tr 16, because of the less conservative choices adopted in detecting point sources. Spurious detections in Albacete-Colombo et al. (2008) are predicted not to exceed sources, and the number of unrelated field X-ray sources is , so that the number of X-ray members in this subregion remains . Therefore, a significant excess of X-ray sources remain, above the number of members inferred from our spectroscopic data. These must be stars fainter than our selection limit, either because of their low mass, or because of large extinction (or both). Since their number is not small with respect to the spectroscopically studied sample, we cannot overlook them for a proper understanding of the properties of the SFR. Here we try to investigate their nature.
Fourty X-ray detected late-type stars (21 from Albacete-Colombo et al. 2008) were observed spectroscopically, but not classified here as members; of them, 11 are RV10 stars, and 6 are near-ZAMS rejected members discussed in Section 3. We first examine whether this can reveal a failure of our membership criteria. These stars do not cluster at any particular place in the CMD diagram, and there is no reason to conclude that as a group they should be included among members. The same conclusion is reached from Figure 14, showing RV vs. Teff exclusively for non-member stars: the X-ray emitting non-members are randomly scattered, and in particular their membership status would not change by any small adjustment of the nominal RV range for members (horizontal lines). We recall that, if these X-ray sources had lithium EW above 150 mA, they would have been accepted as members even in the presence of discrepant RV (in order not to lose binaries)777 The few red crosses inside the nominal RV range were rejected as members because of their proximity to the ZAMS, as explained above.. Thus, the red crosses in Fig. 14 have not only discrepant RV but also no lithium. As discussed above, in the Teff range 9000-7000 K our membership criteria may be weakest; yet, even in this range the number of potential candidates from X-rays is very small, and they appear to have all significantly discrepant RV. Therefore, these X-ray detected stars with no lithium and discrepant RV are unlikely members, and will not be considered further888 Of these 40 stars, 37 are classified by Broos et al. (2011b) within the CCCP project, on the basis of X-ray properties and optical/NIR photometry alone: all but four (unclassified) objects were assigned to the “Carina young star” group, including thus the majority of near-ZAMS and RV10 stars, which we instead excluded on the basis of the Hur et al. (2012) photometry, and our RVs, respectively.. We also conclude that the lack of member stars in the temperature range 9000-7000 K is real, and not a byproduct of our membership criteria. This is probably related to the R-C gap found in the photometric CMD of several clusters by Mayne et al. (2007); the same effect is not recognizable in the CMD of Carina clusters because of strong differential extinction.
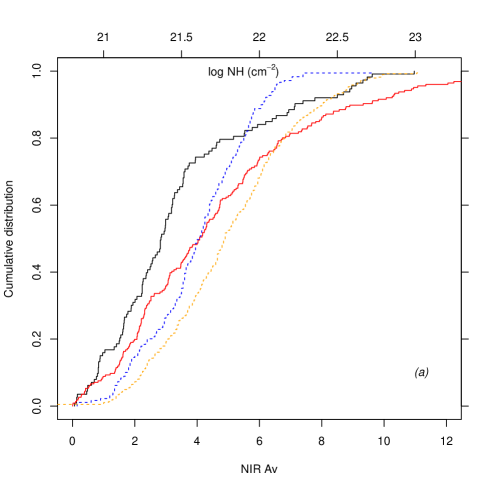
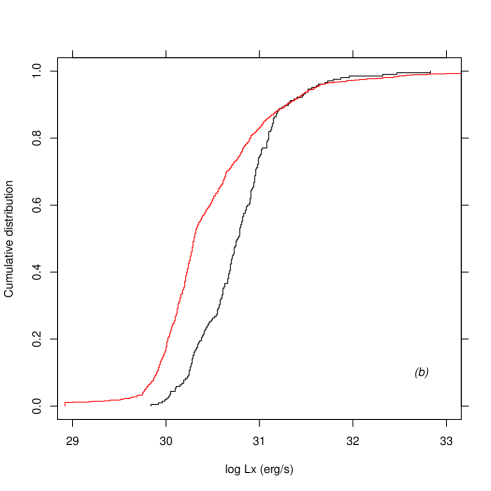
Next, we examine the X-ray properties of X-ray detected sources which have not been observed spectroscopically. We take the list of sources and their properties from Albacete-Colombo et al. (2008). Figure 15- compares cumulative distributions of extinction (as derived from the near-IR colors, for X-ray sources with a 2MASS counterpart), for the X-ray sources in the spectroscopic sample and in the no-spectroscopy sample. A Kolmogorov-Smirnov (KS) statistical test gives a probability that the two distributions are drawn from the same parent sample of only , confirming the significance of their visually apparent difference. Similar results are obtained from consideration of the absorbing column density , as derived from model best fits to the Chandra ACIS X-ray spectra (Albacete-Colombo et al. 2008), whose distributions for the spectroscopically observed and unobserved samples of X-ray sources are also shown in Figure 15-: here a KS test gives a probability of that the two distributions are drawn from the same parent sample. The two tests just made do not refer exactly to the same subsamples of X-ray sources, since only 2/3 of the X-ray sources in Albacete-Colombo et al. (2008) have a 2MASS counterpart, and only those detected with more than 20 X-ray counts had a spectral fit performed. Nevertheless, there is definite evidence that the optically missed, X-ray detected members are more obscured than the stars in our spectroscopic sample.
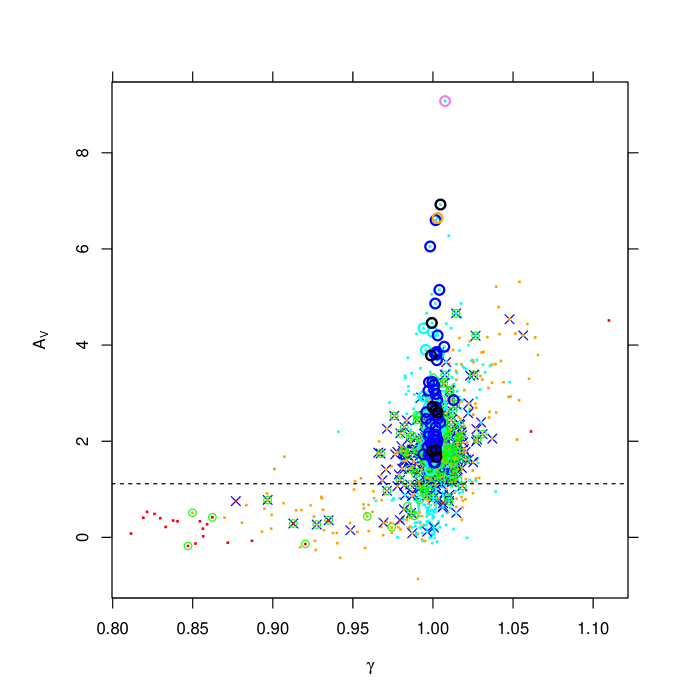
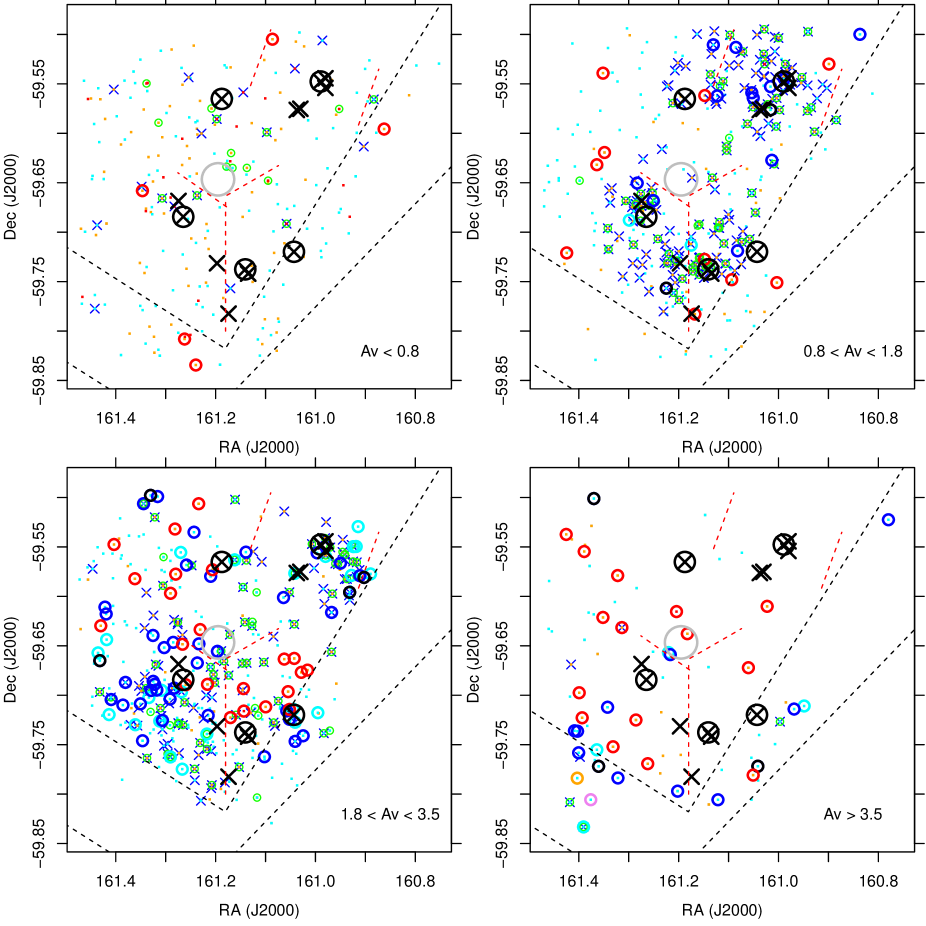
This finding does not rule out that the X-ray detected sample may contain also a number of low-extinction members at fainter optical magnitudes than our limit. To test this, we consider the distributions of X-ray luminosities , derived from X-ray spectral fits and therefore corrected for absorption, for the spectroscopic and no-spectroscopy samples, as shown in Figure 15-: the KS test gives a probability of no difference of . Young PMS low-mass stars are known to be in an X-ray saturated regime, where the X-ray luminosity is on average proportional to stellar bolometric luminosity, (Flaccomio et al. 2003, Preibisch et al. 2005, Damiani et al. 2006a); therefore, the lower (unabsorbed) X-ray luminosities of stars without spectroscopy implies that these stars have on average lower luminosities (and mass) than our spectroscopic sample. The X-ray detected member sample is therefore more complete than the spectroscopic sample both towards lower masses and towards more obscured stars.
9 Cluster structure
We attempt here to combine all data discussed above in a single coherent picture of the structure of central Carina. We first test the meaningfulness of the derived extinction values , by comparing them with a spectroscopic gravity index , defined in Damiani et al. (2014). The prediction being tested here is that all main-sequence stars later than mid-G, being only observable in the foreground of the Nebula, must have , while most giants will appear in the background, having a much lower space density but higher luminosity. Figure 16 shows that this is exactly the case: high-gravity, main-sequence GKM stars have , and the vast majority of them is found at , while giants (having ) are almost all found in the range between 2-5 mag, typically larger than the extinction towards cluster members.
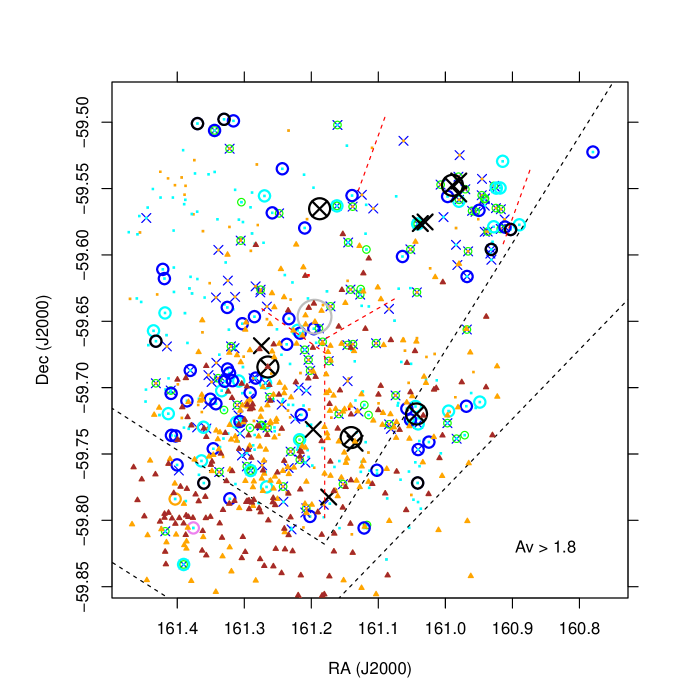
Having better established our confidence in the determined extinction values, we next consider the spatial distributions of stars in several ranges of , as shown in Figure 17. The upper left panel shows all stars with : no clustering is detectable, in agreement with these being foreground stars, unrelated to Carina and its obscuring material. Tens of stars are found projected against the dark V-shaped dust lanes. The number of low-gravity stars (red circles) is here very low. In the upper right panel, the low-extinction cluster members appear, in dense groups with close spatial association to the most massive stars; the dust lanes are here almost devoid of stars, except for a dozen (probably background) stars near WR25, where the total absorption is lower than elsewhere in the lane (see e.g. Fig.1 in Albacete-Colombo et al. 2008). Most of the B-type stars have not yet made their appearance in this range: this makes the number ratio between the early-type and the solar-type stars here probably more representative of its real value. In the next extinction range, shown in the lower left panel, the stellar distribution has changed considerably: low-mass members are more widely dispersed away from the most massive stars, while their density generally increases towards places of higher obscuration. This is seen in the vicinity of Car, which has now many more neighbors towards SE (where they eventually meet the dark lane) than towards NW, and also in the Trumpler 14 region, where again member stars are found exclusively on the side of the cluster nearest to the dark lane. Taking the dashed black lines in the Figure as a reference, we may observe that the number of stars in their immediate vicinity, in both the Tr 14 and Car subregions, increases dramatically from the low-extinction layer to the higher-extinction one. This is also true for the B/early-A stars, most of which found on the high-extinction sides of Tr 14 and Car, respectively. The South-West and North-East regions, around WR25 and HD93250/Collinder 232 respectively, show several low-gravity background giants, indicating that the total Nebula extinction in those regions does not exceed . No background giants are instead found on the high-extinction sides of Tr 14 and Car, nor in the dark lanes (except for the vicinity of WR25 as already remarked). Finally, the lower right panel shows the most reddened stars found in our dataset: only early-type cluster members are found here, including the two candidate O stars (both under the SE obscuring lane) and three candidate B supergiants; at these extinction values, background giants make their appearance even close to the SE dark lane, but not in the region surrounding Tr 14. This extinction pattern agrees qualitatively with that in Smith and Brook (2007; their Fig.5).
Figure 18 shows all stars with together with X-ray detected sources in Tr 16 (most of which members as discussed above) with X-ray hardness index 999 is defined as the count ratio between bands [2-8] keV and [0.5-2] keV., and therefore moderate to large absorption, and not observed spectroscopically. Most moderately-obscured X-ray sources (orange triangles) lie South of Car and between it and WR25, while the heavily-obscured X-ray sources (brown triangles) lie behind the sourthern dark lane, with the largest source density found between the two new candidate O stars. This subcluster of highly absorbed X-ray sources is named CCCP-Cl 14 in Feigelson et al. (2011), and Tr 16 SE in Sanchawala et al. (2007). Its dominant star, according to Feigelson et al. (2011), is the O eclipsing binary FO 15 (= V662 Car, O5.5Vz + O9.5 V,v), which however we did not observe spectroscopically. The optical extinction of this star is (Niemela et al. 2006), thus lower than that we find for our candidate O stars [S87b] IRS 42 and IRS 38 ( and 9.1, respectively) in the same region. At the same location, an obscured cluster of massive stars was found from Spitzer images by Smith et al. (2010 - called ’cluster G’ in their Table 4), who argued that this is not an embedded, extremely young cluster, but more likely a cluster of age 1-2 Myr, behind and not inside the foreground dark lane.
Figure 18 shows no clear separation between subclusters, in proceeding from Car to its SE, but only a gradually increasing proportion of highly absorbed Carina members, both massive and of low-mass (the latter only from X-rays). Instead, the low-extinction members (in Figure 17, upper right panel) are much more clustered in tight groups centered on the respective massive stars. It is interesting to compare the distribution of stars with that of the ionized gas from Paper I, consisting of several large shells, almost devoid of dust, centered on Car, WR25, and Tr 14. The observed gradual increase in extinction towards SE, if most stars are enclosed in such dust-free shells, implies that the obscuring material must lie in front of the star clusters (and gas), and not generally mixed with them. At its SE border, the Car gas shell does not seem to interact with matter in the dark lane, but instead fades behind it: this agrees with the conclusion by Smith et al. (2010) that the obscured SE subcluster (their ’cluster G’) lies behind the lane and does not interact with it. This is probably true also of the newly found massive OB stars in the direction of the dark lanes, so that their UV radiation would illuminate most cluster stars with little attenuation, despite the very large extinction found towards us. Of course, circumstellar dust may still exists around individual stars, which contributes to the scatter in Fig. 17 and shields the massive-star UV flux; however, since we do observe a regular spatial extinction pattern in Fig. 17, local extinction is probably a minor contributor to the total observed .
Behind the high-reddening members of Tr 14, with , we do not find virtually any background star. Except for the Tr 14 region and the dark lanes, we have instead found background giants throughout most of the surveyed part of Carina, and therefore we have been observing the brightest members through the entire thickness of the nebula until its far side.
10 Stellar ages
We investigate here if there are measurable age differences between the Carina subclusters. An useful age diagnostics for young low-mass stars is the lithium resonance line at 6707Å, whose EW as a function of Teff was shown in Fig. 5. In the temperature range of the Carina members studied here, however, lithium EW is insensitive to age if a cluster is younger than several tens Myr (Jeffries 2014), as is the case for Carina clusters. Accordingly, the scatter of datapoints in the above figure may be entirely accounted for by errors on Teff (%) and lithium EW, and is not related to real age differences among the observed Carina members.
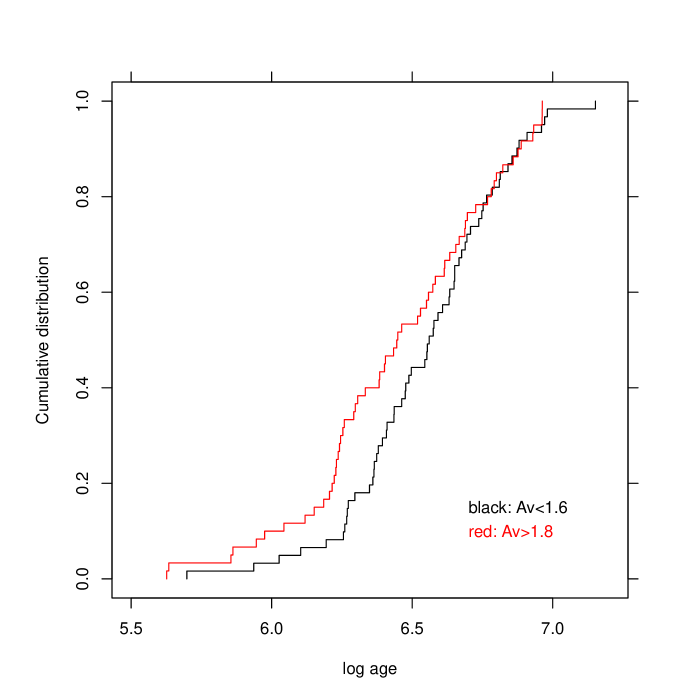
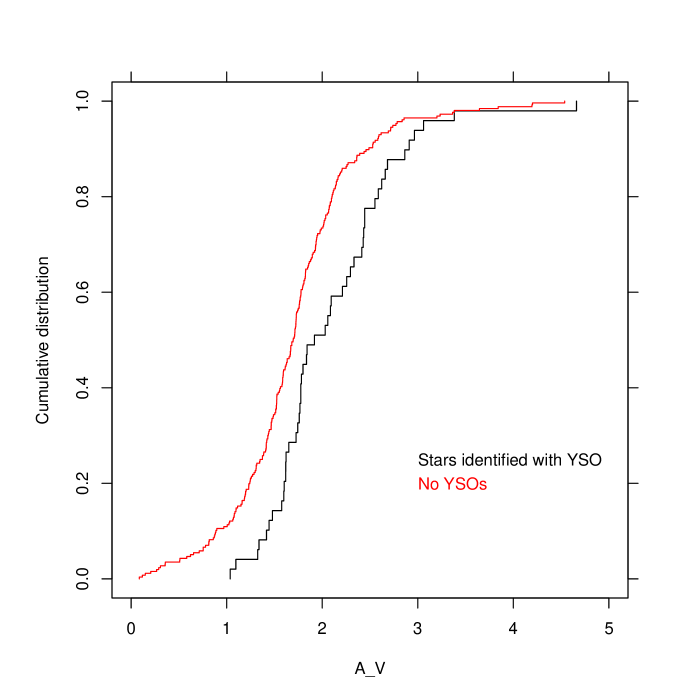
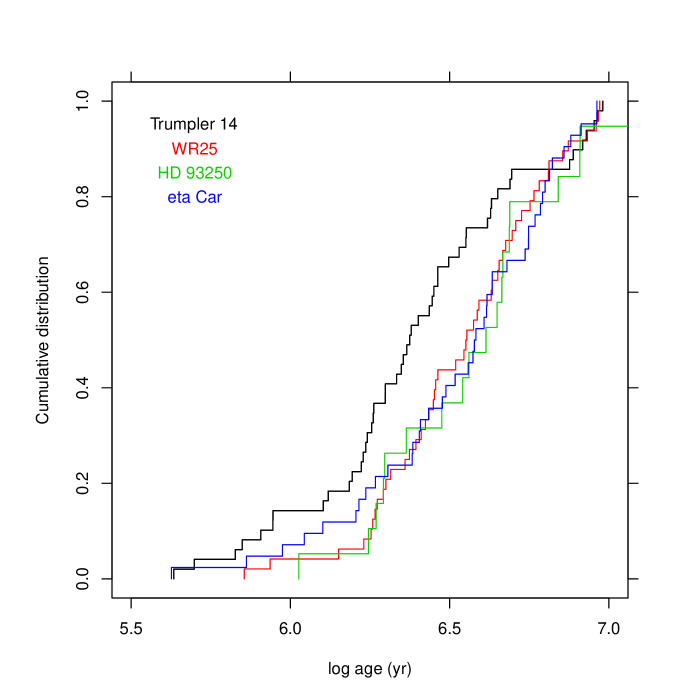
We examine the relative ages of the different Carina subgroups as derived from the star location in the CMD, compared to Siess et al. (2000) isochrones. This methods still benefits from our spectroscopic data since apparent star colors and magnitudes are individually de-reddened using the extinction values derived above. Besides that, there remain a series of caveats related to non-photospheric contributions such as veiling in accreting PMS members, uncertainties in the reddening law, or unrecognized binaries.
The distributions of photometric ages for low- and high-extinction subsamples are shown in Figure 19: both distributions are rather wide, over more than one dex in ages. This agrees with the earlier result of DeGioia-Eastwood et al. (2001) that star formation in these clusters was active over the last 10 Myr, which should be taken as an upper limit to the true age spread considering e.g. uncertainties in extinction and reddening law, binarity, or variability. The difference between the two distributions in the Figure points to the obscured Carina population being slightly younger than the unobscured one, however with a modest statistical significance of 93.9%.
To corroborate this result, we show in Figure 20 the cumulative distributions of for Carina members with and without a YSO counterpart in the Zeidler et al. (2016) catalog: (younger) members associated with a YSO have a larger extinction than (older) members with no YSO association, with a confidence level of 99.6%.
The cumulative distributions of photometric ages of Carina member stars in the subclusters are shown in Figure 21: stars in Tr 14 are significantly younger (at 99.1% level) than those of all other subgroup (cumulatively), while the age distributions of Car, HD93250 and WR25 subgroups are indistinguishable from one another. This agrees with the already mentioned suggestion that Tr 14 is younger than Tr 16.
11 Rotation

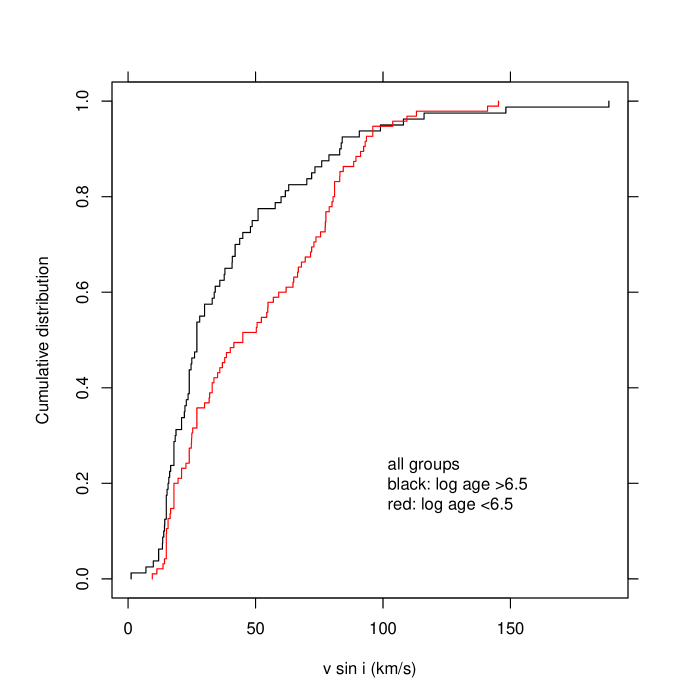
The HR15n spectra of Carina members show that a large fraction of these stars, including lower-mass ones, are fast rotators, with a median km/s for K (Figure 22). To our knowledge, these are the first measurements of rotation rates for Carina PMS stars. Since average stellar rotation rates are strongly mass-dependent, we have chosen for the above Figure a restricted Teff range. Moreover, the Figure suggests a bimodal distribution, with a higher peak near km/s, and a secondary one at km/s, qualitatively similar to that in the ONC (Stassun et al. 1999, Herbst et al. 2002) for masses larger than . Assuming a typical radius for our Carina PMS stars of , the peaks would transform into rotational-period peaks around 1.1 and 3.6 days, respectively, not significantly different from those found in the ONC. We do not find a significant difference between the rotational velocity distributions of CTTS and WTTS, neither globally nor considering each subgroup separately; however, as we have discussed in section 3, an accurate assessment of CTTS status is difficult using our spectra. We have therefore examined the distributions for stars with and without NIR excesses, as measured using the 2MASS color-color diagram (as e.g. in Damiani et al. 2006b), or the Spitzer IRAC diagram (as in Povich et al. 2011b). In our Carina sample only very few stars are found with significant excesses in these NIR/MIR colors, and their rotational-velocity distribution is not significantly different from that of stars with no excesses. Last we have considered our Carina members with a counterpart in the YSO catalogue of Zeidler et al. (2016): the distributions for stars associated and unassociated with a YSO are different at the 92.5% significance level. This is marginal, probably because of the limited member sample size. The sense of the difference, nevertheless, seems to indicate that stars surrounded by a massive dust disk spin slower than stars with no disk, giving some support to the disk-locking paradigm (e.g., Mathieu 2004, Rebull et al. 2006).
We find a more significant difference (at 98.55% level) between sample stars respectively younger and older than 3 Myr (Figure 23). The older stars rotate more slowly than younger ones. This result is similar to that found by Littlefair et al. (2011) for several other young clusters. This is surprising for mostly diskless PMS stars, which should spin up as their moment of inertia decreases during contraction. However, stars in this Carina PMS sample belong mostly to the mass range , and nearly half of them lie along radiative tracks, where contraction is much slower than along the Hayashi track (according to the Siess et al. 2000 models, radius even increases along part of the radiative track for some masses in this range). The richness of Carina, coupled to our limiting magnitude, makes that the stellar mass composition of our sample is very much complementary to that of most existing studies of rotation in young clusters: we are unable to study the rotation of stars below , but have a sample of PMS stars in the range of a size hardly found in any other studied cluster. Therefore, the Carina rotation data can be very important to study the rotational evolution of PMS stars along their radiative track. Similar datasets are still lacking for SFRs in the same richness class as Carina, like those mentioned in Sect. 1.
Besides the difference between younger and older Carina members, Fig. 23 shows that the bimodal distribution is only found in the younger subsample: the older one does not show two bumps in the cumulative distribution (the histogram peaks correspond to the steepest derivatives in the cumulative distribution). This may be related to the development of the radiative stellar core, which has a profound influence on the observed surface rotation (see e.g. Spada et al. 2011). Again, the Carina rotation data may be crucial for testing theoretical models of rotational evolution along the radiative track.
12 Discussion and conclusions
Our study of the Gaia-ESO dataset on Tr 14/16, the richest clusters in the Carina complex, is to our knowledge the first extensive spectroscopic exploration of a sizable sample of stars in a giant SFR, with a mass in excess of , of which Carina is a rare example. Out of 1085 stars observed, more than 100 turned out to be early-type stars, mostly lacking a spectroscopic classification; among them are two new candidate O stars at high extinction, already known as bright IR sources, 17 candidate Herbig Ae/Be stars, and 9 candidate B supergiants, although the limited wavelength range of the studied data prevented a more detailed classification. Based on RV, lithium, and X-ray data, we find 286 Carina low-mass members. Their number ratio with respect to the massive stars is not representative, because the wide range in extinction encountered favors observation of bright member stars at high reddening.
We have confirmed the anomalous reddening law already reported, and placed new constraints on the three-dimensional space distributions of Carina members. In central Carina, there is a relatively small percentage of embedded YSOs (Povich et al. 2011); this and other constraints posed by our previous study of the ionized gas distribution (Paper I) suggest a picture where the extinction towards Carina young stars in the Car/Tr 16 region is mostly caused by dust at some distance from the stars themselves, not mixed with them. This has impact on the amount of UV flux they receive from the most massive cluster stars, and on the consequences that this is likely to have on the evolution of the circumstellar disks (photoevaporation). It is worth noting that some information on the local level of UV irradiation may also come from a detailed analysis of some of the DIBs found in the red spectra of these stars (Kos and Zwitter 2013).
The geometry of the studied region in Carina is not simple. We observed background giants through several sightlines across the studied region, behind a few magnitudes of optical extinction. The dust lane to SE, close to Car, produces enough obscuration to drive a candidate O star near to our limiting magnitude: of course still more deeply obscured massive stars may exist in the same direction. If a blister geometry applies to this part of the cloud, this must be seen sideways from our sightline. In the Tr 14 region close to the western dark lane, instead, the foreground obscuration is a little more uniform, but rises more sharply towards the dust lane. The two dust lanes have therefore a different placement in space with respect to their nearest cluster.
The data suggest a complex history of star formation, with a significantly younger age for Trumpler 14 with respect to all other Carina subgroups. The high-extinction stars are only slightly younger than the low-extinction ones, and more frequently associated with a YSO.
Because of its richness, Carina also provides us with a sample of PMS stars in the range, of a size hardly found in other young clusters. We have presented distributions for this unique sample of stars (significantly larger than e.g. in the study of intermediate-mass star rotation by Wolff et al. 2004, in the ONC). About one-half of these stars are evolving along radiative tracks. We find evidence of a bimodal distribution, analogous to that found in the ONC for lower-mass stars. Stars older than 3 Myr, and mostly on their radiative PMS track, are found to rotate slower than younger stars, which puts constraints on the rotational evolution of intermediate-mass PMS stars.
Acknowledgements.
We wish to thank an anonymous referee for his/her helpful suggestions. Based on data products from observations made with ESO Telescopes at the La Silla Paranal Observatory under programme ID 188.B-3002. These data products have been processed by the Cambridge Astronomy Survey Unit (CASU) at the Institute of Astronomy, University of Cambridge, and by the FLAMES/UVES reduction team at INAF/Osservatorio Astrofisico di Arcetri. These data have been obtained from the Gaia-ESO Survey Data Archive, prepared and hosted by the Wide Field Astronomy Unit, Institute for Astronomy, University of Edinburgh, which is funded by the UK Science and Technology Facilities Council. This work was partly supported by the European Union FP7 programme through ERC grant number 320360 and by the Leverhulme Trust through grant RPG-2012-541. We acknowledge the support from INAF and Ministero dell’Istruzione, dell’Università’ e della Ricerca (MIUR) in the form of the grant ”Premiale VLT 2012”. The results presented here benefit from discussions held during the Gaia-ESO workshops and conferences supported by the ESF (European Science Foundation) through the GREAT Research Network Programme. R. B. acknowledges financial support from INAF under PRIN2013 Programme ’Disks, jets and the dawn of planets’. This research has made use of the SIMBAD database, operated at CDS, Strasbourg, France. This work was also using data products from observations made with ESO Telescopes at the La Silla Paranal Observatory under programme ID 177.D-3023, as part of the VST Photometric H Survey of the Southern Galactic Plane and Bulge (VPHAS, www.vphas.eu).References
- Albacete-Colombo et al. (2008) Albacete-Colombo, J. F., Damiani, F., Micela, G., Sciortino, S., & Harnden, F. R., Jr. 2008, A&A, 490, 1055
- Antokhin et al. (2008) Antokhin, I. I., Rauw, G., Vreux, J.-M., van der Hucht, K. A., & Brown, J. C. 2008, A&A, 477, 593
- Bagnulo et al. (2003) Bagnulo, S., Jehin, E., Ledoux, C., Cabanac, R., Melo, C., Gilmozzi, R., & ESO Paranal Science Operations Team 2003, The Messenger, 114, 10
- Barbá et al. (2010) Barbá, R. H., Gamen, R. C., Arias, J. I., et al. 2010, in RMxAC, Vol. 38, 30–32
- Bell et al. (2013) Bell, C. P. M., Naylor, T., Mayne, N. J., Jeffries, R. D., & Littlefair, S. P. 2013, MNRAS, 434, 806
- Bessell et al. (1998) Bessell, M. S., Castelli, F., & Plez, B. 1998, A&A, 333, 231
- Broos et al. (2011) Broos, P. S., Townsley, L. K., Feigelson, E. D., et al. 2011a, ApJS, 194, 2
- Broos et al. (2011) Broos, P. S., Getman, K. V., Povich, M. S., et al. 2011b, ApJS, 194, 4
- Carraro et al. (2004) Carraro, G., Romaniello, M., Ventura, P., & Patat, F. 2004, A&A, 418, 525
- Damiani et al. (2006) Damiani, F., Micela, G., Sciortino, S., et al. 2006a, A&A, 460, 133
- Damiani et al. (2006) Damiani, F., Prisinzano, L., Micela, G., & Sciortino, S. 2006b, A&A, 459, 477
- Damiani et al. (2014) Damiani, F., Prisinzano, L., Micela, G., et al. 2014, A&A, 566, A50
- Damiani et al. (2016) Damiani, F., Bonito, R., Magrini, L., et al. 2016, arXiv:1604.01208
- DeGioia-Eastwood et al. (2001) DeGioia-Eastwood, K., Throop, H., Walker, G., & Cudworth, K. M. 2001, ApJ, 549, 578
- Drew et al. (2014) Drew, J. E., Gonzalez-Solares, E., Greimel, R., et al. 2014, MNRAS, 440, 2036
- Ekström et al. (2012) Ekström, S., Georgy, C., Eggenberger, P., et al. 2012, A&A, 537, A146
- Feigelson et al. (2011) Feigelson, E. D., Getman, K. V., Townsley, L. K., et al. 2011, ApJS, 194, 9
- Flaccomio et al. (2003) Flaccomio, E., Damiani, F., Micela, G., et al. 2003, ApJ, 582, 398
- Frasca et al. (2015) Frasca, A., Biazzo, K., Lanzafame, A. C., et al. 2015, A&A, 575, A4
- Gilmore et al. (2012) Gilmore, G., Randich, S., Asplund, M., et al. 2012, The Messenger, 147, 25
- Grigsby et al. (1992) Grigsby, J. A., Morrison, N. D., & Anderson, L. S. 1992, ApJS, 78, 205
- Herbst et al. (2002) Herbst, W., Bailer-Jones, C. A. L., Mundt, R., Meisenheimer, K., & Wackermann, R. 2002, A&A, 396, 513
- Hur, Sung, & Bessell (2012) Hur, H., Sung, H., & Bessell, M. S. 2012, AJ, 143, 41
- Kalari et al. (2015) Kalari, V. M., Vink, J. S., Drew, J. E., et al. 2015, MNRAS, 453, 1026
- Kenyon & Hartmann (1995) Kenyon, S. J., & Hartmann, L. 1995, ApJS, 101, 117
- Kos & Zwitter (2013) Kos, J., & Zwitter, T. 2013, ApJ, 774, 72
- Jeffries (2014) Jeffries, R. D. 2014, EAS Publications Series, 65, 289
- Lada & Lada (2003) Lada, C. J., & Lada, E. A. 2003, ARA&A, 41, 57
- Lanz & Hubeny (2003) Lanz, T. & Hubeny, I. 2003, ApJS, 146, 417
- Lanzafame et al. (2015) Lanzafame, A. C., Frasca, A., Damiani, F., et al. 2015, A&A, 576, A80
- Littlefair et al. (2011) Littlefair, S. P., Naylor, T., Mayne, N. J., Saunders, E., & Jeffries, R. D. 2011, MNRAS, 413, L56
- Maíz Apellániz (2004) Maíz Apellániz, J. 2004, PASP, 116, 859
- Maíz Apellániz (2005) Maíz Apellániz, J. 2005, PASP, 117, 615
- Maíz Apellániz (2006) Maíz Apellániz, J. 2006, AJ, 131, 1184
- Maíz Apellániz (2007) Maíz Apellániz, J. 2007, in ASP Conf. Series, Vol. 364, The Future of Photometric, Spectrophotometric and Polarimetric Standardization, ed. C. Sterken, 227
- Maíz Apellániz et al. (2004) Maíz Apellániz, J., Walborn, N. R., Galué, H. Á., & Wei, L. H. 2004, ApJS, 151, 103
- Maíz Apellániz & Sota (2008) Maíz Apellániz, J., & Sota, A. 2008, in Rev. Mex. Astron. Astrofís. (conference series), Vol. 33, 44–46
- Maíz Apellániz et al. (2011) Maíz Apellániz, J., Sota, A., Walborn, N. R., et al. 2011, in Highlights of Spanish Astrophysics VI, ed. M. R. Zapatero Osorio, J. Gorgas, J. Maíz Apellániz, J. R. Pardo, & A. Gil de Paz, 467–472
- Maíz Apellániz (2013a) Maíz Apellániz, J. 2013, in Highlights of Spanish Astrophysics VII, 657–657
- Maíz Apellániz (2013b) Maíz Apellániz, J. 2013, in Highlights of Spanish Astrophysics VII, 583–589
- Maíz Apellániz (2015) Maíz Apellániz, J. 2015, MmSAI, 86, 553
- Maíz Apellániz et al. (2014) Maíz Apellániz, J., Evans, C. J., Barbá, R. H., et al. 2014, A&A, 564, A63
- Maíz Apellániz et al. (2015) Maíz Apellániz, J., Negueruela, I., Barbá, R. H., et al. 2015, A&A, 579, A108
- Mathieu (1994) Mathieu, R. D. 1994, ARA&A, 32, 465
- Mathieu (2004) Mathieu, R. D. 2004, Stellar Rotation, 215, 113
- Mayne et al. (2007) Mayne, N. J., Naylor, T., Littlefair, S. P., Saunders, E. S., & Jeffries, R. D. 2007, MNRAS, 375, 1220
- McErlean et al. (1999) McErlean, N. D., Lennon, D. J., & Dufton, P. L. 1999, A&A, 349, 553
- Morse et al. (1998) Morse, J. A., Davidson, K., Bally, J., et al. 1998, AJ, 116, 2443
- Negueruela et al. (2015) Negueruela, I., Maíz-Apellániz, J., Simón-Díaz, S., et al. 2015, in Highlights of Spanish Astrophysics VIII, 524–529
- Niemela et al. (2006) Niemela, V. S., Morrell, N. I., Fernández Lajús, E., et al. 2006, MNRAS, 367, 1450
- Povich et al. (2011a) Povich, M. S., et al. 2011a, ApJS, 194, 6
- Povich et al. (2011b) Povich, M. S., et al. 2011b, ApJS, 194, 14
- Preibisch et al. (2005) Preibisch, T., Kim, Y.-C., Favata, F., et al. 2005, ApJS, 160, 401
- Preibisch et al. (2011) Preibisch, T., Ratzka, T., Kuderna, B., et al. 2011, A&A, 530, A34
- Randich et al. (2013) Randich, S., Gilmore, G., & Gaia-ESO Consortium 2013, The Messenger, 154, 47
- Rebolledo et al. (2016) Rebolledo, D., Burton, M., Green, A., et al. 2016, MNRAS, 456, 2406
- Rebull et al. (2006) Rebull, L. M., Stauffer, J. R., Megeath, S. T., Hora, J. L., & Hartmann, L. 2006, ApJ, 646, 297
- Sanchawala et al. (2007) Sanchawala, K., Chen, W.-P., Lee, H.-T., et al. 2007, ApJ, 656, 462
- Schmitt (1997) Schmitt, J. H. M. M. 1997, A&A, 318, 215
- Siess et al. (2000) Siess, L., Dufour, E., & Forestini, M. 2000, A&A, 358, 593
- Sigut (1996) Sigut, T. A. A. 1996, ApJ, 473, 452
- Simón-Díaz et al. (2011) Simón-Díaz, S., Castro, N., García, M., & Herrero, A. 2011, in IAUS, Vol. 272, 310–312
- Smith (1987) Smith, R. G. 1987, MNRAS, 227, 943
- Smith (2006) Smith, N. 2006, ApJ, 644, 1151
- Smith et al. (2005) Smith, N., Stassun, K. G., & Bally, J. 2005, AJ, 129, 888
- Smith & Brooks (2007) Smith, N., & Brooks, K. J. 2007, MNRAS, 379, 1279
- Smith & Brooks (2008) Smith, N., & Brooks, K. J. 2008, Handbook of Star Forming Regions, Volume II, 138
- Smith et al. (2010) Smith, N., Povich, M. S., Whitney, B. A., et al. 2010, MNRAS, 406, 952
- Sota et al. (2014) Sota, A., Maíz Apellániz, J., Morrell, N. I., et al. 2014, ApJS, 211, 10
- Spada et al. (2011) Spada, F., Lanzafame, A. C., Lanza, A. F., Messina, S., & Collier Cameron, A. 2011, MNRAS, 416, 447
- Stassun et al. (1999) Stassun, K. G., Mathieu, R. D., Mazeh, T., & Vrba, F. J. 1999, AJ, 117, 2941
- Tapia et al. (2003) Tapia, M., Roth, M., Vázquez, R. A., & Feinstein, A. 2003, MNRAS, 339, 44
- Townsley et al. (2011) Townsley, L. K., Broos, P. S., Corcoran, M. F., et al. 2011, ApJS, 194, 1
- Vaidya et al. (2015) Vaidya, K., Chen, W.-P., & Lee, H.-T. 2015, AJ, 150, 195
- Walborn (1973) Walborn, N. R. 1973, ApJ, 179, 517
- Walborn (1995) Walborn, N. R. 1995, Revista Mexicana de Astronomia y Astrofisica Conference Series, 2, 51
- Wolff et al. (2004) Wolff, S. C., Strom, S. E., & Hillenbrand, L. A. 2004, ApJ, 601, 979
- Wolk et al. (2011) Wolk, S. J., Broos, P. S., Getman, K. V., et al. 2011, ApJS, 194, 12
- Wright et al. (2014) Wright, N. J., Drake, J. J., Guarcello, M. G., et al. 2014, arXiv:1408.6579
- Zeidler et al. (2016) Zeidler, P., Preibisch, T., Ratzka, T., Roccatagliata, V., & Petr-Gotzens, M. G. 2016, A&A, 585, A49
Appendix A Sky-subtraction procedure
The Gaia-ESO HR15n dataset on Tr 14/16 contains 185 pure-sky spectra from 137 distinct sky positions, taken simultaneously to the stellar spectra. We have identified the following components in these sky spectra:
-
1.
Sky-glow emission lines from Earth atmosphere: nearly identical within spectra from the same Observing Block, variable with time (from an Observing Block to the next), narrow within instrumental resolution, at fixed wavelength in Earth frame.
-
2.
Scattered solar light (typically moonlight): continuum with absorption lines, being essentially a solar spectrum at very low levels. Constant within the same Observing Block, but changing from one Observing Block to the next.
-
3.
Nebular H, He I, [N II] and [S II] lines: they originate from physically large regions near the target stars, and do not vary with time, but have a strong spatial dependence in their strengths, line shapes, widths, and velocities (see Paper I).
-
4.
Nebular continuum emission, from reflection nebulosity: a non-negligible component in Tr 14/16, free of solar-like spectral features but with a rather flat spectrum (like massive stars in the nebula), time-constant but space-variable (Paper I).
The standard Gaia-ESO pipeline is able to remove components 1-2 (constant within the same Observing Block, variable in time), but not to deal with components 3-4. Conversely, an attempt to correct a star spectrum using only the sky spectrum nearest on the sky would have more success in dealing with components 3-4, but would perform badly on components 1-2, when these are significant. Clearly, in the complex case of Tr 14/16 a combined approach is needed.
Stellar parameter evaluation relies on the depth of stellar absorption lines/bands, so that an accurately determined stellar continuum is of the greatest importance. Contamination by sky-glow or nebular lines is in this context a minor problem, affecting very localized wavelength regions/lines, which may be usually ignored in deriving star parameters (except for the case of H). We therefore focus first on sky continuum determination and correction.
In the Tr 14/16 dataset we find that the sky continuum does not contain traces of scattered sunlight, using two methods. We computed the cross-correlation function (CCF) of the sky spectra (nebular lines excluded) with a solar spectrum, looking for any peak near RV=0, but no such peak was found for any Observing Block. A second method was to fit the sky spectrum with a constant, flat spectrum plus a scaled solar spectrum: again, the scaling factor for the solar spectrum was negligibly small with respect to the other, flat, component, for all Observing Blocks. Instead, within the same Observing Block the median sky continuum level is found to vary significantly, and with a clear spatial pattern, a clear indication of a nebular (reflection) origin for this sky spectrum component.
In Tr 14/16, the absence of scattered solar continuum enables us to eliminate all time-variable sky signatures by just subtracting out the sky-glow lines: this will leave a purely ”star plus nebular” spectrum, and the nebular part will be later estimated from the whole set of (non-simultaneous) sky spectra in the same dataset. Sky-glow lines in the HR15n range, of sufficient intensity as to merit consideration in this context, are no more than 20 narrow lines. In principle, also some geocoronal H emission is expected, but in practice it is not detected against the enormously brighter H emission from the nebula. For each Observing Block, the sky-glow line spectrum, net of the adjacent continuum intensity, and averaged within the same Observing Block, was computed, and subtracted out from all spectra in the same Observing Block to obtain ”star plus nebular” or ”nebular-only” spectra, for stellar and sky spectra respectively.
Having eliminated terrestrial sky features in this way, the problem now reduces to estimate the most appropriate nebular spectrum to be used for correcting a given stellar spectrum. Since the spatial density of sky fibres (considering all Observing Blocks together) is much less than that of target star fibres, the correspondence between the nebular (and sky-continuum) emission in a stellar spectrum and in its nearest-neighbor sky spectrum is never found to be perfect. Distances between a given star and its nearest sky fibre are of order of 30” or more: the nebular morphology is here so complex that there is no guarantee that even the nearest sky is a good approximation to the sought nebular spectrum at the star position; one gets an idea of the range of variation of nebular spectrum in the vicinity of a given star by looking at more (say five) sky positions nearby. Therefore, we made subtraction of nebular spectra from stellar spectra five times per star, using its nearest five sky positions. Since the properties of nebular emission vary sometimes sharply, and definitely non-linearly in space, this is considered a robust method (within the limitations of the available data) to understand the uncertainties involved in the procedure.